Transcription
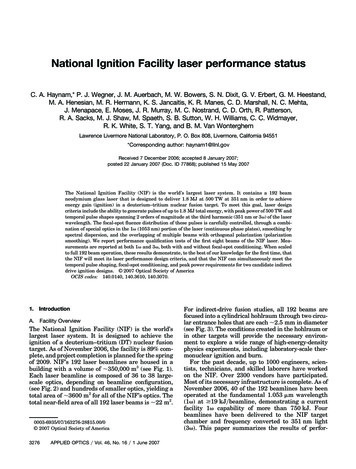
National Ignition Facility laser performance statusC. A. Haynam,* P. J. Wegner, J. M. Auerbach, M. W. Bowers, S. N. Dixit, G. V. Erbert, G. M. Heestand,M. A. Henesian, M. R. Hermann, K. S. Jancaitis, K. R. Manes, C. D. Marshall, N. C. Mehta,J. Menapace, E. Moses, J. R. Murray, M. C. Nostrand, C. D. Orth, R. Patterson,R. A. Sacks, M. J. Shaw, M. Spaeth, S. B. Sutton, W. H. Williams, C. C. Widmayer,R. K. White, S. T. Yang, and B. M. Van WonterghemLawrence Livermore National Laboratory, P. O. Box 808, Livermore, California 94551*Corresponding author: haynam1@llnl.govReceived 7 December 2006; accepted 8 January 2007;posted 22 January 2007 (Doc. ID 77868); published 15 May 2007The National Ignition Facility (NIF) is the world’s largest laser system. It contains a 192 beamneodymium glass laser that is designed to deliver 1.8 MJ at 500 TW at 351 nm in order to achieveenergy gain (ignition) in a deuterium–tritium nuclear fusion target. To meet this goal, laser designcriteria include the ability to generate pulses of up to 1.8 MJ total energy, with peak power of 500 TW andtemporal pulse shapes spanning 2 orders of magnitude at the third harmonic (351 nm or 3 ) of the laserwavelength. The focal-spot fluence distribution of these pulses is carefully controlled, through a combination of special optics in the 1 共1053 nm兲 portion of the laser (continuous phase plates), smoothing byspectral dispersion, and the overlapping of multiple beams with orthogonal polarization (polarizationsmoothing). We report performance qualification tests of the first eight beams of the NIF laser. Measurements are reported at both 1 and 3 , both with and without focal-spot conditioning. When scaledto full 192 beam operation, these results demonstrate, to the best of our knowledge for the first time, thatthe NIF will meet its laser performance design criteria, and that the NIF can simultaneously meet thetemporal pulse shaping, focal-spot conditioning, and peak power requirements for two candidate indirectdrive ignition designs. 2007 Optical Society of AmericaOCIS codes: 140.0140, 140.3610, 140.3070.1. IntroductionA.Facility OverviewThe National Ignition Facility (NIF) is the world’slargest laser system. It is designed to achieve theignition of a deuterium–tritium (DT) nuclear fusiontarget. As of November 2006, the facility is 89% complete, and project completion is planned for the springof 2009. NIF’s 192 laser beamlines are housed in abuilding with a volume of 350,000 m3 (see Fig. 1).Each laser beamline is composed of 36 to 38 largescale optics, depending on beamline configuration,(see Fig. 2) and hundreds of smaller optics, yielding atotal area of 3600 m2 for all of the NIF’s optics. Thetotal near-field area of all 192 laser beams is 22 m2.0003-6935/07/163276-28 15.00/0 2007 Optical Society of America3276APPLIED OPTICS 兾 Vol. 46, No. 16 兾 1 June 2007For indirect-drive fusion studies, all 192 beams arefocused into a cylindrical hohlraum through two circular entrance holes that are each 2.5 mm in diameter(see Fig. 3). The conditions created in the hohlraum orin other targets will provide the necessary environment to explore a wide range of high-energy-densityphysics experiments, including laboratory-scale thermonuclear ignition and burn.For the past decade, up to 1000 engineers, scientists, technicians, and skilled laborers have workedon the NIF. Over 2300 vendors have participated.Most of its necessary infrastructure is complete. As ofNovember 2006, 40 of the 192 beamlines have beenoperated at the fundamental 1.053 m wavelength共1 兲 at ⱖ19 kJ兾beamline, demonstrating a currentfacility 1 capability of more than 750 kJ. Fourbeamlines have been delivered to the NIF targetchamber and frequency converted to 351 nm light共3 兲. This paper summarizes the results of perfor-
Fig. 1. NIF is approximately 150 m 90 m and seven stories tall. The roof of the building has been removed from this aerial photo, andan engineering rendering of the laser is shown. The two laser bays are shown on the upper-left portion of the figure. The switchyard(in red) is shown on the lower-right side, as is the spherical target chamber (in silver), into which the 192 beamlines converge.mance qualification (PQ) tests conducted on the firstbundle of eight beams in 2005 to 2006. We also discuss some earlier four-beam experiments conductedFig. 2. (Color online) NIF’s large optics each have an area ofapproximately 40 cm 40 cm. The optic shown is a 7.7 m focallength wedged lens used to focus one beam onto the target. Thelens shown was used during the campaigns discussed in this paper.This photograph was taken after this lens was exposed to 11 shotswith between 8 and 9.4 kJ of 351 nm light (equivalent to between1.6 and 1.8 MJ of 351 nm light for the full 192 beam NIF).in 2003 to 2004, which explored the NIF laser operation in more detail. Recent tests in early 2006 utilized the precision diagnostics system (PDS) andculminated in shots that simultaneously achieved theFig. 3. (Color online) All of the 192 NIF laser beams are schematically shown focused into a single cylindrical hohlraum. Eachcone shown in the figure is composed of four individual beams. Thehohlraum is approximately 10 mm long by 5 mm in diameter. Thelaser entrance hole is 2.5 mm in diameter. Each laser beam willbe pointed to a precise location on the hohlraum wall and willgenerate x rays that will then drive the implosion of the central1 mm radius spherical fusion capsule. The ensuing nuclear reaction is expected to release over 10 MJ of energy.1 June 2007 兾 Vol. 46, No. 16 兾 APPLIED OPTICS3277
full per beam energy, peak power, pulse-shapingrange and finesse, and focal-spot conditioning forwhich the NIF laser was designed. They verify that,when completed, the full facility will be able to produce the laser drive required to perform a wide variety of high-energy-density experiments, includingcompressing DT capsules to densities 1000 g兾cm3for the inertial fusion ignition campaign.B.Laser OverviewWe summarize the laser design very briefly here. SeeRefs. [1–10] and the further references in those papers for detailed information. The performance of aphysics prototype for the NIF laser, Beamlet, wasdescribed in this journal several years ago [11]. References [12–16] discuss the laser energies and pulseshapes required for various ignition targets.The NIF laser pulse starts in a cw Yb-fiber masteroscillator. From here it passes through an array offiber-optical components to provide temporal amplitude and bandwidth control, and is split to drive 48preamplifier modules located under the transportspatial filter of the main laser (see Fig. 4). This injection laser system (ILS) will be discussed in moredetail in Section 3.Immediately following the ILS, 1% of the laserenergy is diverted to a diagnostic suite known as theinput sensor package (ISP). Here, the total energy,temporal shape, and near-field spatial shape fromeach preamplifier module (PAM) is measured [4]. TheILS can fire roughly one shot every 20 min. ISP measurements are important for both validating andnormalizing our numerical models of the laser performance and for assuring that the ILS is properlyconfigured prior to a main laser shot.Pulses from the ILS are split four ways, supplyingeach of four main beamlines with energy that is adjustable from millijoules to more than a joule. Figure 4shows a schematic of a single beamline of the mainlaser system. The pulse from the ILS is injected nearthe focal plane of the transport spatial filter (TSF). Itexpands to the full beam size of 37.2 cm 37.2 cm (atthe level of 0.1% of the peak fluence) and is collimatedby the spatial filter lens. It then passes through thepower amplifier (PA), reflects from a mirror and polarizer, and enters the cavity spatial filter (CSF). Ittraverses the main amplifier (MA), reflects off a deformable mirror that is used to correct wavefront distortions, and then goes through the MA and CSFagain. By the time it makes this second pass throughFig. 4. (Color online) Schematic of one of the 192 beamlines in theNational Ignition Facility. The laser’s path through the optics isdiscussed in the text.3278APPLIED OPTICS 兾 Vol. 46, No. 16 兾 1 June 2007the CSF, a plasma-electrode Pockels cell (PEPC)switch has been fired to rotate the beam polarizationby 90 , allowing it to pass through the polarizer and bereflected back for another double pass through theCSF and main amplifier. When it returns to the PEPC,the cell has switched off, so it now reflects from thepolarizer, and passes a second time through the PAand TSF. After the TSF, a beamsplitter reflects a smallsample of the output pulse back to the central TSFarea, where it is collimated and directed to an outputsensor package (OSP) located underneath the TSF.OSP diagnostics record the beam energy, temporalpulse shape, and near-field profiles [4]. The main pulseproceeds to the switchyard where four or five transport mirrors direct it to one of a number of final optics assemblies (FOAs) symmetrically located about,and mounted on, the target chamber. Each FOAcontains a 1 vacuum window, focal-spot beamconditioning optics, two frequency conversion crystalsto reach 351 nm wavelength, a focusing lens, a maindebris shield that also serves as a beam diagnosticpickoff to measure energy and power, and a 1–3 mmthick disposable debris shield. The debris shields areused to protect the optics from target debris.For the experiments reported in this paper, thebeam was not transported to the target chamber.Instead, an array of either seven or eight calorimeterswas inserted at the output of the TSF to both measure and absorb the 1 laser energy. When the eighthcalorimeter was absent, it was replaced by a pickoffthat routed that beam to a suite of diagnostic instruments called the PDS, which is described in AppendixA. PDS has an extensive suite of diagnostics for 1 ,2 , and 3 light. The PDS instruments can diagnoseone beamline in great detail, whereas the OSP diagnostics (described in Appendix B) can acquire 1 dataon all 192 beams during a shot. In PDS, the laser wasfrequency converted to the second or third harmonicusing typical NIF final optics. Diagnostics in the PDSallowed detailed study of the 1 beam entering theFOA and the 1 , 2 , and 3 beams exiting it.The MA contains 11 Nd-glass laser slabs. The PA isconfigured to have as many as seven slabs, but typically contains five. Some NIF shots have had one,three, or seven slabs in the PA to explore the full rangeof operating conditions. As an indication of scale, theCSF is 22 m long, the TSF is 60 m, the path lengthfrom the TSF output to the target chamber is 60–75 m,and the target chamber is 5 m in radius.The results presented in this paper cover the predicted and measured performance of the laser obtained during the final stages of the activation orcommissioning of the first of the NIF’s 24 bundles.The performance envelope of the 1 portion of thelaser was explored by a series of shots taken at progressively higher 1 energies. In Section 2, we compare model predictions of each of the eight beamlineswith measured energies, report the shot-to-shot energy reproducibility, and show the 1 power and energy operating envelopes for the NIF. The 3 powerand energy envelope, measured in PDS, is also shownin this section.
Fig. 5. (Color online) Comparison of modeled (dashed and solid curves) and measured (open and solid circles) energies for eight shots onBundle 31. The output energy is measured by the full aperture calorimeters.Section 3 details how a shaped pulse is created,diagnosed, amplified, and frequency converted as ittraverses the NIF laser. It also describes a series oflaser shots that validated the NIF’s capability ofmeeting its energy, power, and temporal contrast design goals. These PQ shots were taken with an entirebundle operating at 1 and with a single beamlinedelivered to the PDS, frequency converted, and diagnosed at 1 , 2 , and 3 .Section 4 describes the addition of focal-spot beamconditioning to the laser. It details the generation oftwo shaped pulses that have three beam-conditioningmethods applied, while simultaneously generatingthe single-beam 3 powers and energies planned forthe first ignition campaigns on the NIF. The appendices of this paper cover the details of our laser modeland the design and capabilities of the PDS.2. Bundle Performance at 1 and National IgnitionFacility Operating Envelopes at 1 兾3 Each of the NIF’s eight-beam laser bundles undergoes a 1 operational qualification (OQ) and PQ before being used in any experiments. The OQ-PQconsists of firing eight to ten shots, using all eightbeams, into a bank of full aperture calorimeters.These calorimeters measure absolute beam energyand calibrate a system of diodes in the OSP that serveas energy diagnostics during routine operations.Beam energies at 1 for these shots range from 1 to19 kJ, and pulse shapes are either flat in time (FIT)at the output or shaped to match user specifications.Besides verifying the bundle performance, theseshots are used to calibrate and validate the laserperformance operations model (LPOM) description ofthese beamlines, as described in Appendix C. TheLPOM is then used to predict laser performance andto set up the ILS for all NIF shots.A.LPOM Calibration ResultsFigure 5 shows the comparison between modeled performance using the LPOM and energy measurementsfor eight shots on the first bundle of the NIF laser. Inthis figure, output 1 energy refers to the energymeasured at the output of the main laser with the fullaperture calorimeters. The OSP was calibrated tothese calorimeters. The injected energy is inferredfrom the ISP measurements, the known four-way ILSbeam-split ratios, and the known transmission fromthe ISP to the injection at the TSF. The LPOM’spredictions differ from the measurements by no morethan 1.2%, demonstrating that the LPOM can beused to set the desired energy from each beamlineaccurately over an extended range of operations.Table 1. Analysis of the 1 Beam Energetics of Four Identical 19 kJ ShotsShot SequenceNumber1234Desired 1 Energy(kJ)19.02Average MeasuredBeamline 1 EnergyTotal Bundle1 Energy(kJ)Deviation ofAverage fromDesired(%)Standard Deviation ofBeamline Energiesfrom Mean(%)19.2019.1519.1119.10153.6153.2153.9153.8 0.98 0.68 0.50 0.430.840.940.670.891 June 2007 兾 Vol. 46, No. 16 兾 APPLIED OPTICS3279
Fig. 6. (Color online) Plot of 1 peak power per beam versus 1 energy per beam for initial NIF shots. The dark solid curve is the LPOM’s“equipment protection” operating limit.The laser 1 output energy is required to be reproducible to within 2% rms from shot to shot for properignition target performance. To test this performancecriterion, the 19.2 kJ shot in Fig. 5 was repeated threetimes. After the first shot, no adjustments were madeto either the injected pulse shape or the energy. AsTable 1 shows, agreement with the target energy, therms spread in total energy among the four shots, andthe standard deviation of the eight beamline energiesin each shot were all better than 1%. The estimatederror in the 19.2 kJ energy measurement is 1.4% or0.27 kJ. This error estimate is a root sum square (rss)sum of the observed random component (1.3%) and theknown systematic uncertainty (0.42%) of the NIST calibration standard used in calibrating the NIF’s calorimeters.B. Power versus Energy Operating Envelopes for theNational Ignition FacilityA system shot is defined as any event in which theflashlamps are fired in a bundle with all of the bundle’smain laser 共1 兲 optics installed. Since commissioningFig. 7. Plot of 3 beam power versus 3 beam energy for initial NIF shots.3280APPLIED OPTICS 兾 Vol. 46, No. 16 兾 1 June 2007
Fig. 8. Near-field fluence of 1 beam contrast (diamonds) versus1 fluence, measured at the converter input in PDS. These pointsrepresent shots covering the 1 operating range, and pulselengths, as shown in Fig. 6. Also shown, as a solid curve, is themeasured amplifier gain versus fluence showing that the contrastdrops as the gain saturates.the first four NIF beamlines in April 2001, the NIF hasfired over 600 system shots. Figure 6 shows a summary of the 1 shots fired together with the NIF standard 1 operating envelope as currently set in theLPOM. This envelope does not represent the absolutelimits of operation, as one can see from the severalshots that lie above the limit, but rather a guide forroutine operations. In general, the limit for high-poweroperation is set by the growth of small-scale intensityirregularities due to the nonlinear index in glass. Forhigh-energy operation, the limit is determined by theinjected energy available from the ILS.Figure 7 similarly summarizes all 3 shots since2001. This 3 performance space includes shapedpulses that meet or exceed the energy and power levelsrequired for the current ignition target design. TheNIF design operating range predicted [7] in 1994 isalso plotted on this figure. These initial 3 shots, combined with the validation of our LPOM projections overthe range of shots shown, indicate that we can achievethe design power versus energy range as described in1994.High-power operation of previous Lawrence Livermore National Laboratory (LLNL) Nd-glass laser systems was limited by small-scale beam breakup [11,17],driven by the nonlinear index of the transmissive optics in the beam path. Small-scale contaminants oroptics imperfections lead to beam intensity modulations. At high intensity, these modulations are amplified and focused by the nonlinear index effect. An earlysign of the development of this instability is growth inthe beam contrast, defined as the standard deviation ofFig. 9. (Color online) Schematic and power and兾or energy levels of the master oscillator and NIF pulse-shaping system. Fiber amplifiers(triangles) are used to compensate for optical losses as the initial cw beam is chopped by the acousto-optic modulator, frequency broadenedto 30 GHz bandwidth by the phase modulator, precompensated by the FM-to-AM compensator (to minimize amplitude modulation of thehigh-power beam), corrected for group-velocity dispersion in the dispersion compensator, then split, and finally temporally shaped in theAMC. The components shown produce the shaped pulse for all of the NIF’s 48 preamplifier modules.1 June 2007 兾 Vol. 46, No. 16 兾 APPLIED OPTICS3281
Fig. 10. (Color online) Temporal pulse shape at the output of the MOR for the two PQ shots designated as first PQ (N060329-002-999)and second PQ (N060329-003-999). The pulse shape was measured with a 1 GHz transient digitizer.the fluence divided by its mean value. Contrast is measured by taking a sample of the near-field beam, projecting it on a camera, and calculating the fluencevariation as recorded in the m n camera image.Fluence beam contrast 冑冉1 m n F共xi, yj兲 F 兺 j 1兺nm i 1F 冊2,F共xi, yj兲 pixelated fluence fromnear-field camera image,F average fluence of image.(1)Figure 8 demonstrates that the NIF contrast at theinput to the frequency converter consistently decreaseswith increasing fluence and energy per beam. The contrast reported here is calculated over the central27 cm 27 cm of the laser, measured with a NIFoutput camera. The decrease seen is a simple consequence of gain saturation: high-fluence regions in thebeam experience less net gain than low-fluence regions, tending to decrease any intensity modulation.The data in Fig. 8 span the NIF design operatingspace, indicating that the careful attention we havepaid to optical quality throughout the beamlines [2]has successfully controlled beam breakup.3. Performance Qualification Shots for Ignition TargetPulse ShapesFig. 11. (Color online) Schematic of ILS regenerative amplifier.Light enters the amplifier from the MOR fiber launch at the right ofthe figure (long-dashed line). It is collimated, passed through anoptical isolator, and injected through a polarizer into the main regenerative amplifier cavity (solid line). After passing through thePockels cell (PC1) once, the PC is switched on, trapping the pulse inthe cavity for approximately 30 round trips. During each round trip,the pulse passes twice through a diode pumped rod amplifier. Priorto the final pass, the PC is switched off, and the light exits througha second polarizer (short-dashed line). A motorized half-wave platein combination with a set of polarizers controls the energy transmitted to the next stage of amplification. A second Pockels cell (PC2) canbe used to clip off a trailing portion of the pulse that is meant tosaturate the regenerative amplifier for energy stability, but is notrequired in the rest of the laser. A 20 beam expander in combination with a beam-shaping module sculpts the beam to the desired spatial shape (solid line on left).3282APPLIED OPTICS 兾 Vol. 46, No. 16 兾 1 June 2007In March of 2006, we fired two 3 PQ shots separatedby 3 h and 18 min. This interval is significantlyshorter than the NIF design requirement of ⱕ8 hbetween system shots. Shot intervals of less than 4 hhave been repeated on a regular basis during thecommissioning of the first 40 NIF beamlines, with nodiscernable degradation in either beam wavefront ornear-field modulation.These PQ shots were taken to validate the NIF’scapability to meet its energy, power, and temporalcontrast design goals. One beam from each of theseshots was routed to the PDS. The other seven beamswere measured in the 1 calorimeters. We will followthe performance of the laser, as measured by thediagnostics, through the four sections of the laser,starting with the 1 sections [master oscillator room(MOR), PAM, and main laser] and finishing with the3 diagnostics following the FOA. A detailed discussion of the PDS diagnostics can be found in AppendixA. Appendix B describes the main laser diagnosticsand the calorimeters.A.Master Oscillator and Pulse-Shaping SystemThe MOR and pulse-shaping system (Fig. 9) createsthe temporal pulse shape specified by the LPOM. The
Fig. 12. Predicted (left) and measured, near-field profiles for the first (center) and second (right) performance qualification shots.LPOM determines a MOR temporal pulse shape thatcompensates for gain saturation in the rest of the 1 laser and for power dependence of the frequency converter efficiency, so that the desired 3 pulse shape isachieved.The pulse begins in a cw Yb-fiber master oscillatortuned to 1.053 m wavelength. The cw signal fromthe output of the oscillator is chopped by an acoustooptic modulator to a pulse width of 100 ns at a pulserepetition rate of 960 Hz. The light is phase modulated at a frequency of 3 GHz to a total bandwidth of30 GHz in order to suppress stimulated Brillouinscattering (SBS) in the main laser optics [18]. A highreliability fail-safe system is in place to guaranteethat the pulse cannot proceed beyond the MORunless adequate modulation has been applied toassure that SBS will be suppressed [8]. A separatemodulator operating at 17 GHz can apply more than150 GHz additional bandwidth at 1 共450 GHz at3 兲 for beam smoothing by spectral dispersion (SSD),as will be discussed in Subsection 4.B. The pulse nexttransits a cascade of fiber splitters and Yb-fiber amplifiers culminating in 48 fiber outputs each of 1 nJenergy. Each output goes into an amplitude modula-tor chassis (AMC) that sets the pulse shape for injection into a PAM.There are 48 AMCs, each of which independentlyprovides the pulse to drive the corresponding PAMand its associated four main beamlines. A digital oscilloscope immediately following the AMC records itspulse shape. The AMC controller averages a few hundred individual pulses, calculates the deviation ofthat average from the requested pulse shapes, andthen uses a negative feedback loop to minimize thisdeviation. Figure 10 compares the requested andmeasured pulse shapes for the two performance qualification shots.B.Preamplifier Module Description and PerformanceEach of the 48 pulses from the MOR enters the mainlaser bay on an optical fiber and is injected into aPAM, where it is amplified first by a regenerativeamplifier system and then by a four-pass rod amplifier [8 –10]. This is shown schematically in Fig. 11.The pulse makes 30 round trips in the regenerativeamplifier experiencing a gain that raises its energyfrom 1 nJ to 20 mJ, as appropriate for each PAM.After being switched out of the regenerative ampli-Fig. 13. (Color online) Schematic of the MPA system. Light enters from the regenerative amplifier at the right of the figure(long-dashed line), and transmits through the polarizer. The polarization is rotated by a series of half-wave plates and quarter-waveplates (HWPs and QWPs) so that the pulse passes four times through the 32 mm flashlamp-pumped rod amplifier (solid line) beforeexiting through the polarizer. Each pass is optically relayed using a set of two vacuum relay telescopes (VRT). These VRTsare evacuated to prevent air breakdown at the central focus of the telescope. As the pulse exits the cavity (short-dashed line), it passesthrough a combination of a motorized HWP and a polarization-sensitive mirror to allow control of the energy transmitted to the PABTSand the main laser.1 June 2007 兾 Vol. 46, No. 16 兾 APPLIED OPTICS3283
Table 2. Requested and Measured Energies at the Input and Output ofthe MPARequestedFirst PQ shotFirst PQ deviation (%)Second PQ shotSecond PQ deviation (%)MPA InputEnergy(mJ)MPA OutputEnergy(J)1.411.40 0.71.40 0.71.111.09 21.02 8fier, the pulse traverses a spatial shaping modulethat transforms the Gaussian spatial shape to a profile that is designed to compensate for the spatialnonuniformity of the gain throughout the rest of thelaser. Figure 12 compares the predicted spatial profile at the ISP location to measurements from the twoPQ shots. The ability to accurately shape the spatialprofile allows the NIF to produce beams at the outputof the system that have a flat irradiance distributionacross the central part of the beam.After passing through the beam-shaping module inthe PAM, the pulse is injected into the multipassamplifier (MPA), which is shown schematically inFig. 13. The beam makes four passes though theamplifier rod in the MPA, yielding a nominal netenergy gain of 1000. The overall energy gain of theILS is of the order of 109. LPOM uses both off-line andon-line data analysis to maintain ILS models thathave the accuracy needed to predict the energetics ofthis high-gain system. Table 2 shows a comparison ofthe modeled and measured energies at the input andoutput of the MPA for both PQ shots.The input energy to the MPA is monitored at 1 Hz.It is maintained at the requested value by a closedloop control using attenuation provided by the combined action of an adjustable half-wave plate and apolarizer used in transmission. The closed-loop con-trol mechanism produces energies within 2% ofthe request. The LPOM’s MPA model is accurate towithin 5% for injected energies ranging from 0.5 to10 mJ. Figure 14 shows a comparison of the predictedand measured ISP power sensor traces for the two PQshots.C.Main Laser 1 PerformanceAfter the ISP, the pulse is injected into the mainlaser—the part of the laser system that contains thefull-aperture 共40 cm兲 components. The near-field andfar-field spatial and temporal profiles at the 1 output of the main laser are modeled using the NIFvirtual beamline (VBL) propagation code, which hasbeen incorporated into the LPOM, as described inAppendix C. The LPOM contains detailed information regarding sources of wavefront distortion. Alllarge optics undergo full-aperture, high-resolution interferometer measurements during their manufacture. The interferometry data are used directly in theLPOM description for each optic at the position in thechain where the optic is located. The distortion induced as the laser slabs are deformed by nonuniformflashlamp heating has been both calculated and measured; calculated aberrations are used in the LPOM.Calculated estimates for distortions due to mountingstresses and a contribution for air turbulence in theamplifier cavities are also included. Finally, a modelof the 39-actuator, full-aperture deformable mirror,using measured influence functions for each actuator,is also used to represent the correction done on line inthe Hartmann sensor— deformable mirror loop.High spatial frequency wavefront errors generatecorresponding high spatial frequency intensity variations in the measured beam profile. Lower spatialfrequency wavefront errors (less than 0.1兾mm) affect spot size, not near-field intensity, because laserpropagation distances are insufficient for them to diffract into intensity variations. The lower spatial fre-Fig. 14. (Color online) Requested and measured temporal profiles at the output of the preamplifier module (prior to injection into the mainlaser) as measured by the ISP for the two PQ shots.3284APPLIED OPTICS 兾 Vol. 46, No. 16 兾 1 June 2007
Fig. 15. Comparison of (a) modeled and measured near-field 1 fluence distributions at PDS for the (b) first and (c) second PQ shots,respectively.quency variations in the near-field measurements arecaused primarily by the input spatial shape, gainspatial profiles, and aberrations in the laser frontend.Figure 15 compares the measured and modelednear fields at the 1 PDS near-field camera positionfor both PQ shots. These shots had a 1.8 MJ ignitiontarget pulse shape (discussed below under temporalpulse shaping) and 1 energy of 18 kJ per beam.Figure 16 shows an overlap of the measured andmodeled fluence probability distributions over thecentral 27 cm 27 cm of the beam. The first PQ shothad a slightly higher energy than the second (18.0 kJcompared with 17.6 kJ, due to an adjustment to theinjected energy). Agreement between the measuredand modeled contrast is sufficient for the LPOM tospecify laser energetics and pulse shapes, protectingagainst equipment damage caused by off-normal laser operation. The 0.5% absolute discrepa
Lawrence Livermore National Laboratory, P. O. Box 808, Livermore, California 94551 *Corresponding author: haynam1@llnl.gov Received 7 December 2006; accepted 8 January 2007; posted 22 January 2007 (Doc. ID 77868); published 15 May 2007 The National Ignition Facility (NIF) is the world's largest laser system. It contains a 192 beam