Transcription
MARIA S. MERIANCruise No. 04, Leg 3Fort de France – Las Palmas, 23 January – 14 February, 2007HYDROMAR IIITemporal and spatial variability of hydrothermal, geochemical andbiological systems at the Logatchev hydrothermal vent field, Mid-AtlanticRidge at 14 45' NCruise within the framework of the DFG SPP 1144:“From Mantle to Ocean: Energy-, Material- and Life-cycles at SpreadingAxes”C. Borowski, V. Asendorf, D. Bürk, A. Collasius Jr., R. Elder, M. Fabian, P.Forte, R. Fuhrmann, S. Hansen, C.L. Jost, R. Keir, J. Kevis-Stirling,N. Kevis-Stirling, M. Perner, J.M. Petersen, H. Røy,R. Schauer, O. Schmale, K. Schmidt, D. Scott, R. Waters, P. Wefers,S. Wetzel4-1
3.1ParticipantsNameVolker AsendorfChristian BorowskiDietmar BürkAlberto Collasius Jr.Robert Elder Jr.Marcus FabianPhilip ForteRobert FuhrmannScott HansenCristiane L. JostRobin KeirJennifer Kevis-StirlingNile Kevis-StirlingMirjam PernerJillian M. PetersenHans RøyRegina SchauerOliver SchmaleKatja SchmidtDara ScottRobert WatersPeggy WefersSilke WetzelMPI-BremenIfM-GEOMARWHOIJU-BremenUniv. Bremen3.2DisciplineIn situ sensorsChief ScientistBathymetryROV team, engineerROV team, engineerGeophysicsROV, team leader/pilotROV team, pilotROV team, engineerFluid geochemistry, metalsFluid geochemistry, gasesROV team, navigatorROV team, navigatorMicrobiologyHydrothermal symbiosesIn situ sensorsMicrobiologyCTD, dissolved gasesFluid geochemistry, metalsROV team, navigatorROV team, pilotFluid geochemistry, gasesHydrothermal , KielWHOI, Woods HoleWHOI, Woods HoleUniv. BremenWHOI, Woods HoleWHOI, Woods HoleWHOI, Woods HoleJU-BremenIFM GEOMAR, KielWHOI, Woods HoleWHOI, Woods HoleIFM-Geomar, KielMPI-BremenMPI-BremenMPI-BremenIFM-Geomar, KielJU-BremenWHOI, Woods HoleWHOI, Woods HoleIFM-Geomar, KielMPI-BremenMax Planck Institute for Marine Microbiology, Celsiusstr. 1, 28359Bremen, GermanyLeibniz-Institut für Meeresforschung an der Christian-AlbrechtsUniversität, Wischhofstr. 1-3, 24148 Kiel, GermanyWoods Hole Oceanographic Institutions, Woods Hole, MA 02543-1050,USAJacobs University Bremen, Campus Ring 8, 28759 Bremen, GermanyUniversity of Bremen, Bibliothekstraße 1 – 28359 Bremen, GermanyResearch Program(Christian Borowski)The Logatchev Hydrothermal Vent Field (LHF) at 14 45’ N on the Mid-Atlantic Ridge (MAR) isone key area for the investigation of spatial and temporal heterogeneity of bio-geo interfaceprocesses in hydrothermal vents within the DFG priority program SPP 1144 “From Mantle to4-2
Ocean: Energy-, Material- and Life-cycles”. Logatchev is one of only a few ultramafic-hostedhydrothermal systems worldwide. It is located on a small plateau on the eastern flank of the riftvalley in an area of the MAR that is dominated by mantle rocks with subordinate basalticmaterial. The hydrothermal fluids are influenced by subsurface serpentinization processes and asa consequence they are rich in methane and hydrogen.MSM 04/3 was the third in a series of SPP cruises to Logatchev. The overall goal was tocontinue the investigations of spatial and in particular temporal variability patterns of thehydrothermal activity started with RV Meteor cruises M 60/3 and M 64/2 in January 2004 andMay 2005, respectively. The main working tool of the cruise was the ROV Jason II from theWoods Hole Oceanographic Institution which was used to recover and redeploy geophysicalinstruments and geochemical in-situ measurement devices, and for accurate sampling ofhydrothermal fluids, sediments, macrofauna and microorganisms. During 12 days of work timein the LHF area, we performed eleven successful dives with a total of 105 hours of bottom time.Other instruments used were the CTD/Rosette water sampler, Miniature Automated PlumeRecorders (MAPR, NOAA) and the Kongsberg EM 120 multi-beam echosounder.One of the major objectives of the cruise was to replace instruments which had been set up inthe LHF in May 2005 for geophysical long-term measurements of microseismicity, tilt,acceleration, and temperature of the ocean floor, and temperature and pressure in the bottom-nearwater column. The data provide unique information on local seafloor motions for a recordingperiod of 8 months. They serve as proxies for changes in the conditions of the fluid regime andfor local spatial and temporal variability of habitats, and are essential for time seriesinvestigations of hydrothermal fluids and biological activity. With the replacement of themoorings we continue data collection until December 2007 when the instruments will berecovered by the next SPP cruise to the LHF.By using LBL navigation with Jason II, we recalibrated the geographical positions of thehydrothermal structures and established an accurate map which revealed that the active LHFharbors one more smoking crater than previously recognized. The sampling program performedby the ROV included the recovery of hot and diffuse fluids from all active structures forgeochemical and microbiological investigations, push cores from microbial mats and samples ofsymbiotic and other macrofauna. Other in-situ data collected included high-T-measurements withan 8 channel T-probe and small-scale profiling of physical and geochemical gradients such as T,O2 and H2S in hydrothermal sediments, microbial mats and mussel beds with an ROV operatedprofiler module.Plume mapping with the CTD and MAPRs revealed that the major direction of thehydrothermal plume extension was N-S. Additional information on the activity patterns in awider area around the presently known LHF vents is expected from the analyses of highresolution bathymetric mapping using the Kongsbergs EM 120 multi-beam echosounder. Wecontinued the mapping program that was started during Maria S. Merian cruise MSM 03/2 inDecember 2006 and extended the observation area northwards towards the 15-20-Fracture Zone.4-3
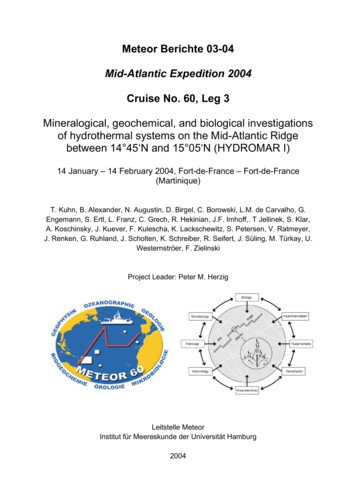
3.3Narrative of the Cruise(Christian Borowski)Friday 19. Jan. 2007: The loading of the ROV and scientific equipment started around 11:30 andwas finished some three hours later.Saturday 20. Jan. – Monday 22. Jan. 2007: Mobilization of the ROV began Saturday 08:00a.m. and continued during the next three days. The scientific team arrived on Monday and startedsetting up the laboratories and scientific instruments including the CTD and ROV peripheryequipment.Tuesday 23. Jan. 2007: Thanks to an excellent cooperation between ship crew, ROV teamand science, the ROV mobilization was completed within only three days. Jason II successfullypassed a harbour test in the late morning and Maria S. Merian left Fort de France as scheduled on23 January around noon time. We rounded Martinique on the south side and took headingtowards the Mid-Atlantic Ridge.Figure 3-1. Cruise track of MSM 04/3 from Fort de France, Martinique, to Las Palmas, GranCanaria, with the LHF target area on the MAR at 14 45’ N.Wednesday 24. Jan. – Friday 26. Jan. 2007: During the following three days, we travelledwith 12 kn and recorded bathymetry data after leaving the EEZ of Martinique. We initiallyfollowed a seamount chain at 15 N until 47 20'W where we slightly changed direction towardsLogatchev (fig. 3-1). A first stop for a CTD/Rosette background cast in 5000 m water depth wasmade in the evening of 25 January at 15 7.68'N, 51 22.41'W.Saturday 27. Jan. 2007: We reached Logatchev in the early morning and began station workwith setting out two underwater navigation LBL transponders. Calibration of the LBL4-4
transponders took some 6 hours and the ROV Jason II was launched for its first dive (Jason IIdive no. 253) from a German vessel at 14 44.91'N, 44 58.97'W in 3074.8 m water depth. Thepurpose was to gain orientation in the area around the“Irina II“structure and start sampling forbiota and fluids. This short dive ended successfully after 6 hours. Three CTD/Rosette castsfollowed during the night.Sunday 28. Jan. 2007: Jason II dive no. 254 to “Irina II” and “OBT site”; purpose of the dive:recover moored ocean bottom pressure meter (OBP) and ocean bottom tilt meter (OBT), deploynew OBT, put out in-situ measurement devices, sampling for biota and fluids; dive time 9.5 h.An unusual incident happened in the afternoon when we received a pan-pan call from a sailingboat with a broken mast in only 35 nm distance to the north of us. They asked for support withfood, water and diesel in order to be able to continue sailing with reduced speed to theirdestination in the Caribbean. We interrupted our work in the early evening, reached the boataround midnight and supplied the two sailors with what they needed. After reassuring ourselvesthat they would be able to safely continue their travel we wished them good luck and spent therest of the night with bathymetry mapping on the northern flank of the 15-20-Fracture Zone.Monday 29. Jan. 2007: Jason II dive no. 255 to “Irina II” and “OBT site”; purpose: deploy insitu measurement devices, sampling for biota and fluids; dive time 10.5 h. During the night:plume mapping tow-yo on a SE-NW profile across Logatchev with CTD/Rosette / MAPRs.Tuesday 30. Jan. 2007: Jason II dive no. 256 to “OBT site”, “Irina II” and marker “Anya”using the elevator for transport of equipment from bottom to surface; purpose of the dive: deploynew OBT, recover in situ measurement devices, sampling for biota and fluids; dive time 10.5hours. After recovery of the elevator, bathymetry mapping of the Logatchev area.Wednesday 31. Jan. 2007: Jason dive no. 257 to the smoking craters “Site B”, “Irina I” and“Anna-Louise” in the southern LHF area; purpose of the dive: hot fluid sampling, in situmeasurements, dive time 11.5 h. During this dive we discovered that the southern hydrothermalstructures include four instead of three to this date named smoking craters. All four structureshad been visited by earlier cruises as it was evidenced by deep-sea markers deposited on thecrater rims, but the two southernmost craters had not been recognized as independent structures.The night was spent with plume mapping by CTD/Rosette / MAPR tow-yo on a S-N profileacross the Logatchev field.Thursday 01. Feb. – Friday 02 Feb. 2007: Jason II dive no. 258 to “Irina II” and “Quest”;purpose of the dive: in situ measurements, sampling for sediments, fluids and biota using theelevator for equipment transport; dive time 24 h. After recovery of the elevator, bathymetrymapping south of the 15-20-Fracture Zone. In the evening, begin of Jason II dive 259 to “OBTsite”, marker “Anya” and “Quest”; purpose of the dive: in situ measurements, sampling forsediments, fluids and biota using the elevator for transport of equipment and samples; dive time13 h.Saturday 03. Feb. – Sunday 04 Feb. 2007: Recovery of ROV and elevator in the morning.During the day, one plume mapping tow-yo with CTD/Rosette / MAPRs on a NE – SW profileacross the Logatchev area. In the evening start of Jason II dive no. 260 to “Quest”, “Irina II” andthe southern smoking craters; purpose of the dive: in-situ measurements, sampling for fluids,sediments and biota using the elevator for transport of equipment and samples; dive time: 23 h.After recovery of the elevator in the evening, bathymetry mapping south of the 15 20’ fractureszone.4-5
Monday 05. Feb. 2007: Jason II dive no. 261 to marker “Anya”, “Irina II”, “Quest” and “SiteF”; purpose of the dive: recover T-loggers, in-situ measurements, sampling for sediments, fluidsand biota; dive time 12.5 h. In the evening deployment of a 25 m vertical temperature mooringmidway between “Irina II” and “Site B”.Tuesday 06. Feb. 2007: During night until morning, two CTD/Rosette casts south ofLogatchev. Later in the morning, Jason II dive no. 262 to “OBT site”, “Site F”, southern smokingcraters and “Site A”; purpose of the dive: deploy OBT, in-situ measurements, fluid sampling,sediment sampling using the elevator for transport of equipment; dive time 12.5 h. After recoveryof the elevator, 3 CTD/Rosette casts south of LHF.Friday 07. Feb. 2007: In the morning, deposit wood logs for a long term colonizationexperiment in the Logatchev field at 14 45.158’N, 44 58.696’W in 3003 m water depth using thedeep-sea wire. After that, Jason II dive no 263 to “Quest” and “Irina II”; purpose: bring out longterm temperature loggers at “Quest”, sample fluids and biota; dive time: 6 h. In the afternoon,recovery of the two LBL navigation transponders. End of station work at 19:00 LT. We leftLogatchev for transit back to Las Palmas with the EM 120 multibeam echosounder recordingbathymetry data.Saturday 08. Feb. - Wednesday 14. Feb. 2007: Six days of transit at an initial speed of 9.5 knbecause of oncoming wind and current. The transit time was used for demounting the ROV andthe scientific laboratories and for packing as far as possible. We initially headed towards aseamount at 25 50’N, 26 15’W in order to record its bathymetry. We passed the seamount onSunday, temporarily reduced speed to 8 kn while crossing it, and continued afterwards with 12kn speed towards Las Palmas. We reached Gran Canaria in the early morning of Wednesday andwaited off the coast of Las Palmas for harbor clearance. Maria S. Merian berthed at early noontime. Unloading of the ROV and scientific equipment started immediately and was completedwithin the afternoon. The science group and ROV team left the ship on Thursday 15. February.Summary of station work:Station work timeJason II dives:Total ROV bottom timeFree-fall elevator deploymentsCTD-MAPR tow-yosCTD/Rosette stationsMoorings depositedMoorings recoveredMulti-beam bathymetry surveys12 days, 27. Jan. - 07. Feb11 (incl. 2x 24 h dives)100.5 h4392164-6
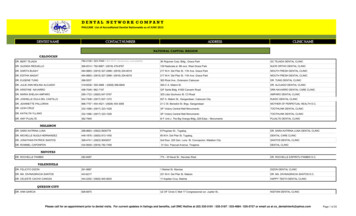
3.4Preliminary Results3.4.1Multibeam Bathymetry(Dietmar Bürk)Objectives, data collection and processingBathymetric data exist at resolutions of 100 – 200 m showing large-scale tectonic features in thelarger 15-20 N area (Fujiwara et. al. 2003, Escartin and Cannat 1999) and in the rift valleyaround the LHF that was mapped recently during RV Meteor cruise M 60/3 (Kuhn et al., 2004).The proposed objective of the bathymtetric survey in MSM 04/3 was to use the KongsbergEM120 echosounder for a high resolution mapping of selected key areas in the direct vicinity ofthe LHF in order to study the relationships between the tectonic fault pattern and hydrothermalactivity. However, this goal was already to a large extent achieved by the mapping in November2006 which was performed as a replacement program during Maria S. Merian cruise MSM 03/2.The focus of the mapping in this cruise was therefore adjusted to additionally collecting highresolution bathymetry data of the 15 20’ N Fracture Zone (15-20 FZ). Due to the limited time ofonly 12 working days and the priority of the ROV diving operations, the bathymetric mapping ofthe LHF and the 15-20 FZ was limited to 4 surveys with a total of 38:47 hours. Additionalbathymetric data were collected in the deep oceanic basins during the transits from Fort deFrance and to Las Palmas before and after the station work.We used the Kongsberg EM120 echo sounding system that operates at a frequency of 12 kHzwith a maximum ping rate of 5 Hz and processes 191 beams per ping at an opening angle of upto 150 degrees (optional equidistant or equiangular). The widths of single beams of thetransmitting and receiving transducers are 1x1, 1x2, 2x2 or 2x4 degrees. Measurements of theactual depth use a combination of amplitude (near-range measurements) and phase detection(mid- and far ranges). Data acquisition was performed with the Kongsberg SIS software anddata were processed with the open source software MB-System, release 5.0.8 from MBARI andLDEO (Caress and Chayes, 1996). Various grids were produced and the final maps generatedwith the Generic Mapping Tools (GMT), version 4.1 (Wessel and Smith, 1998).Transit to LogatchevThe multibeam echosounder was started after leaving the 70 nautical miles zone ofMartinique (opening angle of the beams 2 x 65 degrees, ping frequency 0.05 Hz). The transitspeed of the ship was 12 kn and the resolution of the along-track recording is 120 m. The initialship track followed a seamount chain at 15 N. Between 47 20' W and 45 10’ W we added aswath north to the transit bathymetry mapping performed by cruise MSM 03/2. The eastern endof this line closes the gap between the MSM 03/2 transit mapping in the south and bathymetricdata collected earlier in the north (Fujiwara et. al. 2003, Escartin and Cannat 1999).Inside Corner at the 15-20 Fracture ZoneThe so-called inside corner of the south segment of the MAR marks the transition of thesouth segment to the 15-20 FZ zone. This area mapped during 3 nights with a number of lines(Fig. 3-2). The survey started in the night of 28/29 January following the emergency operationfor the German S/V Spica with a line along the northern rim of the 15-20-transform fault. Allsurvey lines were mapped at 8 kn ship speed and with an opening angle of 2 x 45 , with the only4-7
exception of the initial transit from the LHF to the position of the emergency operation whichwas performed at 12 kn.The map on figure 4 shows a number of topographic highs south of the 15-20 FZ possiblyrepresenting so-called megamullions which are typical features of large detachment faults locatedat inside corners. The map also shows that the LHF is situated in a large fault zone that can betraced from 14 43’ N to almost 15 02’ N. This fault zone may be associated with to dateunknown hydrothermal vent activity.Figure 3-2. Pre-processed and gridded bathymetry data of the 15-20 FZ and inside corner downto the LHF. Gaps could not be closed due to time constraints.High-resolution survey of LHF 1Although the resolution of the new LHF maps produced with the new Kongsberg EM 120echosounder during MSM 03/2 was much higher than that of existing maps, there was still apotential for a further resolution increase by optimizing the sampling strategy. The resolution of abathymetric measurement on the seafloor is determined by the covered swath width, the numberof available beams and the physical resolution which equals manly the footprint size of a singlebeam (i.e. in 3000 m water depth 52 m in across- and along-track directions at 1 single beamangle). Beams within one footprint area do not resolve separate seafloor features, and thepotential for increasing resolution by narrowing the swath width is therefore limited. However,repeated independent sampling of the same area of sea floor with overlapping lines increases thestatistical sample size and thus can be used to increase the spatial resolution. In order to increasethe resolution beyond that of the MSM 03/2 mapping, we minimized footprint overlap (bychoosing an opening angle of 2 x 40 vs. 2 x 11 during MSM 03/2) while we kept to 0.5 nm linespacing. The resulting 5.4-fold across-track oversampling of individual footprint measurements4-8
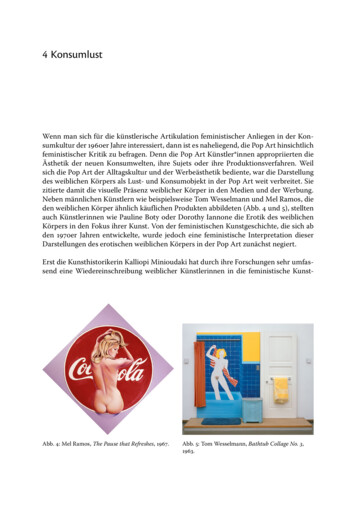
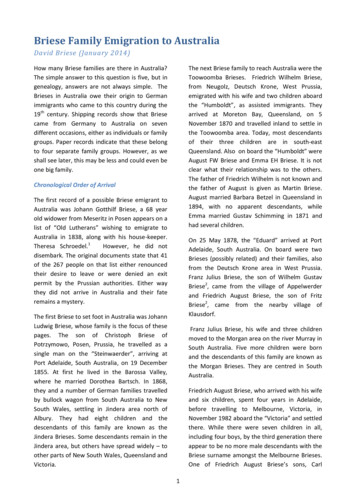
lead to a 2.3-fold resolution increase ( 5.4 2.3). At a ship speed of 4-5 kn and ping frequencyof 0.12 Hz, the along-track resolution is approximately 20 m.The survey covered an area of approximately 150 km2 including the active hydrothermalstructures of the LHF and some peripheral morphological features identified in MSM 03/2(“Little Sophie”, “Sophies Playground”, “Donut Volcano”). At a scale of 1:80.000 the newlyacquired bathymetry largely resembles that of the MSM 03-2 survey, with the exception that thedeep depression of “Devils Arena” is missing. Post processing after the cruise has revealed thatthis not a result of filtering or data editing, but that this structure is actually not present in thedata. (Fig. 3-3). The active hydrothermal vent structures remain below the resolution limit.Figure 3-3. High-resolution survey at Logatchev Hydrothermal Vent Field showing ventlocations and some morphological features (pre-processed and gridded data). The grid wascombined with data acquired during transit to CTD casts south of LHF-1.Determination of the minimum possible grid spacing (i.e. resolution) without using datainterpolation revealed that a grid with cells of 20 x 20 m contains almost no empty cells, while afurther decrease of cell size resulted in a progressive increase of empty cells. Grids with smallercell sizes therefore rely on interpolated data and provide less resolution. A comparison withMSM 03/2 data showed that the same gridding method resulted in more gaps. The quality of thedata can also be determined by plotting the number of data points in single grid cells. Figure 3-4shows that the MSM 04/3 data are more evenly distributed and show less gaps than the MSM4-9
03/2 data. However, despite of rather similar seeming results of the resolution tests, it isimportant that MSM 04/3 data to a much higher degree represent independent footprintmeasurements and therefore are considered much more accurate.Figure 3-4. Number of datapoints per grid cell for surveys MSM 04/3 (left) and MSM 03/2(right).Figure 3-5. Gridded amplitude data from EM120 raw data. Color scale is in normal mode, i.e.bright tones represent high backscatter, dark tones are low backscatter. The grid size is 30metres. Note the stong difference between the topographic highs and the Mid-Atlantic CentralValley.Associated with the depth measurements are the amplitude values of the returning signal.Gridded and plotted on a map they show the backscatter of the seafloor, bright tones representingstrong and dark tones low backscatter (Fig. 3-5). The clear backscatter difference between thetopographic highs (dark) and the lower levels down to the central ridge axis indicates stronginfluence of the topography on the returning signal. This may represent a lithologic borderbetween outcropping ultramafic rocks or gabbros on the topographic ridges and talus andsediments in the lower areas. The plateau with the hydrothermal vent sites appears as a darktongue directed towards the rift valley.4 - 10
Transit to Las PalmasThe transit to Las Palmas was used to map a large seamount at 26 12.00’ W, 25 47.50’ Nwith one line of swath bathymetry. The seamount rises from 5000 m to 1800 m water depth andis approximately 45 km (E-W) by 40 km (N-S) wide at its base. Despite a very large openingangle of the swath (2 x 65 ), the seamount was not covered entirely. The swath width thereforevaries between 21.5 km at the base of the seamount and 8.5 km on the summit. Additional lineswere not recorded because of limited time.3.4.2Calibration of the Geographic Coordinates of the Active LHF StructuresUsing Jason II and Discovery of a “new” Smoking Crater(Christian Borowski)The ROV Jason IIJason II is a two-body system with 6500-m depth capacity consisting of the Jason II vehicle andthe depressor Medea (Fig. 3-6). The depressor serves as a shock absorber, buffering the vehiclefrom movements of the ship. A 10-kilometer fibre-optic cable delivers electrical power andcommands from the ship through Medea down to Jason which then returns data and live videoimagery. Jason II is linked to Medea via a 35-m long and 20-mm wide neutrally buoyant tether.The two-component design allows very stable positioning of Jason II in the water column, e.g.,the vehicle can always keep cm-precise position in front of 3-dimensional seafloor structureswithout bottom contact and independent of the surface water sea state. The length of the tetherdetermines Jason’s radius for free operation around Medea, while travelling larger distancesrequires relocation of Medea by moving the ship. Jason II navigates with a long baselinetransponder navigation system using frequencies that range between 7.5 and 14 kHz and with aRDI 300 kHz bottom-tracking Doppler Velocity Log (300 m range). Jason’s video and photoimagery equipment includes one 3-chip colour camera (scientists pan & tilt), two 1-chip colourcameras (pilot’s pan & tilt, Light bar) three utility color cameras (manipulator, basket, aftlooking), and a digital still camera (operated by scientists). Jason has two hydraulic 7-functionmanipulator arms (Kraft Predator II with force feed back and Shilling Orion), a hydraulicforward sampling drawer (“basket”: 98 x 152 cm) and two hydraulic lateral swing arms (51 x 51cm each) that can be used for storage of samples or equipment. Jason’s payload for scientificinstruments or samples is 130 kg. Additional equipment or sample material can be transferredbetween surface and seafloor with an acoustically released free-falling elevator that has 90 kgpayload. Jason II was launched and recovered by RV Maria S. Merian’s crane no. 3 over thestarboard side, while Medea was operated via the large ship A-frame. Launching and recoveryprocedures required the full ROV team on deck.Three separate ROV team watches each with a pilot, an engineer and a navigator allowedcontinuous shift rotation during the dives in a 4-hours-on, 8-hours-off rhythm. The operation onthe seafloor additionally required three scientists in the control van (PI, protocol, videooperation). Turnaround time for vehicle deployment between the dives was 12 hours. Forpractical reasons, we always coordinated the launching and recovery of Jason II with the sameship watch and thus kept dive times to lengths of either 12 or 24 hours.4 - 11
Figure 3-6. The ROV Jason II. A: Launching of the vehicle Jason II; B: launching of Medea; C:View from Medea on Jason II during operation on the seafloor; D: Free-fall elevator.Foto and video documentationVideo imagery of the entire dives obtained with three cameras (3-chip science, pilot and lightbar) and still camera fotos are stored on DVDs (videos in NTSC and Pal formats). Frame grabsof the three video streams are accessible online together with the control van dive protocols inthe “Virtual Van” on http://4dgeo.whoi.edu/jason.Calibration of the geographical positions of LHF structuresInitial descriptions of the LHF included geological overview maps and micro-scale maps ofthe biologically most active structures which lacked exact coordinates (Krasnov et al. 1995,Gebruk et al. 2000). The relative positions of the vents to each other remained somewhat vagueand as a consequence, the re-localization of sites during later expeditions was time consuming.The LBL navigation system of Jason II offered the opportunity to accurately map thehydrothermal vent structures and calibrate their geographic coordinates.Two LBL navigation transponders equipped with 200-300 m long tethers in order tominimize acoustic shadows were positioned some 0.8 and 1.3 nautical miles upslope of the LHFvents in 2566 m and 2510 m water depth (14 46.188’N, 44 58.028’W and 14 45.420’N,44 57.954’W). The additionally used Doppler Velocity Log used with the Jason DVL softwareprovided highly accurate relative positions to the ship. During a total of 11 dives, we repeatedlyvisited all known hydrothermal structures that align along roughly 520 m distance in NW-SEdirection between the smoking crater “Quest” and the chimney structure of “Site A”. Theresultant coordinates of the positions of the LHF hydrothermal vent structures are listed below(Figs 3-7, 3-8; Tab. 3-1).Discovery of the previously unrecognized smoking crater “Candelabra”Apart from the exact positions of the vents, the accurate navigation data also revealed that thesouth-eastern hydrothermal structures have been misinterpreted in the past. Gebruk et al. (2000)described the three smoking craters “Site B”, “Irina I” and “Anna-Louise” aligningapproximately in N–S direction in the southern part of the active LHF. Our data clearly show thata fourth smoking crater is present between “Irina I” and the double crater structure “Anna4 - 12
Figure 3-7. Calibrated geographic positions of active LHF structures (circles) and some markers(crosses) deposited by MSM 04/3 and earlier cruises. “OBT site” is the location of OBT andOBP deposition during M 64/2 and this cruise. Marker positions of the hydrothermal structuresrepresent the coordinates given in table 3-1. “25-m T-mooring” marks the position of a verticaltemperature logger mooring deposited during this cruise. “Wood” marks the position of a woodlog deposited for colonization experiments. “Mat 1” was sampled for microbiological studies.Markers “C”, “Anya”, and “Professor Logatchev” were deposited during earlier cruises.Table 3-1. New coordinates of the LHF hydrothermal vent structures obtained by LBLnavigation with Jason II.SiteLatidtudeLongitudeWater DepthQuest14 45.175’N44 58.836’W3026 mMarker Anya14 45.171’N44 58.770’W3029 mIrina II14 45.167’N44 58.752’W3021 mSite F14 45.135’N44 58.728’W2963 mSite B14 45.100’N44 58.686’W2946 mIrina I14 45.076’N44 58.668’W2935 mCandelabra14 45.067’N44 58.656’W2926 mAnna-Louise14 45.057’N44 58.644’W2911 mSite A14 45.046’N44 58.608’W2914 m4 - 13Distance betweenstructures121 m38 m67 m110 m50 m33 m30 m70 m
Louise” (Figs 3-7, 3-8, Tab. 3-1). This “new” crater has been marked and sampled during earliercruises including M 60/3 and M 64/2, but was never recognized as a separate structure and wasconsidered by mistake either as “Irina I” or “Anna-Louise”. The new structure is smaller than thedouble crater “Anna-Louise” and resembles “Irina I” and “Site B” in size. We named it“Candelabra” referring to a black smoker on its rim which had already been named duringMeteor cruise M 60/3.Figure 3-8. Detailed bathymetric map of the LHF including the hydrothermal structuresaccording to Jason II LBL navigation data. Contour interval is two metres.3.4.3Gas Chemistry(Robin Keir, Oliver Schmale, Peggy Wefers)During MSM 04/3, methane and hydrogen were measured in vent fluids, in samples collectedfrom the water column and in gas samples from experimental kinetic studies. Additional watersamples were collected for helium isotope analysis at the University of Bremen, and gas sampleswere preserved for carbon isotope analysis on the methane component. The measurements on thevent fluids and water column samples are part of an ongoing monitoring program of theLogatchev biology and chemistry and are described in this section.Vent fluids were obtained on nearly every ROV dive with a titanium sampling device (
Volker Asendorf In situ sensors MPI-Bremen . USA JU-Bremen Jacobs University Bremen, Campus Ring 8, 28759 Bremen, Germany . microbial mats and mussel beds with an ROV operated profiler module.