Transcription
Integration of SnortNIDS with Splunk forThreat Hunting andPenetration TestingPREPARED FORProfessor Ali HadiSEC350-02PREPARED BYCaitlin Allen & Doug KapinosYour students
Project Goals andScopeIn an environment set up from scratch, we integrated the network intrusion detectionsystem (NIDS) Snort with our security information and event management (SIEM)solution Splunk. The environment was set up to meet all requirements forsegmentation, firewalling, and logging (which will be highlighted in thedocumentation).In a working environment, your IDS system, whether it be Snort, Zeek/Bro, Suricata, orSolarwinds, should be right behind the firewall, with the firewall placed in front as thefirst line of defense. For simplicity, we located ours within the DMZ. Now you may findthat Endpoint Detection and Response (EDR) tools are more commonly used incommercial organizations using pricey solutions from top companies like Crowdstrike’sFalcon or Elastic’s Endgame. But for a smaller organization or a private network like ourenvironment, financially it is not feasible.Snort is a free NIDS, with the option to pay for different rule sets to use in our firewall.Snort also provides sniffing and packet logging modules to use as well, making it awell-rounded packet analysis tool. We will be using the Community Rules anddesigning a few of our own local rules. Snort rule sets are easy once you get the syntaxdown and can understand the rule structure.This is the general syntax you want to follow. For any additions to the syntax, they willbe explained.
Log output can be formatted in a few different ways, like:-alert syslogalert fastalert fullalert unisockThere are a few different other ways to format them, but we will be using alert syslog.The alert syslog format ships logs to the syslog, you can specify the logging facilityand priority within the Snort config file and ship these logs to your SIEM solution.
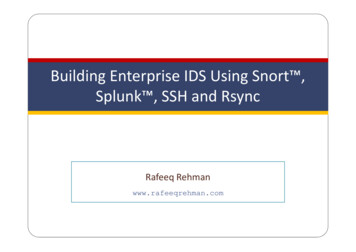
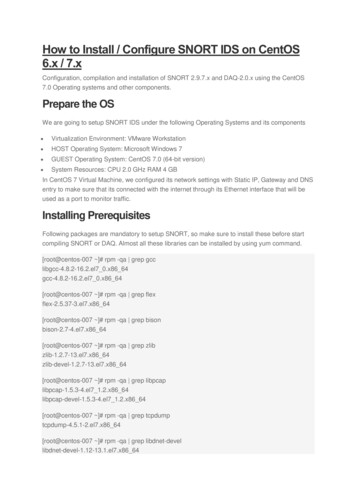
Our penetration testing platform is Mutillidae, is an open-source deliberately vulnerableweb-application that allows upcoming pen testers or web app security enthusiasts topractice exploits. This web app is installed using the LAMP stack, composed of fourdifferent open-source dae is easy to use and allows the user to toggle levels of security, gives hints, andoffers OWASP resources on different exploits.Figure 1: Mutillidae home screen on our Ubuntu Web workstationFigure 2: Network topology of our environment
1. Setting up Snort on CentOS 7In these instructions, we will assume your segmented network already exists. Our focus isspecifically on our snort server and the Ubuntu web workstation. Your SIEM solution forintegration should be properly configured to ingest logs forwarded to it.We need to install from the source, Snort ran into issues with installing from yum. Thisdocumentation is for the current version of Snort available, the download link for a morecurrent version later is available on the S nort website under Binaries.1. Installing from source.sudo yum .0.6-1.centos7.x86 64.rpmsudo yum -2.9.16-1.centos7.x86 64.rpm2. Create folder structure for Snort. It is best to do this now, issues arose if it was doneafter other steps.mkdir -p /etc/snort/rulesmkdir /var/log/snortmkdir /usr/local/lib/snort dynamicrules3. Set directory R-R5775 /etc/snort5775 /var/log/snort5775 /usr/local/lib/snort dynamicrules5775 /usr/local/lib/snort dynamicrulessnort:snort /var/log/snortsnort:snort /usr/local/lib/snort dynamicrules4. Create new rule files, this is needed so the configuration file is able to executeproperly.touch /etc/snort/rule/white list.rulestouch /etc/snort/rules/black list.rulestouch /etc/snort/rule/local.rules5. Configure Snort to run in NIDS modesudo ldconfig
sudo ln -s /usr/local/bin/snort /usr/sbin/snort6. Set up the Community rules, these are user made and important in making sureSnort runs properlywget https://www.snort.org/rules/community -O /community.tar.gzsudo tar -xvf /community.tar.gz -C /sudo cp /community-rules/* /etc/snort/rulessudo sed -i 's/include \ RULE\ PATH/#include \ RULE\ PATH/'/etc/snort/snort.conf7. Configure the network and rule sets by opening the Snort configuration file.sudo vi /etc/snort/snort.conf8. Make the changes listed belowIn Vim, you can use / to search for lines! This is a long configuration file so be sure tomake sure you made these changes.Add the network address and mask to this line# Setup the network addresses you are protectingipvar HOME NET Network To BeProtected/XX# Set up the external network addresses. Leave as "any" in mostsituationsipvar EXTERNAL NET ! HOME NET# Path to your rules files (this can be a relative path)var RULE PATH /etc/snort/rulesvar SO RULE PATH /etc/snort/so rulesvar PREPROC RULE PATH /etc/snort/preproc rules# Set the absolute path appropriatelyvar WHITE LIST PATH /etc/snort/rulesvar BLACK LIST PATH /etc/snort/rules#syslogOutput alert syslog host IP OF SYSLOG BOX:514 LOG AUTH LOG ALERT
# unified2# Recommended for most installsoutput unified2: filename snort.log, limit 128Uncomment the following linesinclude RULE PATH /local.rulesinclude RULE PATH /community.rules9. Validate the Snort settingssudo snort -T -c /etc/snort/snort.conf10. If you get an error, run this command and retry to validate the settings.ln -s /usr/lib64/libdnet.so.1.0.1 /usr/lib64/libdnet.1When Snort is successfully installed and initialized, you should see this.Figure 3: Snort successfully stood up in CentOS 711. You now can test the configuration by setting a basic rule to alert ICMP connections.This can also be tweaked to alert for potential nmap attempts since nmap utilizesICMP for OS Fingerprinting, service detection, and network scanning.Open the rules upsudo vi /etc/snort/rules/local.rules12. Add this to the filealert icmp any any - HOME NET any (msg: "ICMP test" ; sid:10000001;rev:001;)13. Start Snort and ping the snort host from your web box. You should see ICMP testalerts roll in on the screen.sudo snort -c /etc/snort/snort.conf -i [Interface]
2. Snort logs on SplunkOpen up the search application on your Splunk host. You can view the logs by host,however, it is easier to search by source. Look for the snortd.log. You can update by latestlogs in this to find it easier.Figure 4: Splunk snortd.logs and where to find them in the search app
Figure 5: ICMP test logs (Field extraction done for Dashboards)3. Setting Up MutillidaeOn the snort host, you will be installing the following his is a CentOS box so yum is how you should be downloading these packages!Start the httpd service after installation and open port 80 with firewall-cmdWe need to do a MySQL secure installation.Run the followingsudo mysql secure installation
This will prompt you for your root password then ask you to change it. You do not need tochange your root password if you do not want to.For the following questions after the password prompt, make sure to allow remoteaccessNow, run the following to grab Mutillidae off Githubsudo git https://github.com/webpwnized/mutillidaeCopy the Mutillidae folder into /var/www/htmlThen navigate to http:// LOCALHOST IP /mutillidaeIf successful, you should see the followingFigure 6: Mutillidae4. Integrating Snort with MutillidaeSince Snort is a traffic analyzer, let's set some rules to pick up potential attacks fromMutillidae.Open the local.rules file again.
Lets add some basic rules to detect SQL Injections, Command Injections, and Cross-SiteScripting attacks.Figure 7: Snort local.rulesOur Snort rules are pretty basic, but h ere is a good place to find some more advanced SQLand XSS related rules.Lets test our Cross-Site Scripting rule.
In Mutillidae:1. OWASP 2017 Cross Site Scripting (XSS) Reflected (First Order) EchoMessage2. Enter the Following3. An alert should pop up if successful. Lets go to Splunk4. If successful, logs should roll through.
Try other methods to ping off your command injection alert and SQL injection alert. Heressome hintsTry to get some logs like this and we can begin to make dashboards
5. Dashboard BuildingEvery good SOC analyst wants a comprehensive dashboard they can open Splunk right upto.Figure 15: Home dashboardIn the search app, open up the Dashboard module.
Lets make a dashboard like this one, but for our Snort logs.Figure 16: Authentication dashboardLets make a line graph of Cross-Site Scripting AttemptsCreate a line graph dashboard panel, for the search, we’ll want to see what hosts arespiking in activity.Enter this for your search using your snort.log
Figure 17: Search syntax for panelsYou want to pipe your results to timechart to show the timing of the attacks, which wouldbe needed for incident response to generate a timeline and identify when an attacker madeattempts, you will then count by host to count each time a host has been breached.
Figure this out for the other attacks and even add a few other panels, we included nmapattempts for ICMP tests and failed logons by host in case of brute force. To make thiseasier, use field extraction to extract the exact log messages from Snort you are looking for.Figure 18: Final dashboard of Snort logs and failed logons with ICMP connectionsYou can add this to your home page if you like!7. Troubleshooting & IssuesOur environment was built on Caitlin’s HP Proliant DL380 Gen 7 server with ESXihypervisor. Different network segments were created within ESXi to segment the networkand configure the firewalls.Each VM had to be loaded as an ISO then deployed. One issue we discovered early on waswith the unstable version of VyOS we were using, since stable current versions cost money,anytime Caitlin shut down the server, our VyOS settings were wiped from the entire VM.Committing to the configuration file did not matter, VyOS essentially had volatile memory.To solve this, anytime any work was done on VyOS, we snapshotted the machine and wereable to overcome this by restoring from the snapshot.Another issue was Snort’s network placement. It was not intended to be set up as a hostbut as a NIDS for the DMZ. However, just due to configuration issues and realizing that itwould not intercept until too late, we decided to put Mutillidae on snort and log directlyfrom the box. To solve this, we would have had to do major network reconfigurations.
8. ConclusionSnort is a fun packet analyzer with many capabilities! Using the provided link and Snortdocumentation, building rules to integrate with SplunkYou can use simple rules to get started and use regex, encoding, etc. to get more precise inwhat your NIDS will detect and ship to Splunk.Our environment was built on Caitlin’s HP Proliant DL380 Gen 7 server with ESXihypervisor. Different network segments were created within ESXi to segment the networkand configure the firewalls.
Snort is a free NIDS, with the option to pay for different rule sets to use in our firewall. Snort also provides sniffing and packet logging modules to use as well, making it a well-rounded packet analysis tool.