Transcription
ARL-TR-8175 SEP 2017US Army Research LaboratoryGenerating Artificial Snort Alerts andImplementing SELK: The Snort–Elasticsearch–Logstash–Kibana Stackby Daniel E Krych, Joshua Edwards, and Tracy BraunApproved for public release; distribution unlimited.
NOTICESDisclaimersThe findings in this report are not to be construed as an official Department of theArmy position unless so designated by other authorized documents.Citation of manufacturer’s or trade names does not constitute an officialendorsement or approval of the use thereof.Destroy this report when it is no longer needed. Do not return it to the originator.
ARL-TR-8175 SEP 2017US Army Research LaboratoryGenerating Artificial Snort Alerts andImplementing SELK: The Snort–Elasticsearch–Logstash–Kibana Stackby Daniel E Krych, Joshua Edwards, and Tracy BraunComputational and Information Sciences Directorate, ARLApproved for public release; distribution unlimited.
REPORT DOCUMENTATION PAGEForm ApprovedOMB No. 0704-0188Public reporting burden for this collection of information is estimated to average 1 hour per response, including the time for reviewing instructions, searching existing data sources, gathering and maintaining thedata needed, and completing and reviewing the collection information. Send comments regarding this burden estimate or any other aspect of this collection of information, including suggestions for reducing theburden, to Department of Defense, Washington Headquarters Services, Directorate for Information Operations and Reports (0704-0188), 1215 Jefferson Davis Highway, Suite 1204, Arlington, VA 22202-4302.Respondents should be aware that notwithstanding any other provision of law, no person shall be subject to any penalty for failing to comply with a collection of information if it does not display a currentlyvalid OMB control number.PLEASE DO NOT RETURN YOUR FORM TO THE ABOVE ADDRESS.1. REPORT DATE (DD-MM-YYYY)2. REPORT TYPE3. DATES COVERED (From - To)September 2017Technical Report6/1/2016–8/12/20164. TITLE AND SUBTITLE5a. CONTRACT NUMBERGenerating Artificial Snort Alerts and Implementing SELK: The Snort–Elasticsearch–Logstash–Kibana Stack5b. GRANT NUMBER5c. PROGRAM ELEMENT NUMBER6. AUTHOR(S)5d. PROJECT NUMBERDaniel E Krych, Joshua Edwards, and Tracy Braun5e. TASK NUMBER5f. WORK UNIT NUMBER7. PERFORMING ORGANIZATION NAME(S) AND ADDRESS(ES)8. PERFORMING ORGANIZATION REPORT NUMBERUS Army Research LaboratoryATTN: RDRL-CIN-DAdelphi, MD 20783-1138ARL-TR-81759. SPONSORING/MONITORING AGENCY NAME(S) AND ADDRESS(ES)10. SPONSOR/MONITOR'S ACRONYM(S)11. SPONSOR/MONITOR'S REPORT NUMBER(S)12. DISTRIBUTION/AVAILABILITY STATEMENTApproved for public release; distribution unlimited.13. SUPPLEMENTARY NOTES14. ABSTRACTThis report details the development of an artificial Snort alert generator and the configuration of a Snort–Elasticsearch–Logstash–Kibana (SELK) stack for parsing, storing, visualizing, and analyzing Snort alerts. The first section covers the Snortalert-generation program, the methodology involved in developing it, and how it accelerates Snort-related research. Thesecond section covers the development of configuration files and the pipeline for the SELK stack, followed by its deploymentand uses. We develop the program, gen alerts.py, which takes in a Snort rules file and generates artificial Snort alerts with aspecified priority distribution for outputting high, medium, low, and very low alerts based on Snort’s classifications. Weconstruct the ELK pipeline, using Logstash to parse and organize Snort alerts. These generated alerts head this pipeline tocreate the SELK stack. To enable rapid deployment, we implement this system in a lightweight Lubuntu virtual machine thatcan be imported and used with VirtualBox or VMware. In addition, we provide an instructional guide on system setup. Themethodologies described can be translated to the setup and use of the ELK stack for storing and visualizing any data.15. SUBJECT TERMSSnort, Elastic, Elasticsearch, Kibana, Logstash, ELK, SELK, data visualization, IDS, IPS, networking, traffic analysis16. SECURITY CLASSIFICATION OF:a. REPORTUnclassifiedb. ABSTRACTUnclassifiedc. THIS PAGEUnclassified17. LIMITATIONOFABSTRACT18. NUMBEROFPAGESUU3619a. NAME OF RESPONSIBLE PERSONTracy Braun19b. TELEPHONE NUMBER (Include area code)(301) 394-4954Standard Form 298 (Rev. 8/98)Prescribed by ANSI Std. Z39.18ii
ContentsList of FiguresivList of Tablesiv1.Introduction12.Methodology22.1. Snort Alert Generation22.2 The SELK Stack83.Discussion and Conclusion114.References13Appendix A. Using the Snort Alert Generator gen alerts.py 15Appendix B. Leveraging the Snort–Elasticsearch–Logstash–Kibana (SELK)Stack Using the Prebuilt, Lightweight Lubuntu Virtual Machine17Appendix C. Implementing Snort–Elasticsearch–Logstash–Kibana (SELK)in Your Environment19List of Symbols, Abbreviations, and Acronyms28Distribution List29Approved for public release; distribution unlimited.iii
List of FiguresFig. 1gen alerts.py outputting 10 generated alerts . 3Fig. 2gen alerts.py usage outputted with “-help” flag . 7Fig. 3The SELK stack pipeline . 9Fig. 4“Default2” Dashboard we created and provide:dek kibana viz setup Aug-16.json . 11List of TablesTable 1Predefined priority distributions . 3Table 2The header and options sections of a Snort rule used in the crafting ofa Snort alert . 5Approved for public release; distribution unlimited.iv
1.IntroductionSnort is an open-source network intrusion prevention system (NIPS) and a networkintrusion detection system (NIDS) developed by Sourcefire.1,3 When running Snortin Intrusion-Detection mode, network traffic is monitored and a rules file(.rules) is used to set the traffic rules and generate alerts when one of these rulesis satisfied. For example, a rule in the configuration file could tell Snort to generatean alert whenever it sees a transmission control protocol (TCP) connectionestablished by a private network connecting to a public network. Users can alsospecify actions such as dropping the packet altogether. Snort rules can become veryspecific and target specific programs/malware by looking for known IP addresses,port numbers, byte values seen in packets, and so on. Snort uses a classificationsystem with 38 classifications for alerts. These include things such as “trojanactivity”, “shellcode-detect”, “denial-of-service”, “network-scan”, and “miscattack”. Each classification has an associated priority level from 1 to 4, defined ashigh (1), medium (2), low (3), and very low (4). By default on a Linux system,alerts generated by Snort are stored in the file /var/log/snort/alert.1 Alertscan then be examined by analysts to find patterns of misuse or indications ofgradual attacks. This analysis can help network defenders stop some attacks beforethey succeed.Elasticsearch, Logstash, and Kibana are free, open-source tools offered by thecompany Elastic. Elasticsearch is a search and analytics engine built on top ofApache Lucene, an information retrieval library, and enables efficient data storageand retrieval similar to a database. Logstash is a data collection and transportationplatform that provides a way to ingest data from one source, filter and map the dataas specified in a configuration file, and push them to another source (in this case,Elasticsearch). Kibana is a visualization platform, which reads Elasticsearch dataand provides a graphical interface to query, analyze, transform, and monitor thedata.2 Each of these tools runs independently and communicates with itspredecessor/successor in the pipeline, and together they form the ELK stack.We have created the (Snort–Elasticsearch–Logstash–Kibana) SELK stack, whichconsists of the generating, parsing, storing, visualizing, and analyzing of Snortalerts with the ELK stack. An overview of the pipeline in a Linux system entailsthe following:1) Snort IDS writes alerts as network traffic matches rules.Approved for public release; distribution unlimited.1
2) Logstash detects alerts being added to the alert file, ingests them, appliesthe rules specified in the configuration file to filter, and map values tovariables, then pushes them to Elasticsearch in JSON format.3) Elasticsearch stores the JSON-formatted Snort alerts.4) Kibana connects to Elasticsearch and provides a graphical interface forviewing the data stored. Kibana can then generate graphs and visualizationsdisplaying the information in useful ways. It also enables near-real-timemonitoring of the data.This work aims to promote and accelerate US Army Research Laboratory (ARL)research involving the use of Snort and the ELK stack for parsing, storing,analyzing, and visualizing Snort alerts or any data in several ways:2. Anyone looking for a better way to store and examine Snort alerts can usethis system out of the box. End users can use the 2 parts to this system—the Snort alert generator andthe ELK stack system—independently and gain insight into setting up asimilar system with their own data by following the instructional guide inAppendix C, and altering the Logstash configuration file to parse their dataspecifically. The Snort Alert Generation program allows end users to generate realisticSnort alerts based on their rules files without having to run Snort. This alsoprovides interesting test data for any system that ingests Snort alerts. The SELK stack demonstrates the capabilities of the open-source ELK stacksuite, and outlines the methodology involved in filtering, storing, andvisualizing the data. Anyone looking to expand upon their data collection,or looking to replace a less-robust storage and visualization system, willwant to experiment with the ELK stack.Methodology2.1. Snort Alert GenerationThe main idea is a program that takes in a Snort rules file and generates artificialalerts based on the rules found in the file provided. The name of this program isgen alerts.py. End users can specify N, the number of artificial alerts to begenerated. The program will then output “fast” formatted alerts. The fast format isApproved for public release; distribution unlimited.2
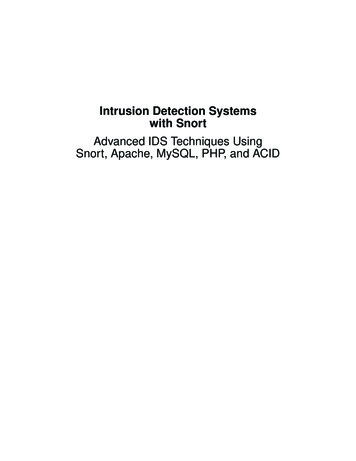
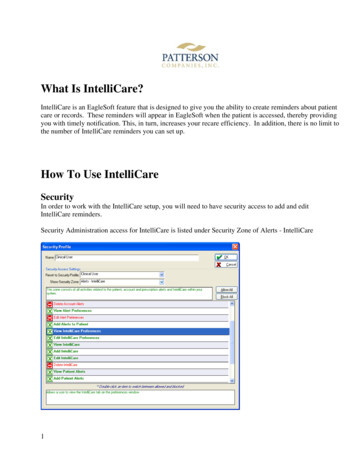
one of Snort’s available formats, and it prints a quick one-line alert, whereas the“full” format prints alerts with full packet headers and is far more verbose.Because Snort uses a classification-priority system to rank the severity of alerts, wealso wanted to give the end user some freedom on specifying the prioritydistribution they desired. We defined 5 priority distributions from which end userscan choose, which are shown in Table 1.Table 1Prioritydistribution12345Predefined priority y lowalerts2%2%2%2%2%By default, we set the priority distribution to “2,” which generates 10% high, 29%medium, 59% low, and 2% very low alerts. Only 1 classification in Snort’s defaultsettings is specified as “very low,” and this is for a “tcp-connection” seen.Therefore, we decide to limit the percentage of these to only 2%, because very littlevariability exists when generating alerts at this priority level. The final product ofour program is seen in Fig. 1, which shows 10 alerts generated using thecommunity.rules file Snort provides on their website. We use the “micros” flag to output timestamps with microsecond precision, as Snort does bydefault (see Appendix A for more information).Fig. 1gen alerts.py outputting 10 generated alertsApproved for public release; distribution unlimited.3
To better understand Snort alerts, we ran Snort in IDS mode and observed howSnort rules files were written and processed by Snort to create alerts. For thissystem, we used an Ubuntu 12.04 virtual machine (VM). After performing sometests in our environment, one being an ICMP rule that we could trigger by sendingoutbound pings, we found that metadata in the rule are used to craft the “fast”formatted alerts. The Snort alert is crafted from both the network traffic andmetadata from the rule.In the following passage, we provide an example of a rule seen in the Snort rulesfile community.rules1, the associated alert generated by gen alerts.py,and the fields used in crafting the alert:RULE:alert tcp EXTERNAL NET any - HOME NET 53(msg:"PROTOCOL-DNS dns zone transfer via TCPdetected"; flow:to server,established; content:" 00 0100 00 00 00 00 "; depth:8; offset:6;byte test:1,!&,0xF8,4; content:" 00 00 FC 00 01 ";fast pattern; isdataat:!1,relative; metadata:rulesetcommunity, service dns; reference:cve,1999-0532;reference:nessus,10595; classtype:attempted-recon;sid:255; rev:23;)ALERT:2016/06/17-05:34:08.382267 [**] [1:255:23] "PROTOCOLDNS dns zone transfer via TCP detected" [**][Classification: attempted-recon] [Priority: 2] {tcp}83.8.50.58:54630 - 172.24.136.71:53ALERT FIELDS:timestamp [**] [gid:sid:rev] “msg” [**][Classification: classtype] [Priority: priority]{protocol} sip:sport - dip:dportThe program is written in Python for its rapid development and data parsingcapabilities. To take in command-line arguments from the end user, we leveragethe argparse module. First, we create the “-i” flag to read in a Snort rules file.Next, we parse the rules file line-by-line, then split the line to differentiate theheader section from the rest, which we dub the “options” section. The fields withinApproved for public release; distribution unlimited.4
these sections are shown in Table 2. Many more fields are provided in the rule inthe options section, such as the flow, content, and reference fields, but these are notused to generate the fast formatted alert.Table 2The header and options sections of a Snort rule used in the crafting of aSnort alertHeaderprotocolsource IPsource portdestination IPdestination portOptionsmsgclasstypeprioritygidsidrevWithin the header section of the rule, we see the client/server IPs and ports, whichcan be specified in multiple ways. Both the IPs and ports can be set in the Snortrules file or configuration file using a list variable such as “HOME NET” and“SSH PORTS”. They can also be provided as exact values, such as “146.186.33.5”and “335”. Lists can also be provided within the fields, making the followingpossible: “[1.1.1.1, 2.2.2.2, 3.3.3.3, 4.4.4.4]” and “[111, 222, 333, 444]”. Inaddition, shorthand enumeration can be used such as with classless inter-domainrouting (CIDR)-addressed IPs, “1.1.1.0/24”, and port ranges, “326:335”.Furthermore, these can be used in combination provided within lists, and “!” canbe added to represent the Boolean “NOT”. All of these cases are handled in theparsing of the fields in gen alerts.py. Since our program only takes in theSnort rules file, we assume that any variable declarations will be set there insteadof a configuration file.In terms of fields used in the alert, the options section of the rule usually providesthe msg (message), classtype (classification), sid (signature ID), and rev (revisionID). According to the Snort manual,3 the gid is the Generator ID, the sid is theSnort/Signature ID, and the rev is the revision ID. The gid provides the componentof Snort that generated the alert and defaults to “1” since it is not commonly set.The sid is used as a signature ID, and the rev is the number of revisions that havebeen made to the rule. For more specific information, please see the 3.4.3 gidsection of the Snort manual.3 By default, Snort derives the priority from theclassification field, but this can be overwritten by providing the priority field in theoptions section or by defining it in the Snort rules file or configuration file. Forexample:‘config classification:Network Scan,1’.network-scan,DetectionApproved for public release; distribution unlimited.5ofa
By default, “network-scan” is priority 3 (i.e., low priority). Here, the user setnetwork scan to 1, meaning high priority, to reflect the importance of thisclassification in their system.By default, we preset all of the variable lists to Snort’s default variable definitions.Users can define Server lists and Port lists using the keywords “var” , “ipvar”,or “portvar”, where “var” is universal. For example, “var HOME NET192.168.1.0/24” and “var HTTP PORTS 80,8080,8000”, whichcould also be defined with “ipvar HOME NET 192.168.1.0/24” and“portvar HTTP PORTS 80,8080,8000”. Since Snort does not define theHOME NET, if it is not set in the rules or configuration file, we define it as anyprivate IP address (which in turn means EXTERNAL NET is anything but privateIPs). Snort also has over 50 ports listed in their HTTP PORTS list, including butnot limited to “80”, “81”, “311”, “8000”, “8008”, “8080”, and “8088”.3 Whileparsing the .rules file in gen alerts.py, we also check for anyuser-defined changes to the default lists, and we override the preset lists.In order to generate N realistic alerts when given a .rules file with only a smallfraction of N rules, we find and enumerate mutable fields and introducerandomness. Generated alerts would be unrealistic if they repeated connectioninformation and timestamps, thus this variability and randomness are necessary. Inaddition, to enforce the generation of realistic alerts, we cannot just randomly grabpieces from several alerts to generate new ones because this could result in illogicalalerts. For example, a generated alert with “udp” for its protocol field combinedwith a message field clearly matching a TCP rule would not make sense. Thus, weneeded to determine which fields must be grouped together to form a logical,realistic alert.The combination of the gid/sid/rev fields uniquely describes the rule and is linkedto the message, classification, priority, protocol, IPs, and ports fields. Unlike theprevious fields, the timestamp is not linked to other fields and can be randomizedto the extent desired by the end user. By default, we use a 2-h span with an end timeof now and start time of 2 h before now. Since we are precise to the microsecond,we have already greatly reduced the chance of repeating alerts, even if we onlyprovided a few rules. The sip, sport, dip, and dport fields can also be randomizedwithin the boundaries of the rule definition. Fields can be variables, such as“HTTP PORTS” or “AIM SERVERS”, defined as lists of possible values. Thisallows us to choose a random value from the list for the field. At other times, actuallists are provided in the rule, or CIDR-addressed IP addresses, or port ranges. Allof these resolve to a list of IPs and ports to choose from randomly, and we stillgenerate a realistic alert by adhering to the rule’s original IP/port definitions.Approved for public release; distribution unlimited.6
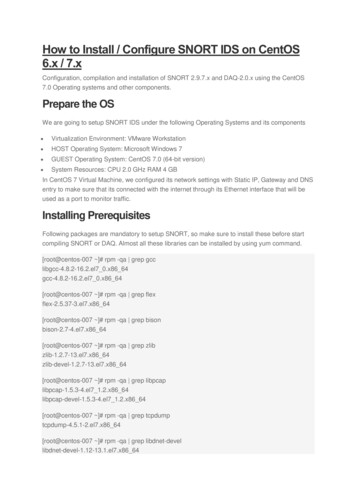
Fig. 2gen alerts.py usage outputted with “-help” flagOur program first parses the entire Snort rules file provided, creating/updating anyvalues defined that overwrite Snort’s defaults, and stores the nonmutable fields ofeach parsed rule together as one item in a dictionary indexed by the priority level.It then loops a number of times for each priority, based on N, the number of alertsto be generated, and the chosen priority distribution that specifies the percentage ofN that is high, medium, and so on. Next, it grabs a random rule at that priority leveland generates an alert filled with the rule’s metadata and random values that meetthe rule’s parameters. For example, we may see “HTTP PORTS” or “any”provided as the source port, so we resolve this to the list of ports it entails and selectone of these ports at random. Each alert is stored as it is crafted, and after N alertshave been created, it sorts them by timestamp and outputs them to stdout or aApproved for public release; distribution unlimited.7
specified output file. Several helper-functions are used to handle repeated tasksthroughout the parsing and random parameter generation sections, including“Parse var”, “Gen IP”, and “Gen Port”.After implementing the aforementioned parsing techniques and developingfunctions to handle repeated tasks, we focused more on the usability and the flagsavailable when calling the program. These are detailed in Fig. 2 and can beoutputted using “python gen alerts.py –help”, assuming Python isinstalled and the user is in the current directory. See Appendix A for moreinformation on using gen alerts.py.2.2 The SELK StackHaving a program that can generate Snort alerts will provide great test data foranyone working with Snort, or a system that ingests Snort alerts, but at this pointwe only have raw text. We wanted a way to investigate and monitor real Snortalerts. We decided to use Elasticsearch as the back-end to store the Snort alerts, andKibana as the front-end to visualize them. Elasticsearch stores data in an efficientway and enables fast retrieval through querying by creating “nodes” and “indices,”and splitting up the data intelligently. Kibana provides an easy-to-use graphicalinterface for performing these queries, and creating graphs and charts to view andmonitor the data as they are stored. Adding in Logstash, the additional tool thatingests, filters, and forwards data to Elasticsearch, as well as the gen alerts.pyprogram for generating Snort alerts, we now form the SELK stack and create a fullsystem for generating, filtering, storing, visualizing, and monitoring our data.2 Thispipeline can be seen in Fig. 3 and begins with either Snort firing rules andgenerating alerts or gen alerts.py generating fake alerts, and it ends withKibana visualizations and monitoring of these alerts. This system will mostlybenefit end users who are hoping to store, visualize, and investigate their Snortalerts in depth, but it can also make Snort data testing much more involved. Inaddition, the SELK stack and the methodology used to create it can be seen as agreat example of how to set up a similar system with any data of your choosing.Going into this part of the project, we developed a system in which end users couldfind trends in their Snort data. Perhaps a specific type of malware or malware ingeneral was on the rise, or maybe they would be able to classify patterns of attacksand use these to decrease the attack surface on their front and thwart future attacks.Approved for public release; distribution unlimited.8
Fig. 3The SELK stack pipelineAs discussed earlier, Elasticsearch, Logstash, and Kibana are all tools provided bythe company Elastic, and thus work well together out of the box. Getting this stackup and running with their default settings is not too difficult, but the setup gets morecomplex when trying to customize settings such as altering Elasticsearch’s storagemethods or Kibana’s custom index patterns. Logstash required the most work sincewe needed to instruct the system on how to parse and filter our Snort alerts. Onetutorial we found useful for learning about the ELK stack and its configuration wasby DigitalOcean.4The Logstash configuration file (snort-alert.conf in our case) is used toinstruct Logstash on where it is ingesting data from, how it is filtering/parsing data,and where to send them to. We ingest data from the file/var/log/snort/alert since it is the default location for Snort to storealerts. We use Grok patterns to filter Snort alerts and map/typecast fields in the alertto variables we will store them as in Elasticsearch. Grok filtering is the best methodfor Logstash to parse arbitrary text and structure it so that it is easily queryable.This requires writing Grok patterns to match the exact log format and providingvariable names to the data parsed and typecast information to overwrite the defaultstorage of the field as a string. Logstash provides approximately 120 Grok patterns,so there is a good chance the logs’ patterns may have already been established, butin our case we needed to develop our own. For more specific information on writingcustom Grok patterns, see the Grok guide provided by Elastic.5 To test custom Grokpatterns and simplify debugging, we recommend using an online interpreter suchas the “Grok Debugger”.6Once our Grok patterns were created and we instructed Logstash to output our datato Elasticsearch, as well as stdout to view the stream of logs as they are processed,Approved for public release; distribution unlimited.9
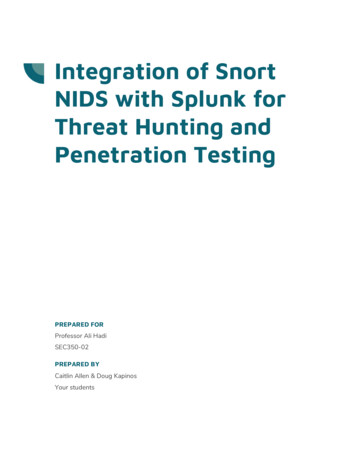
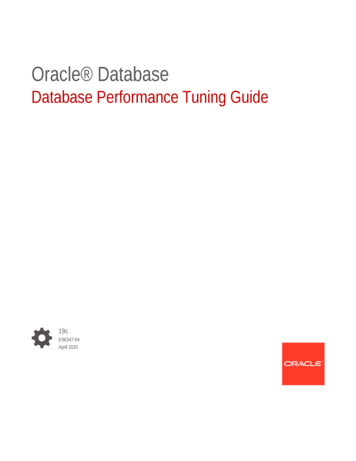
we were able to get the SELK pipeline up and running. As shown in Fig. 3, theSELK stack was built to work alongside Snort and can ingest data directly fromSnort’s alert output, or, in our case, it can be tested with gen alerts.py andingest its outputted alerts. The alerts are ingested, filtered/mapped, and outputtedby Logstash to Elasticsearch. Elasticsearch stores and indexes the data, and thenKibana reads the data in Elasticsearch and displays them in a user-friendlygraphical interface. In Kibana, the “Discover” tab can be used to query data anddisplay them by fields in the alert or in raw JSON. Visualizations of the data can becreated, including pie charts, bar graphs, tables, Geo-coordinate maps, and more.To create Geo-coordinate maps, GeoIP databases can be leveraged, which enablethe translation of IP addresses to coordinates. We found a DigitalOcean tutorial tobe helpful in enabling this feature.7 After creating visualizations, one can useKibana’s “Dashboard” feature to view several of them at once. This provides a greatway to quickly view data and monitor them.An example of several Kibana visualizations and a dashboard we created with Snortalert data can be seen in Fig. 4. This dashboard is saved as “Default2” and can beimportedintoKibanathroughoursettingsfiledek kibana viz setup Aug-16.json by following instructions inAppendix C. In the upper left corner, we have a pie chart embedded in another piechart, where the inner chart shows the Snort alert priority levels (1–4) seen and theouter chart shows the classifications seen. To the right of this, we see a line graphdisplaying the log timestamps over time to view trends in the amount of alerts seen,and to the right of that we see a world map showing malware traffic. In this case,we are mapping coordinates based on the locations of the source IPs seen withinalerts containing malware keywords. On the bottom left, we have a table displayingthe top 10 destination ports seen in alerts, along with the protocol and classificationseen in alerts with those ports. Moving to the right again, we can see the countriesof destination IPs binned by month. Finally, in the bottom right corner, we seeanother set of embedded pie charts, but now they are showing the protocols seenwith the classifications.This enables us to quickly see trends in data, such as the fact that most alerts withpriority 1 (high) are related to a “default-login-attempt,” or that a few days after“2016-06-11,” the number of Snort alerts we saw jumped up drastically (Fig. 4).We also note that the United States accounts for most of the malware traffic alertsseen in our dataset, specifically from the Kansas/Montana area.Approved for public release; distribution unlimited.10
Fig. 43.“Default2” Dashboard we created and provide: dek kibana viz setup Aug16.jsonDiscussion and ConclusionThroughout these projects, we faced multiple challenges such as 1) the constantdiscovery of edge cases and customizations in Snort .rules files to handle whenparsing Snort rules and 2) the ELK stack causing our system to run out of filedescriptors and errors saying the Java language was out of memory/heap space.When first setting up the ELK stack, it appeared that our Logstash Grok patternswere working when they actually were not. This resulted in a lot of confusion andthe inability to create Kibana index patterns indexed by the log timestamp. Bydefault, Kibana index patterns are indexed on the “@timestamp” field, whichdenotes the time the log was actually stored in Elasticsearch. For a system runningSnort in real time and immediately storing alerts in Elasticsearch, this would notmake a noticeable difference, but when a system only submits logs on a setschedule, or when older logs are input along with newer ones, this results in falsedata.These limitations led us to storing the logs in Elasticsearch based on the logtimestamp, but this led to even more issues because by default Logstash creates anindex for each day. This resulted in hundreds of Elasticsearch indices for only afew hundred random logs over the past year and caused the system to hang, Kibanato time out, and more Elasticsearch errors to occur. The solution to all of this wasto index on the log timestamp but continue to store the logs in Elasticsearch basedApproved for public release; distribution unlimited.11
on the day they were submitted. Now, instead of hundreds of indices per day, weonly have one, resulting in a stable, easy-to-use system.In order to promote and accelerate Army research involving the use of Snort andthe ELK stack for parsing, storing, analyzing, and visualizing Snort alerts or anydata, we have provided a lightweight Lubuntu Virtual Machine in .ova format.This VM has the SELK stack setup and is ready to go along with ourgen alerts.py program. This .ova file can be imported into eitherVirtualBox or VMware with ease, and more details can be found in Appendix B.In addition, in Appendix C, we have provided a guide for setting up the SELK stackin one’s own environment. The methodology described can also be used to set upan ELK stack with any data.The SELK system provides end users with a system for parsing, storing, analyzing,and visualizing Snort alerts, but the methodology can be applied to any data. Thebenefits of these projects and a system such as this are clear. We can now generateartificial Snort alerts without ever running Snort. This benefits any researchinvolving Snort data, and it allows for detailed, realistic datasets. In
and uses. We develop the program, gen_alerts.py, which takes in a Snort rules file and generates artificial Snort alerts with a specified priority distribution for outputting high, medium, low, and very low alerts based on Snort's classifications. We construct the ELK pipeline, using Logstash to parse and organize Snort alerts.