Transcription
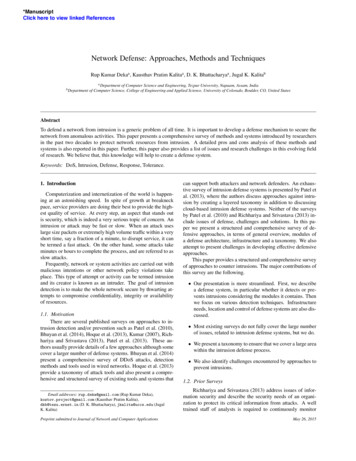
Machine Learning for Network Intrusion DetectionLuke HsiaoStephen IbanezStanford Universitylwhsiao@stanford.eduStanford Universitysibanez@stanford.eduABSTRACTComputer networks have become an increasingly valuabletarget of malicious attacks due to the increased amount ofvaluable user data they contain. In response, network intrusion detection systems (NIDSs) have been developed to detectsuspicious network activity. We present a study of unsupervised machine learning-based approaches for NIDS and showthat a non-stationary model can achieve over 35 higherquality than a simple stationary model for a NIDS which actsas a sniffer in a network. We reproduce the results of packetheader-based anomaly detection for detecting potential attacks in network traffic and are able to detect 62 of 201 attackswith a total of 86 false positives (an average of under 9 perday) on the 1999 DARPA dataset. Our implementation is opensource, available at s the world becomes more and more connected through theInternet, computer networks have become an increasinglyvaluable target of malicious attacks. Large corporate networks are of particular value to attackers due to the sensitiveinformation that they carry such as private user informationor internal business data. One of the tools used to addressnetwork attacks are NIDS, which seek to monitor networktraffic and detect suspicious activity or other policy violations. A NIDS typically utilizes either (1) signature detectionmethods such as SNORT [7], or BlindBox [9], or (2) machinelearning based techniques such as clustering [8], neural networks [3, 12], or statistical modeling [6, 11]. Learning-basedapproaches are of particular interest because they have thepotential to detect novel attacks unlike signature based systems which would need to be updated.One challenge involved with building a NIDS is that theyoften would like to examine encrypted application-levelpacket data in an attempt to detect more attacks. This oftenmeans that the NIDS must intercept secure connections bypositioning as a man-in-the-middle, or in the case of BlindBox, employ new protocols to inspect the encrypted payloadwithout sacrificing the end user’s privacy. There are a number drawbacks to these techniques which could be avoided ifthe NIDS did not need to examine encrypted packet data. Asa result, we explore machine learning techniques for buildingan NIDS that only use unencrypted packet header fields.Local NetworkRouterSnifferFigure 1: Our dataset consists of packets collected bya sniffer between a network and an Internet router.2METHODA common approach to using machine learning for NIDS isto frame the problem as an unsupervised anomaly detectiontask, where we desire to train a model to recognize normal,attack-free traffic and consequently recognize anomalous,potentially malicious traffic. We implement two methods foranomaly detection: (1) a stationary model using a mixture ofGaussians, which does not incorporate time as a parameter,and (2) a non-stationary model based on the Packet HeaderAnomaly Detection (PHAD) paper [5]. We use 33 fields foundin packet headers as features, as opposed to other systemswhich perform anomaly detection by using the bytes of thepayload [11]. In addition, our non-stationary model prioritizes the time since an event last occurred rather than thefrequency of the occurrence.We then train and test our models on the widely usedDARPA 1999 IDS dataset1 [4], which is still considered auseful dataset for evaluating this task despite its age [10] andconsists of 5 weeks of tcpdump data collected by a snifferpositioned between a local network and an Internet routeras shown in Figure 1. The test data in the DARPA datasetcontains 201 instances of 56 types of attacks.2.1Stationary Model: Mixture of GaussiansWe first establish a baseline for the quality of a stationarymodel that does not consider time as a parameter and insteadonly looks at a packet’s features in isolation. Specifically, wemodel the data as a mixture of Gaussians. During training, wetrain a Gaussian mixture model using sklearn2 . We empirically selected to model the data with 16 components using1 https://ll.mit.edu/ideval/data/1999data.html2 klearn.mixture.GaussianMixture
to 232 values. In the original paper, the authors ultimately select a cluster-based approach for detecting anomalies. Ratherthan store a set of potentially millions of entries for eachfield, the original PHAD implementation instead stores alist of clusters (represented as a number interval) up to alimit defined as C, where PHAD-C32 uses C 32. Whenthe number of clusters exceeds C, the clusters whose rangesare closest together are combined into a single cluster. Thisimplementation is summarized in Algorithm 1. Clusters arecreated during training, where each field has a set of C clusters and are used to estimate r , which is incremented eachtime a cluster is added, and used to determine whether a fieldvalue is anomalous or not based on whether it’s value fallswithin any of the clusters learned from the training data. Inorder to best recreate the original results, we implement thissame clustering structure using Python.full covariance matrices to keep training time manageable onconsumer hardware. We found no significant differences infinal quality when varying the number of Gaussians. Modelparameters are initialized by first running the kmeans clustering algorithm on the data.While a mixture of Gaussians is typically used to label databased on which Gaussian is the most probable, we insteadlook at how unlikely a particular packet’s features are giventhe model trained on attack free data. During detection, eachpacket is assigned 16 probabilities P [p1 , . . . , p16 ]. We thenscore a packet as (1 max P). Packets with a low probabilityof coming from any of the Gaussians have the highest scores.2.2Non-stationary Model: PHADNext, we implement the PHAD learning model which isbased on computing an anomaly score for each field of apacket header. During training, we learn an estimate of therate of anomalies for each field. If a particular packet fieldis observed n times and consists of r distinct values, thenwe approximate the probability that the next observation isanomalous by r /n. Note n is not necessarily the same as thetotal number of packets seen, since the packet fields that arepresent depend on the type of the packet. The PHAD modelassumes that anomalous events occur in bursts since theyare often caused by a change of network state (e.g. a changein software or configuration). During training, only the firstanomalous event in a burst is added to r .During detection, PHAD uses time as parameter to accountfor the dynamic behavior of real traffic and to help discountthe weight of anomalous packets after the first packet ina burst. Specifically, they define a factor t for each field asthe time since the previous anomaly in that particular field.Thus, if a packet occurred t seconds ago, PHAD approximatesthe probability that it will occur in the next second as 1/t.PHAD looks at a stream of packets sequentially, and producesa score for each field that is inversely proportional to theprobability of an anomaly in that field:t nscorefield (1)rRather than assuming that each field is independent (andthus taking the product of each of the field’s probabilitiesas a packet score), PHAD approximates fields as occurringsequentially, and scores a packet as the probability of observing consecutive anomalies. Packets scores are the sum of thescores of its anomalous fields.Õti niscorepacket (2)rii anomalous fieldsAlgorithm 1 PHAD Clustering algorithm1: C 322: clust er s 3: procedure AddValue(a)4:for clust er clust er s do5:if a clust er then6:return7:clust er s clust er s [a, a]8:if l en(clust er s) C then9:merge two nearest clusters10:return in the case of PHAD-C32 adding a to the clusters a is non-anomalous add new cluster2.2.2 Post-processing In order to correctly identify anattack, the model must indicate the destination IP address,the date, and the time of the attack to within one minute ofaccuracy. After providing a list of anomalies that the modelclassifies as attacks, we perform a post processing step thatremoves duplicate detections of the same attack. We keeponly the highest scoring detection for each attack.3EXPERIMENTSAs our core experiment, we evaluate the quality of our NIDSimplementation based on two primary metrics: (1) recall,the percentage of attacks which we are able to identify inthe dataset and (2) precision, the percentage of packets weclassify as attacks that are true instances of attacks. Thesetwo metrics provide an assessment of how effective our NIDSis at detecting attacks, and how practical such a NIDS systemwould be based on its precision. For this application, a verylow rate of false positives is essential, due to the limitedamount of time that analysts would have to respond to thesein a real-world situation. We use F1 score (the harmonicmean of precision and recall) as a unifying metric for theprecision and recall of a system.2.2.1 Implementing PHAD-C32 A core implementationchallenge of the PHAD model proposed above is detectingwhether or not a packet header is anomalous. In particular,packet header fields can range from 1 to 4 bytes, allowing up2
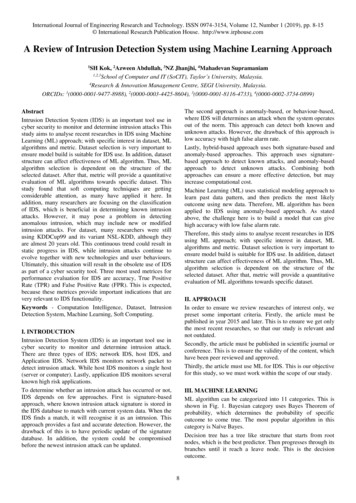
Table 1: Comparing results of our stationary andnon-stationary models with a leading system in theDARPA off-line evaluation [4].Table 2: Our PHAD model vs. original after training.Our StationaryOriginal PHADDARPA Expert 1††3.12/7262/14872/17285/185RecallF1Ethernet Dest HiEthernet Dest LoEthernet SizeEthernet Src HiEthernet Src LoEthernet TypeICMP ChksumICMP CodeICMP TypeIPv4 ChksumIPv4 DestIPv4 IDIPv4 Header LenIPv4 LengthIPv4 OffsetIPv4 ProtocolIPv4 SrcIPv4 TOSIPv4 TTLTCP AckNoTCP ChksumTCP Header LenTCP Dest PortTCP FlagsTCP OptionsTCP SeqNoTCP Src PortTCP UrgPtrTCP WindowUDP ChksumUDP Dest PortUDP LengthUDP Src Port2/201 0.014762/201 0.360072/201 0.386185/201 0.4404This system was an offline system.Experimental SettingsWe use the same 1999 DARPA Intrusion Detection Dataset asthe original paper. These files are organized by day for eachweek of the data. Evaluation labels were provided via a handformatted text file, which required us to create additionalparsing scripts in order to programmatically evaluate ourresults. We train our model using the attack-free data in week3, which consists of 8 days of data (Monday through Fridaywith extra data for Monday, Tuesday, and Wednesday). Wethen test our implementation on weeks 4 and 5 of the testdata, which spans 9 days (Monday through Friday of bothweeks, except for Tuesday of week 4 which is not provided).The original paper displays scores a shifted log scale as0.1 log10 (scorepacket ) 0.6(3)We find this equation underspecified (see Section 3.2) andinstead display scores by using a log scale and scaling the results to fall in the interval [0, 1]. Packets can then be classifiedas an attack if their score exceeds a configurable 2091127209112720911272091127The original sets checksums to 0xFFFF before training.packet field. In Table 2, we show the results of our trainingcompared to the results published for PHAD. We find thatin our implementation, the total number of packet fieldsseen differs from the original PHAD results, regardless ofwhether or not we include the 3 days of extra training data.We suspect that the differences in r , the estimated numberof anomalies seen for each field in the training data, may bedue to differences in the implementation of the clusteringalgorithm. The order in which the values are added to thecluster can affect the final results, as clusters are merged.Experimental ResultsThe results of our experiment are summarized in Table 1. Asexpected, we find that a simple mixture of Gaussian modelis ineffective at finding anomalous packets. When examinedin isolation, attack packets are very similar to normal traffic. For example, a single packet to a common port numbermay in fact be part of a port scanning attack, but is undetectable without considering the timing of the packet withrespect to others in the stream. By implementing a nonstationary model, we see over 35 improvement in F1. Ournon-stationary model achieves comparable quality to theoriginal PHAD implementation. In addition, it performs wellwhen compared with Expert 1, a top off-line system (whichperforms detection on past traffic logs only, unlike an onlinesystems) of the original DARPA evaluation [4]. We do noticesome differences in our non-stationary model compared tothe original PHAD paper, which we discuss below.Top 20 Anomalies. The top 20 most anomalous alarmsfound by our system are shown in Table 3. We capture 15of the same alarms in our top 20 as the original paper, withminor differences in rankings. Using Equation 3, their top 20anomalies range from a score of 0.7482 to 0.5817. We find thatthis equation is insufficiently justified by the original authors.First, these scores can be affected by implementation details,such as that the value of t is initialized to when calculatingscores for each field. Second, the equation does not guaranteethat values will fall from 0 to 1 as they claim, since lowscoring packets end up with negative values. The other 5attacks present in their top 20, but are not in ours have achecksum as their most anomalous field. This difference isTraining the PHAD Model. The key objective of trainingthe non-stationary model proposed by PHAD is to learn anestimate of the probability of seeing an anomaly in each3
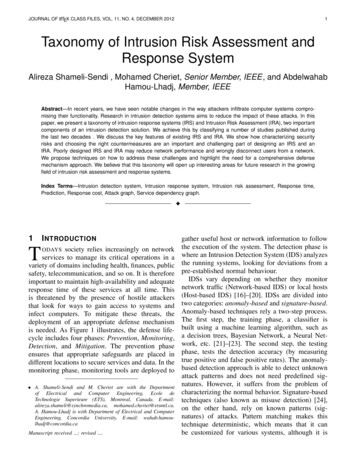
Table 3: Top 20 scoring alarms on the test data along with their ranking in the original 11:18:4509:05:0708:01:26Dest. 6.118.200.0.0.0172.16.113.50Det.AttackMost Anomalous Field (% of Pv4 offset (99%)TCP dataOffset (98%)IPv4 offset (99%)IPv4 ihl (100%)IPv4 offset (99%)TCP urgPtr (99%)TCP urgPtr (99%)IPv4 ihl (100%)Ethernet srcHi (59%)IPv4 tos (99%)Ethernet srcHi (59%)TCP dataOffset (91%)IPv4 offset (99%)IPv4 offset (99%)Ethernet dstHi (57%)TCP urgPtr (99%)Ethernet srcHi (59%)Ethernet dstHi (57%)Ethernet srcHi (59%)TCP dataOffset oison)1.00.6F1 ScoreRecall0.80.40.2020406080100Num False Positives120140Figure 2: Recall vs. total false positives when varyingclassification threshold values.0.400.350.300.250.200.150.100.050.00Ablated Featurelikely caused by the fact that the original authors essentiallyignore the checksum values during training by setting thefield to 0xFFFF, as shown in Table 2.Figure 3: For each feature on the x-axis, we removethat feature alone and report the resulting F1.Threshold Tuning. In Figure 2 we show the affect of varying the classification threshold on recall (the percentage ofattacks detected) and the total number of false alarms. TheDARPA goal of having less than 100 false alarms total isshown in red. The original authors present their results bylimiting their false positives per day, which would be similarto tuning a separate threshold for each particular day. Weopted for a single threshold to better mimic what a real system examining real-time traffic might do, where we cannotselect a threshold after-the-fact to meet a specific rate of falsepositives, but instead want to flag anomalies in real-time.3.381271134141516101819520-IPv4 ttlIPv4 srcIPv4 lengthIPv4 chksumNoneUDP dportUDP sportTCP chksumTCP windowTCP ackNoTCP seqNoTCP dportTCP sportICMP chksumICMP codeICMP typeUDP chksumIPv4 protoEthernet sizeIPv4 idEthernet srcHiEthernet srcLowEthernet typeTCP flagsIPv4 dstIPv4 offsetUDP lengthEthernet dstLowEthernet dstHiTCP dataOffsetIPv4 tosTCP optionsTCP urgPtrIPv4 ihl0.0Orig. Ranklength), contain signals that are either of little impact orare redundant, and thus do not affect the F1 significantlywhen removed. However, removing the IPv4 ttl feature(the time-to-live value) significantly hurts the F1.Running our non-stationary model with only the IPv4 ttl,we achieve an F1 score of 0.38 with a lower recall of 0.26 buta much higher precision of 0.68. During training, we onlysee 10 distinct values for the TTL field: 2, 32, 60, 62-64, 127,128, 254, and 255. However, we see that attack packets have adifferent TTL values than the attack-free training data suchas 43 and 253, despite the specific value of the TTL fieldbeing unrelated to the attack itself. We suspect that this islikely an unintentional artifact of the simulated data, whichis well known to be a difficult task [2], and represents oneof the shortcomings of the 1999 DARPA dataset. As futurework, we may be able to address these simulation artifactsby mixing in real-world traffic into the training data.Feature Ablation StudyIn this study, we remove a single feature of the 33 used byour non-stationary model and evaluate the final F1 achievedusing the remaining 32 features. The results are shown inFigure 3, where the baseline setting of all 33 features enabledis shown in red. Most fields, such as IPv4 ihl (the IP header4
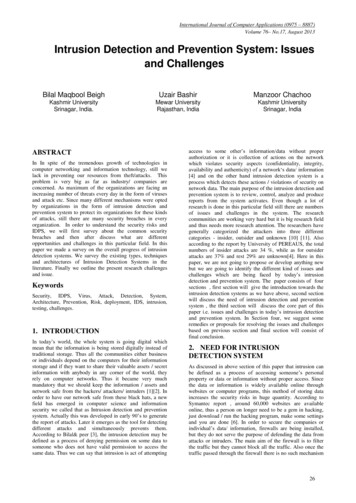
1.0 service: network service running on the destination host logged in: if the connection successfully logged in src bytes: the number of data bytes transferred from thesource to the destination dst host count: the number of connections to the samehost as the current connection during the last two seconds srv count: the number of connections to the same serviceas the current connection during the last two seconds protocol type: the type of transport layer protocol beingused for the connection dst host same src port rate: the percentage of connections to the same host with the same port number onthe source host during the past two secondsThe service, protocol type, and srv count featureswork well due to the unique characteristics of the KDDdataset and consequently do not generalize well to otherdatasets such as the DARPA dataset. The logged in feature would be unavailable to our NIDS because it would require examining packet payloads or server log files. However,the remaining 3 features (src bytes, dst host count, anddst host same src port rate) can in fact be computedby our NIDS by keeping a small amount of state per connection. As future work, we would like to build a NIDS thatcomputes these three features and attempt to use them tohelp identify attacks in network traffic.F1 Score0.80.60.40.2num outbound cmdsis host loginnum access filessu attemptedroot shellnum shellsnum file creationslandurgentnum rootdurationwrong fragmentsrv diff host ratedst host srv diff host rateis guest loginnum failed loginsnum compromiseddst byteshotsrv serror ratedst host srv serror ratedst host serror rateserror ratesrv rerror ratedst host srv rerror ratererror ratedst host rerror ratedst host diff srv ratediff srv ratesame srv rateflagdst host same srv ratedst host same src port rateprotocol typesrv countdst host countsrc byteslogged inservice0.0Feature UsedFigure 4: For each feature on the x-axis, we use thatfeature alone and report the resulting F1.3.4Evaluating Additional FeaturesThus far, the best quality we have been able to achieve on the1999 DARPA dataset is an F1 score of 0.36. While promising,this is lower than our desired level of quality. This suggeststhat only using unencrypted packet header fields as featuresmay not enough to achieve high F1. In this section, we describe some preliminary results in our search for additionalfeatures to use. We are looking for features that can be exploited by an online NIDS that only examines unencryptedpacket header fields. We find some promising candidate features that can derived by extending the NIDS to store a smallamount of state per connection.To facilitate our search for additional features, we examinethe dataset provided in the 1999 Knowledge Discovery andData Mining Tools Competition, which we refer to as theKDD dataset [1]. The KDD dataset was derived from a setof log files and tcpdump traces which are very similar to theones provided in the 1999 DARPA dataset. These log files andtcpdump traces have been processed into connection entriesand domain specific knowledge was used to construct a setof 39 different features per connection.We find that if we use all 39 features and build a simple one-nearest-neighbor classifier then we achieve an F1score of 0.95. This result indicates that these features makeit relatively easy to distinguish between normal and attackconnections on this dataset. The obvious questions we wouldlike to ask are: which features are most useful? And, can weuse any of the useful features in an online NIDS that onlyexamines unencrypted header fields?In order to answer these questions, we perform an ablationstudy where we use each feature individually and run ourone-nearest-neighbor classifier; ties are broken by a majorityvote. Figure 4 shows the results of this experiment. We seethat there are 7 features, which, when used alone, result inan F1 score of about 0.80 or higher:4CONCLUSIONWhen building an NIDS, it is very important to consider thetiming of packets. This importance is reflected in the significantly superior quality of the non-stationary model over thestationary model. In addition to examining time, using rawunencrypted header fields is not enough. In order to achievehigher levels of quality we must use additional features, someof which can be derived by extending the NIDS to store asmall amount of state per connection. Building an NIDS isa difficult task due to challenges in collecting data to usefor training and testing. Labeling real world data requiresa significant amount of time and expertise, and simulationdata often does not model the real world accurately. For example, in both of the datasets that we examined we foundartifacts that made classification easier than it likely wouldbe in the real world. Hence, it is often a good idea to performan ablative analysis experiment to see which features aremost useful and sanity check that these results make senseby cross referencing with other datasets. It is also difficult tocreate standard datasets because network traffic is alwaysevolving, and in the real world, it is difficult to capture realnetwork traffic that is truly attack-free, making it challengingto distinguish between normal and anomalous traffic.5
5CONTRIBUTIONS[4] R. Lippmann, J. W. Haines, D. J. Fried, J. Korba, and K. Das. The1999 darpa off-line intrusion detection evaluation. Computer networks,34(4):579–595, 2000.[5] M. V. Mahoney and P. K. Chan. Phad: Packet header anomaly detectionfor identifying hostile network traffic. Technical report, 2001.[6] M. V. Mahoney and P. K. Chan. Learning nonstationary models ofnormal network traffic for detecting novel attacks. In Proceedings of theeighth ACM SIGKDD international conference on Knowledge discoveryand data mining, pages 376–385. ACM, 2002.[7] M. Roesch et al. Snort: Lightweight intrusion detection for networks.In Lisa, volume 99, pages 229–238, 1999.[8] K. Sequeira and M. Zaki. Admit: anomaly-based data mining forintrusions. In Proceedings of the eighth ACM SIGKDD internationalconference on Knowledge discovery and data mining, pages 386–395.ACM, 2002.[9] J. Sherry, C. Lan, R. A. Popa, and S. Ratnasamy. Blindbox: Deep packetinspection over encrypted traffic. In ACM SIGCOMM Computer Communication Review, volume 45, pages 213–226. ACM, 2015.[10] C. Thomas, V. Sharma, and N. Balakrishnan. Usefulness of darpadataset for intrusion detection system evaluation. The InternationalSociety for Optical Engineering, 2008.[11] K. Wang and S. J. Stolfo. Anomalous payload-based network intrusiondetection. In RAID, volume 4, pages 203–222. Springer, 2004.[12] Z. Zhang, J. Li, C. Manikopoulos, J. Jorgenson, and J. Ucles. Hide: ahierarchical network intrusion detection system using statistical preprocessing and neural network classification. In Proc. IEEE Workshopon Information Assurance and Security, pages 85–90, 2001.We have worked together closely on the project. Stephenled the implementation of our evaluation scripts, as well asprocessing both our training and testing data. In addition,he led experiments with the KDD dataset and the additionalfeatures from Section 3.4. Luke has led the PHAD-C32 implementation and ablation studies with this non-stationarymodel, in addition to leading the implementation and experiments with our mixture of Gaussians baseline. Both of ushave tested and contributed to each part of the project bycoding, testing, and writing.We would also like to thank Professors Andrew Ng andDan Boneh, along with their teaching staff, for their support,advice, and feedback throughout this project.ReferencesDataset.available at the following website[1] K. up99.html, 72, 1999.[2] S. Floyd and V. Paxson. Difficulties in simulating the internet.IEEE/ACM Transactions on Networking (ToN), 9(4):392–403, 2001.[3] K. Labib and R. Vemuri. Nsom: A real-time network-based intrusiondetection system using self-organizing maps. Networks and Security,pages 1–6, 2002.6
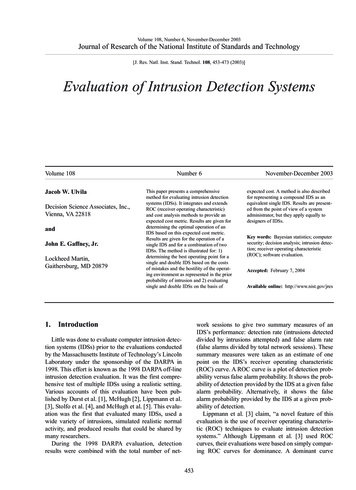
a result, we explore machine learning techniques for building an NIDS that only use unencrypted packet header fields. Local Network Router Sniffer Figure 1: Our dataset consists of packets collected by a sniffer between a network and an Internet router. 2METHOD A common approach to using machine learning for NIDS is