Transcription
Virginia State UniversityWagner CollegeWake Forest UniversityWashburn UniversityWashington University in St. LouisWellesley CollegeWesleyan UniversityWest Chester UniversityWest Liberty UniversityWest Virginia Institute of TechnologyWest Virginia School of OsteopathicMedicineWest Virginia State UniversityWest Virginia UniversityWestern Connecticut State UniversityWestern Oregon UniversityWestfield State UniversityWheaton CollegeWhitworth UniversityWidener UniversityWilliams CollegeWilliston Northampton SchoolWorcester Polytechnic InstituteWorcester State UniversityXavier UniversityYale UniversityYeshiva UniversityFY14 GHG AnalysisChamplain CollegePresented by: Jeff Murphy
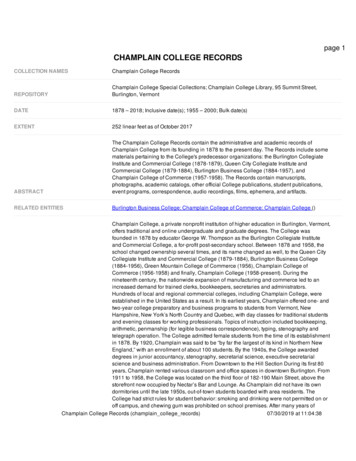
Who Partners with Sightlines?Robust membership includes colleges, universities, consortiums and state systemsSightlines advises stateSightlines is proud toannounce that: Serving the Nation’s Leading Institutions: 70% of the Top 20 Colleges* 75% of the Top 20 Universities* 33 Flagship State Universities 13 of the 14 Big 10 Institutions 9 of the 12 Ivy Plus Institutions 7 of 12 Selective Liberal Arts Colleges2450 colleges anduniversities areSightlines clientsincluding over 325ROPA members. 93% of ROPAmembers renewed in2014 We have clients in 41states, the District ofColumbia and fourCanadian provinces More than 100 newinstitutions becameSightlines since 2013systems in: AlaskaCaliforniaConnecticut ri NebraskaNew HampshireNew JerseyPennsylvaniaTexasWest Virginia
Defining Champlain’s Carbon FootprintScope 1 –Direct GHGs On-CampusStationaryCombustion (NaturalGas)Scope 2 –Upstream GHGs Purchased Electricity Vehicle Fleet Fuel RefrigerantsScope 3 –Indirect GHGs Faculty/Staff/Student Commuting Directly Financed AirTravel Study Abroad Solid Waste Paper Transmission &Distribution LossesIncreasingly Difficult to Control and/or MitigateEmissions sources are only for institutionally owned facilities and doesnot include leased space like Spinner, Quarry Hill, Sears St., etc.3
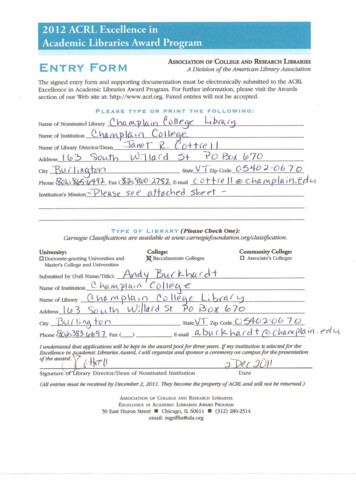
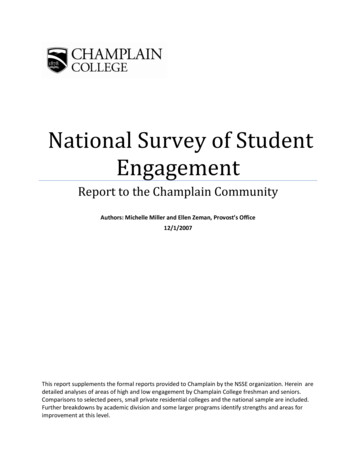
Distribution of GHGs by Scope and SourceChallenging profile given lack of direct control over most GHGs sourcesScope 1 SourcesChamplain’s FY14 Emissionsby Scope1,401-MTCDE1,000Natural ure23%Scope 2 Sources47%2,004-MTCDE 1,0002,0003,0004,0005,0004,0005,000Purchased Electricity30%Scope 3 Sources1,531Scope 1Scope 2Scope 3-MTCDE 1,000CommutingEmissions totals are only for institutionally owned facilities and do notinclude leased space like Spinner, Quarry Hill, Sears St., etc.41,4202,000Travel1243,000Paper PurchasesT&D Losses
Champlain’s GHG Inventory 2004-2014Champlain’s Gross Emissions9,0008,000Gross Emission 520062007Scope 120082009Scope 2Emissions totals are only for institutionally owned facilities and do notinclude leased space like Spinner, Quarry Hill, Sears St., etc.520102011Scope 3201220132014
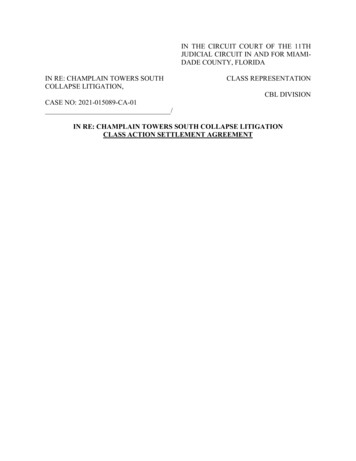
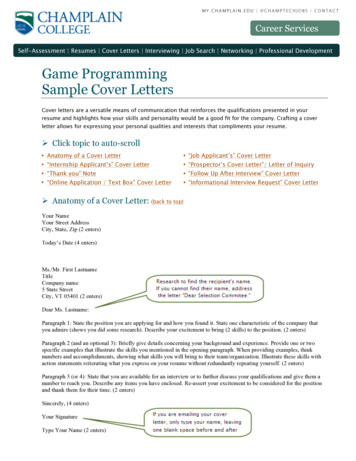
Change in GHGs Relative to Campus GrowthChamplain’s performance quite impressive in context of growthChange in Emissions vs. Change in Campus Size and PopulationIndexed to FY200450%40%% 009FY2010FY2011FY2012-10%-20%Gross EmissionsCampus GSFEmissions totals are only for institutionally owned facilities and do notinclude leased space like Spinner, Quarry Hill, Sears St., etc.6Campus PopulationFY2013FY2014
Peer institutions for ChamplainUsing the same peer group as FY2013 analysisGo-Green Peer InstitutionsBabson CollegeBentley UniversityBoston CollegeCarleton CollegeHamilton CollegeHampshire CollegeSiena CollegeUniversity of VermontWesleyan UniversityPeer Group Based On Size Technical Complexity Climate Zone7
Two ways to benchmark against peersPer student and per 1k GSF normalization show emissions differently8GHG Emissions per StudentGHG Emissions per 1,000 GSFStresses efficient use of space.Stresses intensity of operationsand commuting.Gross GHG EmissionsGross GHG EmissionsTotal Student FTETotal GSF in FootprintX 1,000
Comparing Champlain to Other InstitutionsInstitutions ordered by increasing Density Factor9
Energy Trends10
Overall Energy ConsumptionTotal energy use flat since FY06, nearly 30% less on a per GSF basisEnergy ConsumptionEnergy ConsumptionFY2004-FY2014 – BTU/GSFFY2004-FY2014 0002004 2005 2006 2007 2008 2009 2010 2011 2012 2013 2014Fossil112004 2005 2006 2007 2008 2009 2010 2011 2012 2013 2014Electric
Energy Consumption Lower Than PeersEnergy ConsumptionFacilities Peers – BTU/GSF160,000140,000120,000Peers plainFossilDEElectricFGHI
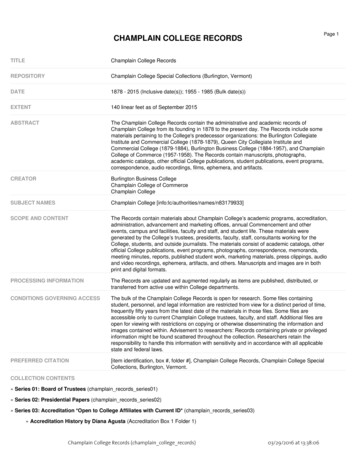
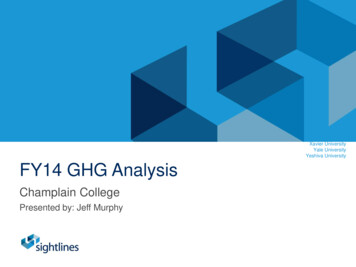
46%150Acad/Admin13Student LifeAcad/AdminFossilElectricAd-LaJuniperBader308 MapleSummitMain St.SuitesPearl396 illhammerHillLymanWhitingCarriageCushingSig Ep350HaukeMICIDXPresident'sAikenFosterSkiff AnnxPerryRowell AnnxWickCoolidgeLakesideGarden HouseWestSkiffDurickFreemanJoycePPDGBCSkiff GalKBTU/GSFEnergy Consumption by BuildingEnergy ConsumptionBy Building40039%30025020015%ResidentialStudent LifeResidential Life100500
Waste Production andDiversion Trends14
Waste Production and Diversion at ChamplainFY13 result of shift in data collection, improve quality of analysisTotal Waste Stream1,400Total Waste 0%60040%30%40020%20010%0%02004 2005 2006 2007 2008 2009 2010 2011 2012 2013 20142004 2005 2006 2007 2008 2009 2010 2011 2012 2013 2014Composting15RecyclingTrash
Waste Stream and DiversionChamplain is generating and diverting more waste than peers16
Concluding Comments17
Major Takeaways – EnergyEnergy Represents Nearly 55% of all GHG Emissions atChamplain College. Residence Halls Represent 46% of TotalEnergy UsageTotal Institutional Energy Use Has Flat Lined Since FY06Despite a 37% Growth in Campus GSFThis Highlights the Impact of Reinvestment into ExistingFacilities and a Focus on ‘Green’ Construction for New Buildings.Consumption Will Decrease Further as the Geothermal Plan isImplemented and Remaining Buildings are Renovated
Major Takeaways – Transportation and WasteTransportation, Including Daily Commuting and Study AbroadTravel Represent the Majority of Remaining EmissionsCampus Waste is Not a Significant Source of Emissions, but it’sStill Important as This is Often the Most Tangible and VisibleIndicator of Campus Sustainability EffortsChamplain College Generates More Waste Than PeerInstitutions, but is Also Diverting More of This Waste toRecycling and Compost
Questions & Discussion20
Change in GHGs Relative to Campus Growth Champlain's performance quite impressive in context of growth-20%-10% 0% 10% 20% 30% 40% 50% FY2004 FY2005 FY2006 FY2007 FY2008 FY2009 FY2010 FY2011 FY2012 FY2013 FY2014