Transcription
Sightlines LLCFY2012 Facilities MB&A PresentationNew Mexico State UniversityDate: March 21, 2013Presented by: Nate Pramuk, Forrest Ching1
Sightlines ProfileCommon vocabulary, consistent methodology, credibility through benchmarking 12 year old company based in Guilford, CT Common vocabulary and consistent methodology 92% annual retention rate More than 380 campuses Tracking 5.9 billion in operations budgets and 4.2 billion in capital projects Database includes over 1.2 billion GSF2
Peer Groups For BenchmarkingPeers selected based on campus size, complexity, ageI&G PeersIowa State UniversityKansas State UniversityOregon State UniversityTexas A&M UniversityThe University of ArizonaUniversity of Colorado – BoulderUniversity of Missouri – ColumbiaUniversity of Southern MississippiHousing Peers:Clemson University - HousingGeorge Mason University - HousingMississippi State University - HousingPrinceton University – Rental HouseThe University of Alabama – Tuscaloosa HousingNMSUI&GPeersHousingPeersUniversity of Massachusetts – Amherst HousingUniversity of Rhode Island – HousingUniversity of Southern Mississippi - Housing3
Peer Groups For BenchmarkingPeers selected based on campus size, complexity, ageComposite Campus PeersGeorge Mason UniversityNorthern Arizona UniversityThe University of Alabama - TuscaloosaThe University of MaineUniversity of Massachusetts - AmherstUniversity of New HampshireUniversity of Rhode IslandUniversity of Southern MississippiVirginia Commonwealth UniversityNMSUEntire CampusPeers4
A Vocabulary for MeasurementThe Return on Physical Assets – ROPASMThe annualinvestment neededto ensure buildingswill properlyperform and reachtheir useful life“Keep-Up Costs”The accumulatedbacklog of repairand modernizationneeds and thedefinition ofresource capacity tocorrect them.“Catch-Up Costs”The effectivenessof the facilitiesoperating budget,staffing,supervision, andenergymanagementThe measure ofservice process, themaintenancequality of space andsystems, and thecustomer’s opinionof service gEffectivenessServiceAsset Value ChangeOperations Success5
New Mexico State UniversityFacilities Measurement, Benchmarking, & AnalysisCore ObservationsCampus Profile: Significant renovations have taken thirteen years off of campus’ age More, smaller buildings on campus than comparison groups means more components and higherdaily service need.Capital Investment: Recurring capital has deferred 7.9M/year to the backlog since FY05. Inconsistent one-time fundshave not made up the gap. Composite campus remains in the “Systemic Renovation Age”, where large renovations areinevitable and the projects pick you.Operations: Budget available to OFS is lower than comparison groups, even when adjusted for regionaleconomic differences. More materials used by tradesmen, indicating more costly maintenance work Lower inspection scores than both peers and database.6
Space Profile7
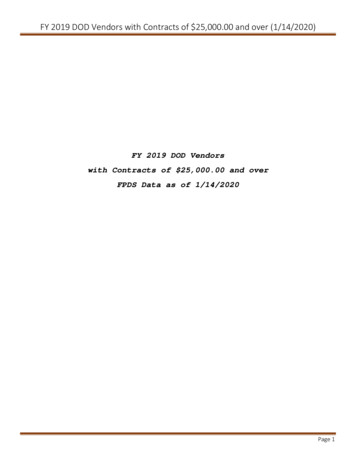
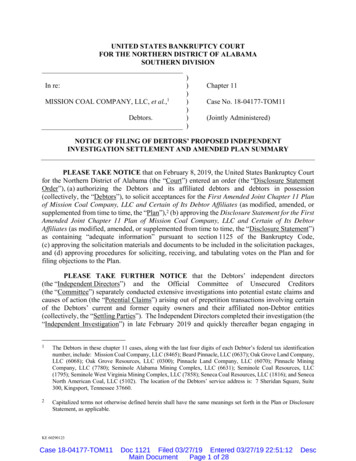
Campus Age ProfileComposite campus: 4.6M GSF50%Buildings over 50Life cycles of major building components are past due. Failuresare possible. Core modernization cycles are missed.Highest riskNMSU – CompositeConstruction vs. Renovation Age45%44%40%40%Buildings 25 to 50Life Cycles are coming due in envelope and mechanicalsystems. Functional obsolescenceprevalent.65%Higher Risk% of Total GSF35%34%30%13 years25%Taken off NMSU’s age dueto major renovations20%Buildings 10 to 25Lower cost space renewal updates andinitial signs of program pressuresMedium Risk34%15%14%10%5%14%12%8%Buildings Under 10Little work .“Honeymoon” period.Low Risk0%Less than 10 10 to 25Construction Age25 to 50Over 50Renovation Age8
Campus Age ProfileCampus is 1 year younger than peer average, 7 years younger than databaseBuildings over 50Life cycles of major building components are past due. Failuresare possible. Core modernization cycles are missed.Highest riskBuildings 25 to 50Life Cycles are coming due in envelope and mechanicalsystems. Functional obsolescenceprevalent.65%Higher RiskBuildings 10 to 25Lower cost space renewal updates andinitial signs of program pressuresMedium RiskBuildings Under 10Little work .“Honeymoon” period.Low Risk9
Campus Age ProfileCampus is 1 year younger than peer average, 7 years younger than database28.3I&G Renovation Age29.2Housing Renovation Age10
I&G and Housing vs. PeersBoth I&G and Housing have less at-risk space than respective peers% of Space by Age %20%10%35%40%40%30%19%15%13%11%I&GI&G Peers0%Under 1010 to 2535%16%Housing25 to 50Housing PeersOver 5011
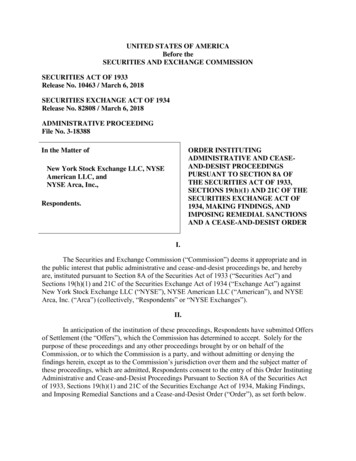
Lifecycle Cost by Age of Space9% approaching period of increased maintenance need, 4% nearing end of lifecycleAverage Life Cycle Costs by Age of Space(Renovation Age)500,000 70.004% of space willreach end oflifecycle withinfive years450,0009% of space willage into a higherrisk categorywithin five years400,000350,000 60.00 50.00300,000 /GSFGSF 40.00250,000 30.00200,000150,000 20.00100,00050,000 10.00Amortization0 0.000246Under 1014%810121416182010 to 2534%222426283032343625 to 5040%38404244Over 5012%12
Building IntensityComposite Campus Building Intensity is 147I&GHousingMore small buildings on campusgenerally means:- More components (e.g. systems,roofs) resulting in additional capitalneeds- More sites to service increasesoperational demandInstitutions ordered by density.Sutherland Village: 200 buildingsTom Fort Village: 100 buildingsEach building 712 GSF13
Tech RatingSimilar mechanical complexity makes for a strong peer groupCompositeNMSU vs. PeersTech Rating 10%0%I>ech 1I&G PeersTech 2HousingTech 3Tech 4Housing PeersTech 514
Density FactorCampus is slightly busier than peersDensity FactorNormal DistributionFY12Liberal ArtsInstitutionComprehensiveUniversityUrban / CityInstitutionHospital/Comm. CollegeNMSU Composite: 372 Users/100,000GSFPeer Density Factor: 347 Users/100,000GSFDatabase Density Factor: 433 Users/100,000GSF15
Capital Profile16
Translating TerminologyCreating a common vocabulary for categorizing different funding sourcesAnnual StewardshipAsset ReinvestmentThe annual investments to ensure thatbuildings and their components will reachor exceed their useful life.Investments to correct theaccumulated backlog of repair andmodernization needs.Operating Budget PMRecurring Capital“BRR”One-Time Capital“Bonds”17
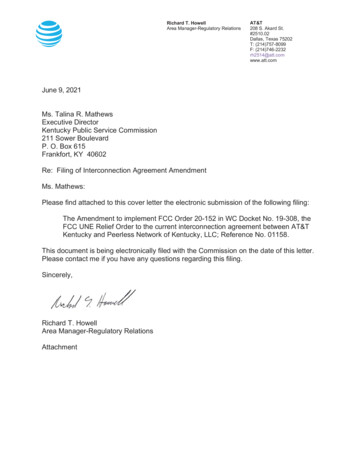
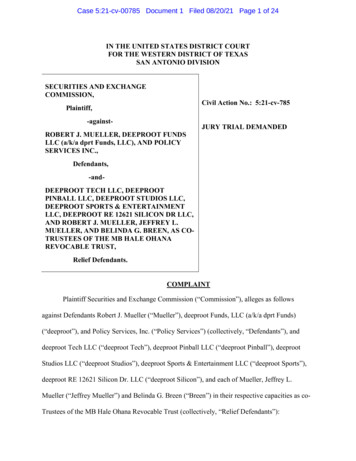
Defining a Stewardship TargetQuantifying a financial target to invest into campusFY12 Stewardship TargetsComposite Campus 40Replacement Value 1.13B 35Life Cycle need isdiscounted to accountfor programmatic shiftsand the churn of space in Millions 30 25 16.9 20 15 33.9 7.3 10 13.3 5 10.0 03% Replacement ValueLife Cycle Need(Equilibrium)Envelope/MechanicalDepreciation ModelFunctional Obsolescence(Target)Space/ProgramSightlines Recommendations18
Annual Stewardship Type by CampusQuantifying a financial target to invest into campusFY12 Stewardship TargetsI&G and Housing 35 30 in Millions 25 20 13.5 15 5.8 10 5 10.2 7.6 0 3.3 3.1 1.4 2.3Life Cycle NeedTarget NeedLife Cycle NeedTarget Need 23.7 M 13.4 M 6.4M 3.7 MI&GEnvelope/ Mechanical NeedHousingSpace/Program Need19
Target Spending by CampusAnnual stewardship funds are not meeting targets in both I&G and Housing spaceAnnual Stewardship Funding vs. TargetI&GHousing 35.0 30.0Increasing NAVMillions 25.0 20.0Sustaining NAV 15.0Decreasing NAV 10.0 5.0 8200920102011201220
Annual Stewardship - CompositeDeferring an average of 7.9M/year to the backlogAnnual Stewardship Investment vs. Target 35.0Spending Mix 30.035% 25.0MillionsAverage deferral: 7.9M/year 20.065%Deferred since FY05: 63.5M 15.0 10.0 5.0 rogram21
Annual Stewardship by CampusNMSU is funding stewardship targets well above the peer averageInstitutions ordered by tech rating. NMSU composite: 6th of 1022
Total Capital InvestmentOne-time spending has helped to sustain NAV in I&G spaceTotal Capital InvestmentI&GHousing 35.0 30.0Millions 25.0 20.0 15.0 10.0 5.0 8200920102011201223
Total Capital InvestmentHitting target investment range three out of eight yearsTotal Capital Investment – Composite Campus 35.0 30.0Millions 25.0 20.0 15.0 10.0 5.0 0.02005200620072008Annual Stewardship2009201020112012Asset Reinvestment24
Capital Spending vs. Peers, DatabaseProject spending by GSF is less than peers 4.28Peers8Y avg. 2.92NMSU8Y avg.NMSU spent 1.36/gsf less than peers.Based on composite campus size, thistranslates into 6.2M less spent than peers.25
Total Funding Target vs. PeersComposite peers hitting target regularly since FY07, NMSU fluctuating160NMSU I&G140NMSU HousingNMSU CompositeNMSU Composite PeersSustaining or Increasing Net Asset Value120% of TargetAvg: 105%Avg: 105%100Avg: 91%80Decreasing Net Asset Value6040Avg: 39%200Recurring capitalPlanned maintenanceOne-time capital26
Asset Reinvestment BacklogBased on backlog estimate, in line with peers historically, less in FY12FY12 peers: 87.38 80.38FY12 estimate ofNMSU’s backlog /gsf27
Backlog vs. Investment Portfolio StagesMaintaining steady backlog /gsf in the face of inflation leads to increasing NAVInvestment StrategyTotal Asset Reinvestment Backlog /GSFWith Sightlines project portfolio ranges 140.00Critical Maintenance/Gut RenovationStage: Major buildings componentsare in jeopardy of complete failure.Reliability issues are widespreadthroughout the building.Systemic Renovation Stage: Buildingsmay require more significant repairs ;large-scale capital infusions/renovations are inevitable; “Theprojects pick you” 120.00 100.00 80.00 60.00 40.00Repair and Maintain Stage: Buildingsare beginning to show their age andmay require more significantinvestment on a case-by-case basisCapital Upkeep Stage: Primarily newor recently renovated buildings w/sporadic building repair & life cycleneeds; “You pick the projects” 20.00 2005200620072008Backlog /GSF200950% NAV20102011201270% NAV28
Project Mix vs. PeersNMSU focused on space, less on envelope & mechanical needsI&G Project MixFY08-12 /GSF by Project Type5-Year Average (FY08-12)7% 1.40 1.208%24%31% /GSF 1.00 0.8030% 0.60Housing Project MixFY08-121% 0.40 0.2030% 0.00Bldg. Envelope Bldg. Systems InfrastructureSpaceCode50%13%NMSU 5Y avg.Peers 5Y avg.6%29
Operating Effectiveness30
Facilities Operating Budget5Y Daily Service average is 1.87/gsf, below FY12 peer averageFacilities Operating Budget 12.00 10.00 8.00 6.00 4.00 2.00 0.00ABCDaily ServiceDNMSUCompositeFPlanned MaintenanceGHIJUtilities31
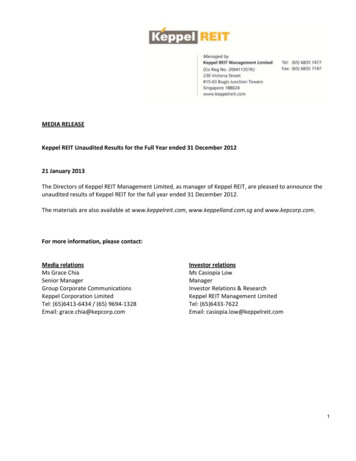
Regionally AdjustedRegionally adjusted, NMSU spends closer to peersFacilities Operating Budget – Regionally Adjusted 12.00NMSU original: 3.44NMSU, regionally adjusted: 3.54 10.00Original peer average: 6.10Adjusted peer average: 5.46 8.00 6.00 4.00 2.00 0.00ABCDaily ServiceDNMSUCompositeFPlanned MaintenanceGHIJUtilitiesRegionally indexed to Boston, MA. Institutions ordered by tech rating. NMSU Composite: 6 th of 10.32
Daily Service – Regionally AdjustedResources available to NMSU F&S are still scarce vs. peersDaily Service – Regionally Adjusted 3.37Peers FY12 6.00 5.00 4.00 3.00 2.00 1.92 1.00 -NMSU FY12Given NMSU’s composite campus of 4.6MGSF, daily service budget is smaller by 6.7million.33
Maintenance StaffingStaffing levels in line with peer average, higher materials per GSF used in FY12Institutions ordered by ascending tech rating. NMSU composite: 6 th of pervisor15.610.512.3 /GSF 0.38 0.19 ctionScore3.54.03.834
Custodial StaffingLower supervision level, overall lower cleanliness scoreInstitutions ordered by ascending density. NMSU composite: 6 th of pervisor24.010.412.8 /GSF 0.07 0.10 0.12CleanlinessInspectionScore3.64.34.135
Grounds StaffingSignificantly fewer materials available to staff, lower inspection scoresInstitutions ordered by ascending grounds intensity. NMSU composite: 1 st of or5.012.012.8 /Acre 118 473.68 576.48GroundsInspectionScore3.74.23.936
Energy ConsumptionReduction in energy use saves NMSU 646k vs. FY11Saving 646k by consuming less fuel in FY12 vs. FY11Institutions ordered by ascending tech rating. NMSU composite: 6 th of 10.37
Energy CostRising electric unit cost is responsible for increase in overall energy cost38
ServiceService Process Scores:Organizational StructureCentralization of RequestScheduling ProcessWork Request CapabilitiesPerformance Measurement012345Peer: 80DB: 83Peer: .80DB: .79Inspection Scores:CleanlinessGeneral Repair/ImpressionMechanical SpacesExteriorGrounds01234539
Customer Satisfaction SurveyAligning NMSU’s survey to meet benchmarking needsSightlinesNMSUCustomer SatisfactionKnowledge/Understanding in Process (Know)Schedule and service levels (Sched)Work meets expectations (Exp)Feedback (Feed)General satisfaction (Sat)40
Concluding CommentsAsset Value ChangeAnnual Stewardship-Annual StewardshipAsset ReinvestmentWith the NAV of campus in a Systemic Renovation Stage,focus spending on projects with the longest lifecycle.Asset ReinvestmentIt takes roughly 3- 4 in reinvestment spending to resultin the same impact as 1 in stewardship spending.Operational EffectivenessContinue to grow recurring capital and strive to reach100% of target. Deferring to the backlog will require onetime funds to fill the gap.A dollar spent in envelope/mechanical needs will last you20-25 years vs. space/program needs that will last you 810 years.Service41
Concluding CommentsOperations SuccessOperational Effectiveness-Increased electric unit cost would drive up total cost had itnot been for decreasing consumption. Continue tomonitor consumption to sustain the downward trend andregulate cost.Service-Asset ReinvestmentCustodial supervision is significantly higher than bothpeers & database. Adding more supervision couldimprove cleanliness scores on campus.Operational EffectivenessDaily service resources available to OFS are scarce vs.comparison groups, even when adjusted for regionaldifferences. Allocate additional resources towardoperations (namely PM) to release stress where possible.Annual StewardshipServiceLower inspection scores are likely caused by lesseravailability of resources than peers. Continue to deliverquality service with the available resources.42
Questions & Discussion43
1 Sightlines LLC FY2012 Facilities MB&A Presentation New Mexico State University Date: March 21, 2013 Presented by: Nate Pramuk, Forrest Ching