Transcription
National Survey of StudentEngagementReport to the Champlain CommunityAuthors: Michelle Miller and Ellen Zeman, Provost’s Office12/1/2007This report supplements the formal reports provided to Champlain by the NSSE organization. Herein aredetailed analyses of areas of high and low engagement by Champlain College freshman and seniors.Comparisons to selected peers, small private residential colleges and the national sample are included.Further breakdowns by academic division and some larger programs identify strengths and areas forimprovement at this level.
Table of ContentsIntroduction . 3Champlain Respondents . 4College-Wide Results – Benchmarks . 5Level of Academic Challenge . 6Active and Collaborative Learning . 7Student-Faculty Interaction . 8Enriching Educational Experiences . 9Supportive Campus Environment . 10Benchmark Means over Time . 11College-Wide Results – Highest and Lowest Levels of Engagement . 12Divisional Results . 14Division of Business . 15Business Majors . 15Division of Communication and Creative Media . 16Multimedia and Graphic Design Majors . 16Division of Education and Human Services . 17Education Majors . 17Division of Information Technology and Science . 18Division of Continuing Professional Studies. 19Using these Results . 202
IntroductionThe National Survey of Student Engagement (NSSE) gathers data from thousands of collegestudents in the US and Canada to determine their participation in programs and activitiesrelated to student learning and personal development. Research shows that the time andintensity students commit to purposeful educational activities correlates with theirachievement and personal growth. Certain institutional practices are known to lead to highlevels of student engagement, including student-faculty interaction, an inclusive and affirmingenvironment, high expectations for standards of performance, and respect for diverse talentsand learning styles.1 Institutions can use NSSE data, along with other relevant data, to improveeducational practice and student outcomes.In the spring of 2007 the Champlain College Office of Assessment and the President of theCollege invited 778 (464 first year and 314 senior) students to participate in the 2007 NationalSurvey of Student Engagement. Of those, 207 FY and 118 SR responded, for a response rate of41%. This compares quite favorably to the overall NSSE response rate of 30%. Over 300,000students from 610 institutions in the US and Canada participated in the 2007 survey. Of thoserespondents, 35% are male and 65% female; 91% are full-time students and 9% are part-time;44% live in on-campus housing; and 18% are age 24 and older.We presented the NSSE benchmark results of the 2007 survey to the Champlain communityearlier this fall. Those findings are included in the first section of this report along withadditional explanatory information.Any actions to improve engagement of our students, however, need to take place at the levelof individual questions rather than these broad benchmarks. This report also contains a moredetailed analysis at the question level and considers differences among divisions as well as afew of our larger programs. In order to focus on areas where there are statistical differencesbetween us and our peer groups and among divisions, mean difference analyses have beenused and reported. On occasion, supplemental information about the percent of studentschoosing individual answers is provided.1National Survey of Student Engagement National Report 2007, NSSE, Indiana University Centerfor Postsecondary Research (2007).3
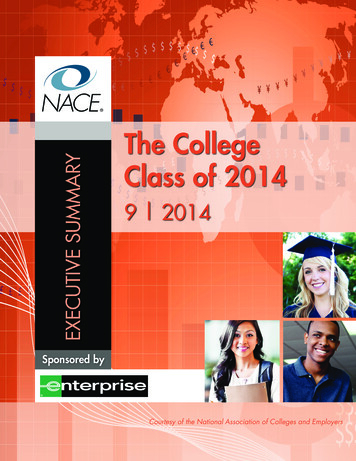
Champlain RespondentsDemographic Breakdown of Champlain NSSE 2007 RespondentsReported as percentage of the respondent 37%47%53%BucketTraditionalAdult90%10%ResidenceOn CampusOff Campus59%41%LoadFullPart91%9%DivisionBUS (TRAD)CCM (TRAD)EHS (TRAD)ITS (TRAD)CPS (ADULT)27%29%21%13%10%GenderSubclassificationFY MaleFY FemaleSR MaleSR FemaleFY TraditionalFY AdultSR TraditionalSR AdultFY OnFY OffSR OnSR OffFY FullFY PartSR FullSR FY First YearSR Senior4
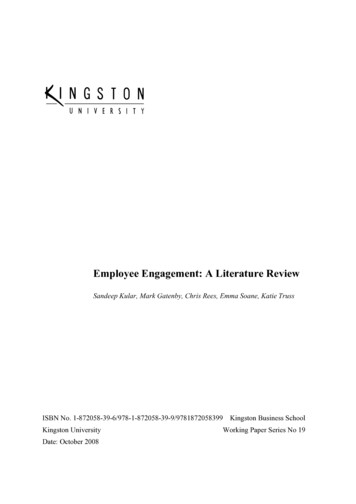
College-Wide Results - BenchmarksTo highlight the importance of student engagement and guide institutional improvement, NSSE created five clustersor "benchmarks" of effective educational practice:Active and Collaborative Learning (ACL)“Students learn more when they are intensely involved in their education and asked to think about what they arelearning in different settings. Collaborating with others in solving problems or mastering difficult material preparesstudents for the messy, unscripted problems they will encounter daily during and after college.”*Level of Academic Challenge (LAC)“Students learn more when they are intensely involved in their education and asked to think about what they arelearning in different settings. Collaborating with others in solving problems or mastering difficult material preparesstudents for the messy, unscripted problems they will encounter daily during and after college.”Student Faculty Interaction (SFI)“Students learn firsthand how experts think about and solve practical problems by interacting with faculty membersinside and outside the classroom. As a result, their teachers become role models, mentors, and guides forcontinuous, life-long learning.”Enriching Educational Experiences (EEE)“Complementary learning opportunities enhance academic programs. Diversity experiences teach students valuablethings about themselves and others. Technology facilitates collaboration between peers and instructors. Internships,community service, and senior capstone courses provide opportunities to integrate and apply knowledge.”Supportive Campus Environment (SCE)“Students perform better and are more satisfied at colleges that are committed to their success and cultivate positiveworking and social relations among different groups on campus.”These benchmark scores are calculated from the answers to those 42 (out of 85) survey items that are directlyrelated to the benchmark clusters topics. The scores can be compared with scores from other groups of institutions.Our results are compared graphically (in the pages following) with scores from (1) a group of 14 selected peers (greyhatch), (2) all 157 four-year small residential colleges that participated in the 2007 NSSE survey (yellow), and (3) all585 US institutions that participated in the 2007 NSSE survey (blue). A star indicates where the difference inbenchmark score between Champlain and one of these groups is statistically significant.Our Selected Peer GroupSelected peers come from the College‟s identified application overlap and aspiration schools:Bryant UniversityClarkson UniversityColby-Sawyer CollegeJohnson State CollegeMerrimack CollegeNortheastern UniversityNorwich UniversityPlymouth State UniversityQuinnipiac UniversityRochester UniversityRoger Williams UniversitySaint Michaels CollegeSavannah College of Art and DesignTemple University*From National Survey of Student Engagement Institutional Report 20075
Level of Academic ChallengeChamplain College students report experiencing a level of academic challenge similar to students nationwide aswell as to students from schools with which we share a significant overlap in our applicant pool. Champlain studentsexperience a slightly lower level of academic challenge than students at small, traditional residential four-yearcolleges.Although Champlain students tend to spend less time studying, on average, than their peers nationwide, they feelthat Champlain College does value the importance of studying and academic work.In their coursework Champlain students spend less time memorizing facts and more time analyzing and synthesizingideas, evaluating information, and applying concepts. Champlain students report that coursework requires a higherdegree of critical and analytical thinking as well as applying theories to solve practical problems.Champlain students write more short papers and a similar number of long papers; first-year students write fewer midlength papers.DetailsAcademics: 72% of FY and SR students feel that this institution places substantial emphasis on academics.Standards: 47% of FY and SR students frequently work harder than they thought they could to meet facultyexpectations.Homework: 23% of FY and 25% students spend more than 15 hours per week preparing for class. 17% of FY and26% of SR spend 5 hours or less.Thinking: First-year students report substantial emphasis on the following activities: Memorizing facts, ideas, ormethods: 46%; Analyzing basic elements of an idea or theory: 85%; Synthesizing and organizing ideas: 72%; Makingjudgments about value of information: 73%; Applying theories or concepts: 77%.Writing: 5% of FY and 18% of SR students write more than 10 papers between 5 and 19 pages; 13% of FY and 48%of SR have written a paper more than 20 pages in length.Reading: 28% of FY and 24% of SR students read more than 10 assigned books and packs of course readings. 17%of FY and 27% of SR read fewer than 5.Exams: 27% of FY and 44% of SR students report that their exams strongly challenge them to do their best work.6
Active and Collaborative LearningChamplain College first-year students report a higher level of active learning than their peers nationwide andstudents at our co-applicant schools. This result probably derives from Champlain‟s emphasis on experiential, handson learning, classroom presentations, group projects, and community-based activities.Most senior students frequently discuss readings or ideas from coursework outside of class. More than half of allstudents frequently work with other students on projects in class, and on assignments outside of class.More than half of first-year and a large majority of senior students report that they make frequent presentations inclass. Most seniors have participated in a community-based project as part of a regular class.By their senior year, more than two-thirds of students have participated in some form of practicum, internship, fieldexperience, co-op, or clinical assignment.DetailsOutside of class discussion: 47% of FY and 60% of SR students frequently discuss readings or ideas fromcoursework outside of class.Working together: 51% of FY and 53% of SR students frequently work with other students on projects in class, 47%of FY and 53% of SR work with peers on assignments outside of class.Class presentations: 54% of FY and 72% of SR students report that they make frequent presentations in class.Community-based projects in regular courses: 12% of FY and 27% of SR students frequently participate inservice-learning or community-based projects during a given year. 69% of FY and 36% of SR never took part in suchactivities.Application of learning to real life: By their senior year, 69% of students have participated in some form ofpracticum, internship, field experience, co-op, or clinical assignment.Tutoring: 18% of seniors frequently assist their fellow students by tutoring or teaching them.In-class discussion: 73% of FY and 85% of SR students frequently asked questions in class or contributed to classdiscussions.7
Student-Faculty InteractionChamplain’s overall score for student-faculty interaction is similar to those for our co-applicant schools andnationwide, but lower than for small, residential colleges. The lower score results from the fact that Champlain is not aresearch institution, and thus only a small percentage of students participate in research projects or committee workwith a faculty member.Champlain faculty receive higher scores for being available, helpful and sympathetic as well as for providing promptfeedback on work. Most seniors find they are able to discuss career plans or grades with faculty. Champlain studentsgive high scores for quality of academic advising.DetailsAccessible and supportive faculty: 52% of FY and 66% of SR students say their faculty are available, helpful andsympathetic.Research projects with faculty: By their senior year, 12% of students have done research with a faculty member.Prompt feedback on academic performance: 66% of FY and 78% of SR students indicate that they frequently getprompt verbal or written feedback from faculty members.Talk with advisors or faculty members about their career plans: 84% of seniors at least occasionally discusscareer plans with faculty. 18% of seniors frequently talk with faculty members about career plans and 16% never do.17% of ITS and 21% of EHS seniors say they never talk with faculty.Work with faculty on committees and projects outside of course work: 48% of FY and 50% of SR students atleast occasionally spend time with faculty members on activities other than coursework.8
Enriching Educational ExperiencesChamplain scored lower overall in this category than our co-applicant schools, nationwide, and small, residentialcolleges. Champlain students reported low participation in learning communities, independent study, self-designedmajors, co-curricular activities, foreign language study, and study abroad. They gave low scores for racial and ethnicdiversity. However, Champlain students reported very high rates of participation in community service.New initiatives are well under way at Champlain to increase participation in these experiences. The College isactively expanding study abroad and foreign language offerings. Champlain‟s new Core Curriculum is alreadycreating learning communities, while the new Student Life Curriculum will provide vastly expanded co-curricularopportunities and the recently established Office of Student Diversity and Inclusion will allow students to experience abroader range of perspectives.DetailsLearning communities: During their first year, 11% of students participate in a learning community. By their senioryear, 8% of students have taken an independent study class.Interaction with peers with different social, political, or religious views: 50% of students say they frequentlyhave serious conversations with students who are different from themselves in terms of their religious, political, orpersonal beliefs.Interact with peers from different racial or ethnic backgrounds: 33% of FY and 30% of SR students frequentlyhave serious conversations with those of a different race.Study abroad: By their senior year, 7% of students have studied abroad.Spirituality: 13% of FY and 18% of SR students frequently engage in spiritually enhancing activities such asworship, meditation, or prayer.Community service: By the time they are seniors, 72% of students have participated in community service orvolunteer work.9
Supportive Campus EnvironmentChamplain’s overall score for supportive campus environment is similar to those for our co-applicant schools andnationwide, but lower than small, residential colleges.Students give Champlain faculty and staff higher ratings for being available and helpful. Most students find their peersto be friendly. A large majority of students feel that Champlain has a substantial commitment to their academicsuccess. Fewer feel well-supported by the institution regarding their social needs.A large percentage of first-year students live on campus at Champlain, while only a small percentage of seniors do.Thus, it is unsound to directly compare ratings of on-campus activities by Champlain seniors to ratings by seniors atother small residential colleges.A high percentage of all students report a favorable image of this institution; a large majority would choose this schoolagain if they could start their college career over.DetailsGetting along with other students: 67% of FY and 53% of SR students report that their peers are friendly,supportive, and help them feel as if they belong.Overall educational experience: 88% of FY students report a favorable image of this institution; 84% of seniorswould choose this school again if they could start their college career over.Co-curricular activities: 2% of FY and 1% of SR students spend more than 15 hours a week participating in cocurricular activities. 16% of FY and 9% of SR students spend 6-15 hours per week; 40% of FY and 23% of SRstudents spend 1-5 hours per week; 42% of FY and 67% of SR report spending no time participating in co-curricularactivities.Administrators and staff: 35% of students find the administrative personnel and offices helpful, considerate, andflexible.To what extent does the school help students deal with their academic and social needs? 80% of FY and 73%of SR students feel that this institution has a substantial commitment to their academic success. 50% of FY and 31%of SR feel well-supported by the institution regarding their social needs.10
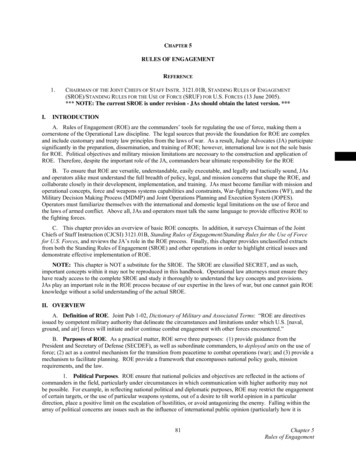
Benchmark Means over TimeChamplain College participated in NSSE in 2002, 2005 and 2007. NSSE has recalculated scores forthese years for four of the five benchmarks to allow more accurate comparison of institutionalperformance over time using the same metric. Changes in the response options for „enriching‟ items(EEE) make it untenable to compare newer results on these items with historical scores.Scores for Champlain seniors over this time have been higher than for first year students, except for theSupportive Campus Environment cluster, for which SR scores dip below FY scores in 2007. Level ofAcademic Challenge remains level over time. All other benchmarks are rising slightly with time, with theexception of SCE for seniors.Note: These changes have not been tested for statistical significance.11
College-Wide Results – Highest and Lowest Levels of EngagementIn the following section, a indicates that getting a low score on this item is a positive indicator ofengagement. A indicates that getting a high score on this item adversely affects engagement.Champlain’s Top Ten Mean NSSE Scores (highest on top)1.2.3.4.5.6.7.8.9.10.Use Email to communicate with instructorUse computers in academic workWould go to same college all over againQuality of relationships with other studentsEntire experience at Champlain CollegeUse computing and information technologyCoursework emphasizes analytical workQuality of academic advisingQuality of relationships with facultyWorking effectively with othersChamplain’s Bottom Ten Mean NSSE Scores (lowest on top)1.2.3.4.5.6.7.8.9.10.Study abroadIndependent study/self-designed majorResearch with facultyParticipate in learning communityForeign language courseworkTime spent working for pay on campus Time spent in co-curricular activityTime spent caring for dependentsTime spent commuting to class Senior project or thesis (only 27% of SR have completed one)Champlain Scored Significantly Higher than Selected Peers in1.2.3.4.5.6.7.8.9.10.Work for pay off campus Write short papersCommunity service or volunteer work (SR Only)Made a class presentation (FY Only)Time spent relaxing socializing (FY Only) Participated in community-based project as part of regular course (SR Only)Number of problem sets that take 1 hour to complete (FY Only)Used electronic medium (chat group, etc.) for an assignment (FY Only)Quality of academic advisingVoting in local, state, or national elections (FY Only)Champlain Scored Significantly Lower than Selected Peers in1.2.3.4.5.6.7.8.Foreign language courseworkSenior project or thesisHad serious conversations with students of different race or ethnicityParticipate in a learning communityIndependent study or self-designed major (SR)Study abroad (SR)Attending campus events and activities (SR Only)Memorizing facts 12
9. Time spent in co-curricular activity10. Community service or volunteer work (FY Only)Champlain Scored Significantly Higher than Four-Year Residential Colleges in1.2.3.4.5.6.7.8.9.10.Working for pay off campus Write short papersTime spent relaxing and socializing (FY Only) Made a class presentation (FY Only)Used electronic medium to discuss or complete an assignmentCollege contributed to acquisition of work-related knowledge, skillsCollege emphasizes using computers in academic workNumber of problem sets that take more than one hour (SR Only)Number of problem sets that take less than one hourCollege contributed to skill in using computing and information technology (FY Only)Champlain Scored Significantly Lower than Four-Year Residential Colleges in1.2.3.4.5.6.7.8.9.10.Foreign language courseworkCollege contributed to developing a deepened sense of spiritualityParticipated in activities to enhance spiritualityCollege emphasizes attending campus events and activitiesTime spent in co-curricular activityExams challenged student to do best workSpent significant time studyingHad serious conversations with students of a different race or ethnicityCollege contributed to ability to learn effectively on your ownCollege contributed to acquisition of a broad general educationChamplain Scored Significantly Higher than NSSE Overall in1.2.3.4.5.6.7.8.9.10.Write short papersMade a class presentationTime spent relaxing and socializing (FY Only) Used an electronic medium to discuss or complete an assignmentCollege contributed to acquiring job or work-related knowledgeAsked questions in class or contributed to class discussions (FY Only)Participated in a community-based project as part of a regular course (SR Only)Practicum, internship, field experience, etc. (SR Only)Quality of relationships with facultyNumber of problem sets that take less than an hour to completeChamplain Scored Significantly Lower than NSSE Overall in1.2.3.4.5.6.7.8.9.10.Exams challenged you to do your best workHad serious conversations with students of a different race or ethnicityParticipated in activities to enhance your spiritualityForeign language courseworkMemorizing facts College contributed to developing a deepened sense of spiritualityTime spent in co-curricular activitiesCollege emphasizes spending significant amounts of time studyingTime spent commuting (FR Only) Time spent attending campus events (SR Only)13
Divisional ComparisonsThe Assessment Office tested the NSSE raw data to determine which survey items showed statisticallysignificant differences by division. We also looked at a few majors that had populations sufficient to allowstatistical analysis. In the BUS, CCM, EHS, and ITS divisions, the analysis includes only Traditionalstudents. The populations were analyzed by class level (FY separate from SR). In the CPS division theanalysis compares the Adult to the Traditional population. A indicates that getting a low score on thisitem is a positive indicator of engagement. A indicates that getting a high score on this item adverselyaffects engagement.Academic Affairs will provide mean data for each division in auxiliary files.Number of Respondents by Division:GroupChamplain TraditionalBUS Division TraditionalBUSI Program TraditionalCCM Division TraditionalMMGD Program TraditionalEHS Division TraditionalEDUC Program TraditionalITS Division TraditionalCPS Division 4
Division of BusinessTraditional BUS students rated these items significantly higher than did other Traditional students atChamplain:Asked questions in class or contributed to class discussions (FY)Made a class presentation (FY)Worked on a paper or project that required integrating ideas or information (FY)Worked with classmates outside of class to prepare class assignments (FY)Talked about career plans with a faculty member or advisor (FY)Number of assigned textbooks, books, or book-length packs of course readings (SR)Number of written papers or reports of fewer than 5 pages (SR)Number of problem sets that take you less than an hour to complete (FY)Exercised or participated in physical fitness activities (FY)College encourages contact among students from different economic, social, and racial or ethnicbackgrounds (FY)Traditional BUS students rated these items significantly lower than did other Traditional students:College contributes to skills in writing clearly and effectively (FY)Quality of academic advising (FY)Business MajorsTraditional Business majors rated these items significantly higher than did other Traditional students atChamplain:Worked on a paper or project that required integrating ideas from various sources (FY)Worked with other students on projects during class (FY)Worked with classmates outside of class to prepare class assignments (FY)Number of assigned textbooks, books, or book-length packs of course readings (SR)Number of medium-length papers (FY)Number of short papers (SR)Number of problem sets that take you less than an hour to complete (SR)Time spent working for pay off campus (FY) Providing care for dependents living with you (FY)Traditional Business majors rated these items significantly lower than did other Traditional students atChamplain:The extent to which exams challenge you to do your best workHad serious conversations with students who are very different from you (SR)Quality of relationships with faculty (SR)College emphasizes spending significant amounts of time studying and on academic work (SR)College provides the support you need to help you succeed academically (SR)College contributed to acquiring job or work-related knowledge and skills (SR)College contributed to skill in writing clearly and effectively (FY)Quality of academic advising (SR)Overall educational experience15
Division of Communication and Creative MediaTraditional CCM students rated these items significantly higher than did other Traditional students atChamplain:Discussed ideas from your readings or classes with others outside of class (FY)Participated in activities to enhance your spirituality (FY)Examined the strengths and weaknesses of your own views on a topic or issue (FY)Tried to better understand someone else's views (FY)Plan to participate in culminating senior experience (FY)Quality of relationships with other students (FY)Time spent relaxing and socializing (FY) College provides the support you need to help you succeed academically (SR)Attending campus events and activities (SR)Entire college experience (FY)Traditional CCM students rated these items significantly lower than did other Traditional students:Working for pay off campus (FY) Talked about career plans with a faculty member or advisor (FY)Number of written papers or reports between 5 and 19 pages (both)Number of problem sets that take you less than an hour to complete (FY)Multimedia and Graphic Design MajorsTraditional MMGD majors rated these items significantly higher than did other Traditional students atChamplain:Participated in activities to enhance your spirituality (FY)Culminating senior experience (both)Traditional MMGD majors rated these items significantly lower than did other Traditional students atChamplain:Tutored or taught other students (SR)Discussed ideas from your readings or classes with others outside of class (SR)Course emphasis on analyzing the basic elements of an idea, experience, or theory (FY)Course emphasis on synthesizing and organizing ideas, information, or experiences (SR)Number of long papers (SR)Number of medium-length papers (both)Number of short papers (SR)College encourages contact among students from different backgrounds (SR)College helps you cope with your non-academic responsibilities (FY)College contributed to acquiring a broad general education (SR)College contributed to skill in speaking clearly and effectively (both)College contributed to skill in thinking critically and analytically (SR)College contributed to skill in analyzing quantitative problems (SR)Overall college experience (SR)16
Division of Education and Human ServicesTraditional EHS students rated these items significantly higher than did other Traditional students atChamplain:Worked with other students on projects during class (FY)Tutored or taught other students (SR)Participated in a community-based project as part of
44% live in on-campus housing; and 18% are age 24 and older. We presented the NSSE benchmark results of the 2007 survey to the Champlain community earlier this fall. Those findings are included in the first section of t