Transcription
Image description. Cover Image End of image description.What Is IPEDS?The Integrated Postsecondary Education DataSystem (IPEDS) is a system of survey componentsthat collects data from all institutions that providepostsecondary education and are eligible to receiveTitle IV funding across the United States and otherU.S. jurisdictions.These data are used at the federal and state level forpolicy analysis and development; at the institutionallevel for benchmarking and peer analysis; and bystudents and parents, through the College Navigator(https://nces.ed.gov/collegenavigator/), an online toolto aid in the college search process. Additionalinformation about IPEDS can be found on thewebsite at https://nces.ed.gov/ipeds.What Is the Purpose of This Report?The Data Feedback Report is intended to provideinstitutions a context for examining the data theysubmitted to IPEDS. The purpose of this report is toprovide institutional executives a useful resource andto help improve the quality and comparability ofIPEDS data.What Is in This Report?The figures in this report provide a selection ofindicators for your institution to compare with a groupof similar institutions. The figures draw from the datacollected during the 2019-20 IPEDS collection cycleand are the most recent data available. The insidecover of this report lists the pre-selected comparisongroup of institutions and the criteria used for theirselection. The Methodological Notes at the end of thereport describe additional information about theseindicators and the pre-selected comparison group.Where Can I Do More with IPEDS Data?Each institution can access previously released DataFeedback Reports from 2005 and customize this2020 report by using a different comparison groupand IPEDS variables of its choosing. To learn how tocustomize the 2020 report, visit this resource pagehttps://nces.ed.gov/Ipeds/Help/View/2. To downloadarchived reports or customize the current DataFeedback Report, visit the ‘Use the Data’ portal onthe IPEDS website https://nces.ed.gov/ipeds andclick on Data Feedback Report.Renton Technical CollegeRenton, WA
Renton Technical CollegeCOMPARISON GROUPComparison group data are included to provide a context for interpreting your institution’s indicators. If your institution did not define a customcomparison group for this report by July 13, 2020 NCES selected a comparison group for you. (In this case, the characteristics used to definethe comparison group appears below.) The customized Data Feedback Report function available at https://nces.ed.gov/ipeds/use-the-data/can be used to reproduce the figures in this report using different peer groups.Using some of your institution's characteristics, a group of comparison institutions was selected for you. The characteristics include degreegranting four-year, primarily associate's, Carnegie classification of Associate's Dominant, public and enrollment of a similar size. Thiscomparison group includes the following 35 institutions:Alpena Community College (Alpena, MI)Bellingham Technical College (Bellingham, WA)Bismarck State College (Bismarck, ND)Bowling Green State University-Firelands (Huron, OH)Cascadia College (Bothell, WA)Centralia College (Centralia, WA)East Georgia State College (Swainsboro, GA)Feather River Community College District (Quincy, CA)Florida Gateway College (Lake City, FL)Galveston College (Galveston, TX)Grays Harbor College (Aberdeen, WA)Grayson College (Denison, TX)Gulf Coast State College (Panama City, FL)Kent State University at Ashtabula (Ashtabula, OH)Kent State University at Geauga (Burton, OH)Kent State University at Stark (Canton, OH)Lake Michigan College (Benton Harbor, MI)Lake Washington Institute of Technology (Kirkland, WA)Lower Columbia College (Longview, WA)Morgan Community College (Fort Morgan, CO)North Central State College (Mansfield, OH)North Florida College (Madison, FL)Northwestern Michigan College (Traverse City, MI)Ohio University-Chillicothe Campus (Chillicothe, OH)Ohio University-Eastern Campus (Saint Clairsville, OH)Ohio University-Lancaster Campus (Lancaster, OH)Ohio University-Southern Campus (Ironton, OH)Peninsula College (Port Angeles, WA)Potomac State College of West Virginia University (Keyser, WV)South Florida State College (Avon Park, FL)The College of the Florida Keys (Key West, FL)University of Hawaii Maui College (Kahului, HI)Wenatchee Valley College (Wenatchee, WA)Western Nevada College (Carson City, NV)Whatcom Community College (Bellingham, WA)The figures in this report have been organized and ordered into the following topic areas:Topic AreaFigures1) Admissions (only for non-open-admissions schools)[No charts applicable]Pages2) Student Enrollment1, 2 and 333) Awards444) Charges and Net Price5 and 645) Student Financial Aid7 and 84 and 56) Military Benefits*[No charts applicable]7) Retention and Graduation Rates9, 10, 11, 12, 13, 14 and 155, 6, 7 and 88) Finance16 and 1799) Staff18 and 19910) Libraries*20 and 2110*These figures only appear in customized Data Feedback Reports (DFRs), which are available through Use the Data portal on the IPEDS website.IPEDS DATA FEEDBACK REPORT2
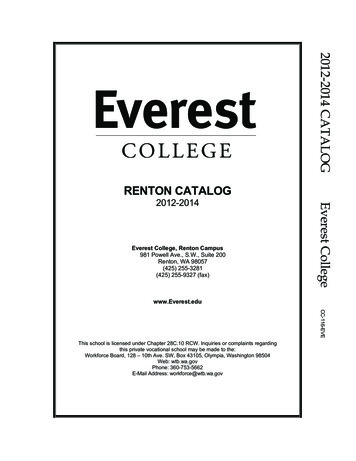
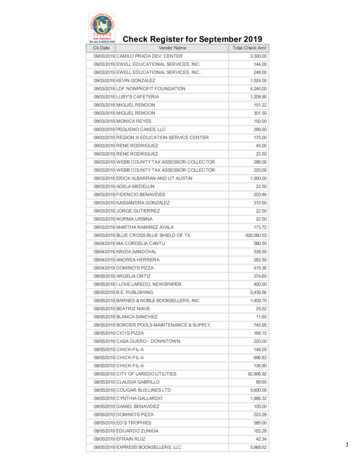
Renton Technical CollegeFigure 1.Percent of all students enrolled, by race/ethnicity, and percent of students who are women: Fall 2019Image description.BarchartwithScale10 groupsXscaletitledlabel.with 2 items per a Native.Item 2,1,1,Yourinstitution1. orItemComparisonGroupMedian (N 35) 0.01.GroupAsian.Item1,2,Yourinstitution10. Median (N 35) 1.Item2,ComparisonGroupGroup3,Blackor AfricanIteminstitution10.American.Item 1,2, YourComparisonGroupMedian (N 35) 4.GroupHispanic/Latino.Item1,4,Yourinstitution10. Median (N 35) 8.Item2,ComparisonGroupGroupNativeHawaiianother Pacific Islander.Item1,5,Yourinstitution1. orItem2,ComparisonGroupMedian (N 35) 0.01.GroupWhite.Item1,6,Yourinstitution23. Median (N 35) 69.Item2,ComparisonGroupGroupTwoinstitutionor moreraces.Item1,7,Your3. Median (N 35) n.Item 2,1, ComparisonYour institution43. Median (N 35) tution0.01.Median (N 35) on30. Median (N 35) 61.Item 1,2, YourComparisonGroupRace/ethnicityor : Your institutionShapeComparisonGroupLegend,End of image description. Label: Comparison Group Median (N rican Indian orAlaska NativeAsian108410Black or AfricanAmerican1Hispanic/Latino30Native Hawaiian orother Pacific IslanderWhite4Two ormore races30Race/ethnicityunknown1Nonresident alienWomenRace/ethnicity or genderYour institutionComparison Group Median (N 35)NOTE: For more information about disaggregation of data by race and ethnicity, see the Methodological Notes. Median values for the comparison group will not add to 100%. See 'Use ofMedian Values for Comparison Group' for how median values are determined. N is the number of institutions in the comparison group.SOURCE: U.S. Department of Education, National Center for Education Statistics, Integrated Postsecondary Education Data System (IPEDS): Spring 2020, Fall Enrollment component.Figure 2.Unduplicated 12-month headcount of all students and ofundergraduate students (2018-19), total FTE enrollment(2018-19), and full- and part-time fall enrollment (Fall2019)Image description.EnrollmentmeasureHorizontalBarchart with5 groups with 2 items per group.Xscale titledtitledNumberof nt - GroupMedian- (N tem n (N 35) 3774.GroupTotalFTE risonGroupMedian (N 35) n1255.Item 1,2, YourComparisonGroupMedian (N 35) itution2500.Item2,ComparisonGroupMedian (N 35) 1575.Shapeline,Label:ShapeInstitutionLegend,Label: Your institutionShapeComparisonGroupLegend,End of image description. Label: Comparison Group Median (N 35)Figure 3.Percent of students enrolled in distance educationcourses, by amount of distance education and studentlevel: Fall 2019Image hartparticipationwith6 groups with 2 items per group.Xscale titledtitledof students.YscaleScale label.GroupUndergraduatesin distance education (N 35).Item1,1,Yourinstitution9. aduatesat least15.one but not all distance education courses (N 35).Item pGroupUndergraduatesin any25.distance education (N roupMedian53. in distance education (N onNo data.Item 1,2, YourComparisonGroupMedianNo data.GroupGraduatestudentsin at leastone but not all distance education courses (N 1).Item1,5,YourinstitutionNo data.Item2,ComparisonGroupMedianNo data.GroupGraduatestudentsnot enrolledin any distance education (N 1).Item1,6,YourinstitutionNo data.Item2,ComparisonGroupMedian No data.Shapeline,Label:ShapeInstitutionLegend,Label: Your isonGroup MedianEnd of image description.Enrollment measureDistance education participation3,774253,774Undergraduates not inany distance education (N 35)2,501Total FTEenrollment1,7657953Graduate students exclusively indistance education (N 1)1,255Full-timefall enrollment1,006Graduate students in at least one but not all distance.2,500Part-timefall enrollmentGraduate students not enrolledin any distance education (N 1)1,57502,0004,0006,0008,0000Number of studentsYour institution1513Undergraduates in at least one but not all distance.6,190Unduplicated headcount -.9Undergraduates exclusivelyin distance education (N 35)6,190Unduplicatedheadcount - total406080Percent of studentsComparison Group Median (N 35)NOTE: For details on calculating full-time equivalent (FTE) enrollment, see CalculatingFTE in the Methodological Notes. Total headcount, FTE, and full- and part-time fallenrollment include both undergraduate and postbaccalaureate students, when applicable.N is the number of institutions in the comparison group.SOURCE: U.S. Department of Education, National Center for Education Statistics,Integrated Postsecondary Education Data System (IPEDS): Fall 2019, 12-monthEnrollment component and Spring 2020, Fall Enrollment component.20Your institutionComparison Group MedianNOTE: N is the number of institutions in the comparison group. Medians are not reportedfor comparison groups with less than three values.SOURCE: U.S. Department of Education, National Center for Education Statistics,Integrated Postsecondary Education Data System (IPEDS): Spring 2020, Fall Enrollmentcomponent.IPEDS DATA FEEDBACK REPORT3
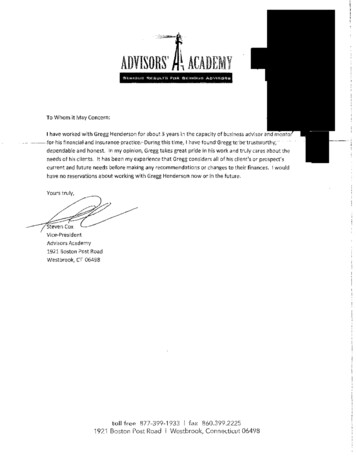
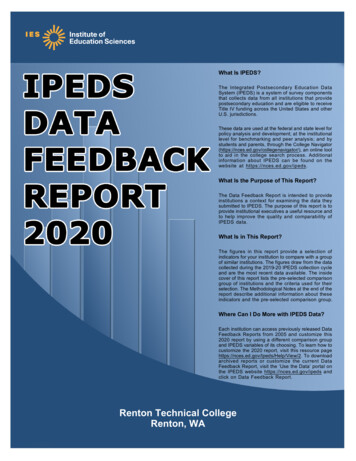
Renton Technical CollegeFigure 4.Number of degrees awarded, by level: 2018-19Figure 5.Image description.Degree levelHorizontalBarNumberchart with6 groups with 2 items per group.Xscale titledtitledof omparisonGroup(N 35) rinstitution0.01.MedianItem2,ComparisonGroup(N 35) 0.01.GroupDoctor'sOther.Item 2,1,3,Yourinstitution0.01.Median (N 35) institution0.01.Median (N 35) stitution7. Median (N 35) 11.Item 1,2, stitution303.Median (N 35) itutionLegend,Label: Your institutionShapeComparisonGroupLegend,End of image description. Label: Comparison Group Median (N 35)Tuition and required fees for full-time, first-timedegree/certificate-seeking undergraduates: Academicyears 2016-17 to 2019-20Image description.Academic yearHorizontalBarTuitionchart withgroups with 2 items per group.Xscale titledtitledand 4fees.YscaleScale label.Group2019-20.Item1,1,Yourinstitution 5567.Item2,ComparisonGroupMedian (N 35) 4188.Group2018-19.Item1,2,Yourinstitution 5466.Item2,ComparisonGroupMedian (N 35) 4035.Group2017-18.Item 2,1,3,Yourinstitution 5377.ItemComparisonGroupMedian (N 35) 3993.Group2016-17.Item1,4,Yourinstitution 4836.Item2,ComparisonGroupMedian (N 35) 3746.Shapeline,Label:ShapeInstitutionLegend,Label: Your institutionShapeComparisonGroupLegend,End of image description. Label: Comparison Group Median (N 35)Degree levelAcademic year0Doctor's Research/.0 5,5672019-20 4,18800Doctor's Professional.00Master's 5,4662018-19Doctor's 0Other 0 4,035 5,3772017-18 3,993711Bachelor's0100200 4,8362016-17303Associate's 3,746405300400500 0 1,000 2,000Number of degreesYour institution 3,000 4,000 5,000 6,000Tuition and feesComparison Group Median (N 35)Your institutionComparison Group Median (N 35)NOTE: For additional information about postbaccalaureate degree levels, see theMethodology Notes. N is the number of institutions in the comparison group.SOURCE: U.S. Department of Education, National Center for Education Statistics,Integrated Postsecondary Education Data System (IPEDS): Fall 2019, Completionscomponent.NOTE: The tuition and required fees shown here are the lowest reported from thecategories of in-district, in-state, and out-of-state. N is the number of institutions in thecomparison group.SOURCE: U.S. Department of Education, National Center for Education Statistics,Integrated Postsecondary Education Data System (IPEDS): Fall 2019, InstitutionalCharacteristics component.Figure 6.Figure 7.Average net price of attendance for full-time, first-timedegree/certificate-seeking undergraduate students, whowere awarded grant or scholarship aid: 2016-17 to 201819Image description.AcademicyearHorizontalBarNetchartwith 3 groups with 2 items per group.Xscale em1,1,Yourinstitution 7431.Item2,ComparisonGroupMedian (N 35) 7853.Group2017-18.Item 2,1,2,Yourinstitution 5908.ItemComparisonGroupMedian (N 35) 7265.Group2016-17.Item1,3,Yourinstitution 6396.Item2,ComparisonGroupMedian (N 35) 7291.Shapeline,Label:ShapeInstitutionLegend,Label: Your institutionShapeComparisonGroupLegend,End of image description. Label: Comparison Group Median (N 35)Image description.Typeof aidBar chart with 8 groups with 2 items per group.HorizontalXscale titledtitled ScalePercentof students.YscaleGroupAnyinstitutiongrant label.aid.61.Item1,1,YourItem2,ComparisonGroup Median (N 35) 67.GroupFederalgrants.Item 2,1,2,Yourinstitution53. Median (N 35) tem1,3,Your48. Median (N 35) teminstitution43. Median (N 35) 29.Item 1,2, 5,Yourinstitution18. Median (N 35) 24.Item2,ComparisonGroupAnyinstitutionloans. GroupItem1,6,Your13. Median (N 35) Yourinstitution13. Median (N 35) urinstitution0.01.Median (N 35) utionLegend,Label: Your institutionShapeComparisonGroupLegend,End of image description. Label: Comparison Group Median (N 35)Academic yearType of aidAny grantaid 7,4312018-19 7,853 6,396 7,291 2,000 4,000 6,000Federalgrants50Pellgrants485018Any loans13Federalloans13Your institution241717Other loans 01 8,000010Net price2030405060708090100Percent of studentsComparison Group Median (N 35)NOTE: Average net price is for full-time, first-time degree/certificate-seekingundergraduate students and is generated by subtracting the average amount of federal,state/local government, and institutional grant and scholarship awarded aid from the totalcost of attendance. Total cost of attendance is the sum of published tuition and requiredfees, books and supplies, and the average room and board and other expenses. Fordetails, see the Methodological Notes. N is the number of institutions in the comparisongroup.SOURCE: U.S. Department of Education, National Center for Education Statistics,Integrated Postsecondary Education Data System (IPEDS): Fall 2019, InstitutionalCharacteristics component and Winter 2019-20, Student Financial Aid component.67534329Institutionalgrants 7,2652016-1761State/localgrants 5,9082017-18 0Percent of full-time, first-time degree/certificate-seekingundergraduate students who were awarded grant orscholarship aid, or loans, by type of aid: 2018-19Your institutionComparison Group Median (N 35)NOTE: Any grant aid above includes grant or scholarship aid awarded from the federalgovernment, state/local government, or the institution. Federal grants includes Pell grantsand other federal grants. Any loans includes federal loans and other loans awarded tostudents. For details on how students are counted for financial aid reporting, see CohortDetermination in the Methodological Notes. N is the number of institutions in thecomparison group.SOURCE: U.S. Department of Education, National Center for Education Statistics,Integrated Postsecondary Education Data System (IPEDS): Winter 2019-20, StudentFinancial Aid component.IPEDS DATA FEEDBACK REPORT4
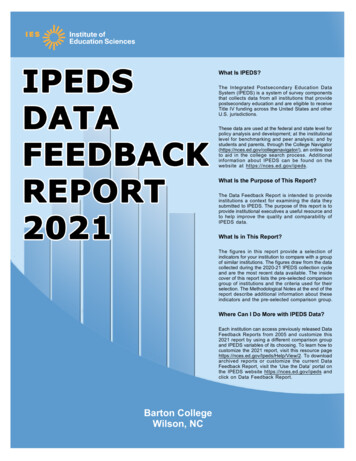
Renton Technical CollegeFigure 8.Average amounts of awarded grant or scholarship aid, orloans awarded to full-time, first-time degree/certificateseeking undergraduate students, by type of aid: 2018-19Image description.Type of aidBar chart with 8 groups with 2 items per group.HorizontalXscale titledtitled ScaleAid dollars.YscaleGroupAnyinstitutiongrant label.aid 6365.(N 35).Item1,1,YourItem2,ComparisonGroupMedian 5232.GroupFederalgrants(N 35).Item1,2,Yourinstitution 4267.Item2,ComparisonMedian 4694.GroupPellinstitutiongrants Group(N 35).Item 2,1,3,Your ts(N 34). 4592.Item1,4,Yourinstitution algrants(N 35). 2520.Iteminstitution 1194.Item 1,2, YourComparisonMedian 1727.GroupAnyinstitutionloans Group(N 34).Item1,6,Your 5639.Item2,ComparisonGroupMedian 5015.GroupFederalloans(N 33).Item1,7,Yourinstitution 5639.Item2,ComparisonMedian 4735.GroupOtherloansGroup(N 18).Item1,8,YourinstitutionNo data.Item2,ComparisonGroupMedian 7743.Shapeline,Label:ShapeInstitutionLegend,Label: Your institutionShapeComparisonGroupLegend,End of image description. Label: Comparison Group MedianFigure 9.Graduation and transfer-out rates of full-time, first-timedegree/certificate-seeking undergraduates within 150%of normal time to program completion: 2013 cohortImage description.MeasureHorizontalBarPercent.chart with 2 groups with 2 items per group.Xscale titledtitledYscaleScale 3. Overall.Item2,ComparisonGroupMedian (N 35) 32.GroupTransfer-outrate.Item1,2,Yourinstitution7. Median (N 35) tutionLegend,Label: Your institutionShapeComparisonGroupLegend,End of image description. Label: Comparison Group Median (N 35)Type of aidMeasureAny grantaid (N 35) 6,365 5,232Federalgrants (N 35) 4,267 4,694Pellgrants (N 35)63Graduation rate,Overall 4,040 4,592State/localgrants (N 34) 2,520Institutionalgrants (N 35)32 3,277 1,194 1,727Any loans(N 34) 5,015Federalloans (N 33) 4,735 5,6397Transfer-out rate 5,63915Other loans(N 18) 7,743 0 2,000 4,000 6,000 8,000010203040Aid dollarsYour institution5060708090100PercentComparison Group MedianYour institutionNOTE: Any grant aid above includes grant or scholarship aid awarded from the federalgovernment, state/local government, or the institution. Federal grants includes Pell grantsand other federal grants. Any loans includes federal loans and other loans awarded tostudents. Average amounts of aid were calculated by dividing the total aid awarded by thetotal number of recipients in each institution. N is the number of institutions in thecomparison group.SOURCE: U.S. Department of Education, National Center for Education Statistics,Integrated Postsecondary Education Data System (IPEDS): Winter 2019-20, StudentFinancial Aid component.Comparison Group Median (N 35)NOTE: Graduation rate cohort includes all full-time, first-time degree/certificate-seekingundergraduate students. Graduation and transfer-out rates are the Student Right-to-Knowrates. Only institutions with mission to prepare students to transfer are required to reporttransfer out. For more details, see the Methodological Notes. N is the number ofinstitutions in the comparison group.SOURCE: U.S. Department of Education, National Center for Education Statistics,Integrated Postsecondary Education Data System (IPEDS): Winter 2019-20, GraduationRates component.Figure 10. Graduation rates of full-time, first-time degree/certificate-seeking undergraduates within 150% of normal time to programcompletion, by race/ethnicity: 2013 cohortImage description.BarchartwithScale10 groupsX scalescaletitledlabel.with 2 items per group.YtitledPercent.GroupGraduationrate,(N 35).Item1,1,Yourinstitution63. ndianAlaska32.Native (N 28).IteminstitutionNo ordata.Item 1,2, YourComparisonGroupMedian 9.GroupAsian(N 29).Item1,3,Yourinstitution60. Median 33.Item2,ComparisonGroupGroupBlackor African(N isonGroupMedian N ianorother PacificIslander (N oupMedian 0.01.Group7,White(N 35).Item 2,1, ComparisonYour institution67. Median 33.ItemGroupGroupTwoinstitutionor moreraces(N 34).Item1,8,Your55. yunknown (N 33).Item1,Yourinstitution57.Item (N 14).Item1, ComparisonYourinstitutionNodata.Item2,GroupMedian 33.Graduationrates by nd,Label: Your institutionShapeComparisonGroupLegend,End of image description. Label: Comparison Group 30200Graduation rate,Overall (N 35)American Indian orAlaska Native (N 28)251091003322Asian (N 29)Black or AfricanAmerican (N 33)0Hispanic/Native Hawaiian orLatino (N 34) other Pacific Islander (N 17)White(N 35)Two ormore races (N 34)Race/ethnicityunknown (N 33)Nonresidentalien (N 14)Graduation rates by race/ethnicityYour institutionComparison Group MedianNOTE: For more information about disaggregation of data by race and ethnicity, see the Methodological Notes. The graduation rates are the Student Right-to-Know (SRK) rates. Medianvalues for the comparison group will not add to 100%. N is the number of institutions in the comparison group.SOURCE: U.S. Department of Education, National Center for Education Statistics, Integrated Postsecondary Education Data System (IPEDS): Winter 2019-20, Graduation Ratescomponent.IPEDS DATA FEEDBACK REPORT5
Renton Technical CollegeFigure 11. Graduation rates of full-time, first-time degree/certificateseeking undergraduates within 150% of normal time toprogram completion, by type of aid: 2013 cohortImage description.Type of aidBar chart with 3 groups with 2 items per group.HorizontalXscale titledtitled ScalePercent.YscaleGroupPellinstitutiongrant label.(N 35).Item1,1,Your57. Median 29.Item2,ComparisonGroupGroupStaffordloan(N 30).Item1,2,Yourinstitution80. Median 24.Item2,ComparisonGroupNeitherPellGroupgrantor Stafford loan (N 35).Item 2,1,3,Yourinstitution68. nstitutionLegend,Label: Your institutionShapeComparisonGroupLegend,End of image description. Label: Comparison Group MedianType of aid57Pell grant (N 35)2980Stafford loan (N 30)2468Neither Pell grantor Stafford loan (N 35)370102030405060708090100PercentYour institutionComparison Group MedianNOTE: Graduation rate cohort includes all full-time, first-time degree/certificate-seekingundergraduate students. Data were collected on those students, who at entry of thecohort, were awarded a Pell Grant and students who were awarded a Subsidized Staffordloan, but did not receive a Pell Grant. Graduation rates are the Student Right-to-Knowrates. For more details, see the Methodological Notes. N is the number of institutions inthe comparison group.SOURCE: U.S. Department of Education, National Center for Education Statistics,Integrated Postsecondary Education Data System (IPEDS): Winter 2019-20, GraduationRates component.IPEDS DATA FEEDBACK REPORT6
Renton Technical CollegeFigure 12. Award and enrollment rates of first-time, full-time, degree/certificate-seeking undergraduates after 8 years of entry, by Pell status:2011-12 cohortPell(N 35)Non-Pell(N 35)Image description.Barchart withScale11 groupsXlabel.with 2 items per group.Y 4 years.Item1, GroupReceivedaward6 arisonGroup28.GroupReceivedaward8 arisonGroup31.GroupStillinstitutionenrolledatsame n1.Group5,Enrolledat Groupanotherinstitution.Iteminstitution16. MedianItem 1,2, YourComparisonGroup23.Group. institutionItem1,6,YourNo data.Item2,ComparisonGroupMedianNo data.GroupReceivedaward4 arisonGroup29.GroupReceivedaward6 arisonGroup34.GroupReceivedaward8 on.Item 2,1, ComparisonYour institution0.01.Median ,11,Yourinstitution11. Label: Your institutionShapeComparisonGroupLegend,End of image description. Label: Comparison Group 2316201003634290Received awardin 4 yearsReceived awardin 6 yearsReceived awardin 8 years111Still enrolled atsame institution0Enrolled atanother institutionReceived awardin 4 yearsReceived awardin 6 yearsReceived awardin 8 years1Still enrolled atsame institutionEnrolled atanother institutionCompletion and enrollment measuresYour institutionComparison Group MedianNOTE: Award measures are based on the highest award received after 8 years of entry and enrollment measures are based on students who did not receive an award after 8 years ofentry. Student cohorts (i.e., First-time, full-time; First-time, part-time; Non-first-time, full-time; and Non-first-time, part-time) are degree/certificate-seeking undergraduate students whoentered the institution between July 1, 2011-June 30, 2012. Pell recipients are students with demonstrated financial need. For more details, see the Methodological Notes. N is thenumber of institutions in the comparison group. Medians are not reported for comparison groups with less than three values.SOURCE: U.S. Department of Education, National Center for Education Statistics, Integrated Postsecondary Education Data System (IPEDS): Winter 2019-20, Outcome Measurescomponent.Figure 13. Award and enrollment rates of first-time, part-time, degree/certificate-seeking undergraduates after 8 years of entry, by Pellstatus: 2011-12 cohortPell(N 35)Non-Pell(N 35)Image description.Barchart withScale11 groupsXlabel.with 2 items per group.Y 4 years.Item1, Group2, Receivedaward6 years.Iteminstitution42.inMedianItem 1,2, YourComparisonGroup15.GroupReceivedaward8 arisonGroup17.GroupStillinstitutionenrolledatsame n1.GroupEnrolledat Groupanotherinstitution.Item1,5,Yourinstitution21. MedianItem2,ComparisonGroup21.Group. institutionItem1,6,YourNo data.Item2,ComparisonGroupMedianNo data.GroupReceivedaward4 years.Item p15.GroupReceivedaward6 arisonGroup20.Group9,Receivedawardin 8 years.Item1,Yourinstitution12.Item 2,10,ComparisonGroupMedian21.GroupStillenrolledat sameinstitution.Item1, tion45. MedianItem2,ComparisonGroup29.Completionand enrollment el: Your institutionShapeComparisonGroupLegend,End of image description. Label: Comparison Group 111000Received awardin 4 yearsReceived awardin 6 years21Received awardin 8 years15212012121Still enrolled atsame institution1Enrolled atanother institutionReceived awardin 4 yearsReceived awardin 6 yearsReceived awardin 8 years1Still enrolled atsame institutionEnrolled atanother institutionCompletion and enrollment measuresYour institutionComparison Group MedianNOTE: Award measures are based on the highest award received after 8 years of entry and enrollment measures are based on students who did not receive an award after 8 years ofentry. Student cohorts (i.e., First-time, full-time; First-time, part-time; Non-first-time, full-time; and Non-first-time, part-time) are degree/certificate-seeking undergraduate students whoentered the institution between July 1, 2011-June 30, 2012. Pell recipients are students with demonstrated financial need. For more details, see the Methodological Notes. N is thenumber of institutions in the comparison group. Medians are not reported for comparison groups with less than three values.SOURCE: U.S. Department of Education, National Center for Education Statistics, Integrated Postsecondary Education Data System (I
North Central State College (Mansfield, OH) North Florida College (Madison, FL) . Ohio University-Eastern Campus (Saint Clairsville, OH) Ohio University-Lancaster Campus (Lancaster, OH) Ohio University-Southern Campus (Ironton, OH) Peninsula College (Port Angeles, WA) Potomac State College of West Virginia University (Keyser, WV)