Transcription
ANNualREPORTDecember 31, 2015T. Rowe PriceRPBAXBalanced FundRBAIXBalanced Fund–I ClassThe fund invests in a diversified blend of stocksand bonds.
T. R owe P rice B alanced F undHIGHLIGHTS U.S. stocks posted mixed results in the 12 months ended December 31,2015, while international developed and emerging markets declined. U.S. investment-grade bonds managed slim gains, but high yield debtfell in a challenging operating environment. The Balanced Fund returned -2.12% and 0.65% for the six and12 months ended December 31, 2015, respectively. The fund trailed itscombined index portfolio for the annual period but outpaced its Lipperpeer group index. We have a neutral position in stocks versus bonds. Stock valuationsremain above long-term averages by many measures, but a low-yieldenvironment and expectations of higher U.S. interest rates weighon bonds. Markets are likely to be somewhat choppy in the coming monthsagainst a backdrop of divergent monetary policies and modest globaleconomic growth. However, we believe that a diversified portfolio anda focus on fundamental research can improve our ability to identifyinvestment opportunities on behalf of our shareholders.The views and opinions in this report were current as of December 31, 2015.They are not guarantees of performance or investment results andshould not be taken as investment advice. Investment decisions reflecta variety of factors, and the managers reserve the right to change theirviews about individual stocks, sectors, and the markets at any time.As a result, the views expressed should not be relied upon as a forecast of the fund’s future investment intent. The report is certified underthe Sarbanes-Oxley Act, which requires mutual funds and other publiccompanies to affirm that, to the best of their knowledge, the information in their financial reports is fairly and accurately stated in all materialrespects.REPORTS ON THE WEBSign up for our E-mail Program, and you can begin to receive updatedfund reports and prospectuses online rather than through the mail.Log in to your account at troweprice.com for more information.
T. Rowe Price Balanced FundManager’s LetterFellow ShareholdersLarge-cap U.S. stocks generated modest gains in a volatile 2015, while small- and midcap equities trailed with moderate losses. Investors’ appetite for risk waxed and wanedas optimism about solid domestic economic data and resilient corporate earnings viedfor attention with concerns about slowing global economic growth and uncertaintyabout Federal Reserve monetary policy. International developed markets stocksedged down, and emerging markets stocks recorded sharp losses. U.S. investmentgrade bonds eked out a slim gain, while high yield debt declined as the energy- andmaterials-heavy segment struggled with slumping global commodity prices.PERFORMANCE REVIEWThe Balanced Fund returned -2.12% and 0.65% for the six and12 months ended December 31, 2015. The fund trailed its combinedindex portfolio (a custom benchmark comprising multiple indexes thatrepresent the asset classesin which the fund invests)P erformance C omparisonand Lipper peer groupTotal Returnindex over the six-monthPeriods Ended 12/31/156 Months12 Monthsperiod. For the 12-monthBalanced Fund-2.12%0.65%period, the fund’s performance narrowly lagged itsMorningstar Moderatecombined index portfolioTarget Risk Index-2.91-1.79and outperformed itsCombined Index Portfolio*-0.740.99Lipper peer group index.Lipper Balanced Funds Index-1.75-0.42Strategic allocations todiversifying asset classesnot included in the fund’sbroad market benchmarksweighed on 12-month results versus the fund’s combined indexportfolio. The inclusion of real assets equities was a particularly notabledetractor as unfavorable long-term supply/demand dynamics, slowing* Please see the Glossary at the end of this report fordefinitions of the benchmarks.1
global growth, and a strong U.S. dollar continued to undermine globalenergy and commodities stocks. This was mitigated somewhat by ourexposure to real estate investment trusts (REITs), which benefitedfrom improving fundamentals, including a favorable interest rateenvironment and solid demand. Weak global commodities prices alsohad a negative impact on the high yield debt market, of which energyand materials-related issuers compose a significant percentage.Tactical decisions to overweight and underweight underlying sectorsslightly detracted from the fund’s relative performance. An overweightallocation to international equities, which generally trailed the broaderU.S. equities market, had a negative impact on fund results. Thiswas partially offset by a positive effect resulting from an underweightallocation to real assets equities as energy- and commodity-relatedstocks significantly trailed the broader market.Security selection in the underlying portfolios helped overallperformance versus the combined index portfolio for the 12-monthreporting period. Our portfolio of domestic large-cap growth stockswas particularly beneficial to results versus the benchmark, and ourU.S. large-cap core and large-cap value portfolios also helped. Thepositive impact from our domestic equities was more than enough tooffset weakness in our international equity portfolio. Security selectionin our underlying fixed income portfolios had little net impact on thefund’s results.MARKET ENVIRONMENTMajor U.S. stock indexes generated mixed returns in an up-and-down12-month reporting period. U.S. large-cap stocks generated a modestoverall gain in 2015, while mid- and small-cap shares trailed withmoderate losses. As measured by various Russell indexes, growthstocks outpaced value across all market capitalizations. The U.S. dollarstrengthened significantly versus most other currencies against a backdrop of relatively strong U.S. economic growth and the divergencebetween normalizing monetary policies in the U.S. and aggressivestimulus measures in Europe, Japan, and elsewhere.Equities benefited from steady economic and employment growth andgenerally favorable earnings outside the energy and materials sectors,which continued to be punished by oversupply contributing to lowprices. Aggressive monetary stimulus measures in Europe and Japan2
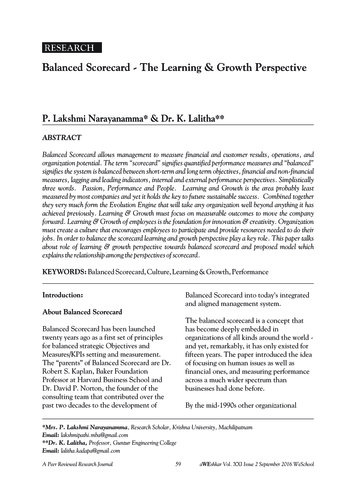
were also supportive. Stocks tumbled in the summer months due toconcerns about a sharper-than-expected economic slowdown and asurprising currency devaluation in China. Uncertainty about the timingand pace of Federal Reserve interest rate hikes also weighed intermittently on financial markets throughout the period until Decemberwhen the Fed raised its interest rate target from the 0% to 0.25% rangeto the 0.25% to 0.50% range—its first rate hike in nine years. The Fednoted that the “stance of monetary policy remains accommodative”and that it expects “only gradual increases in the federal funds rate,”with rate changes depending “on the economic outlook as informed byincoming data.”4.0%3.53.02.52.01.51.00.50.0Outside the U.S., European stocks declined for the period. Aquantitative easing program by the European Central Bank (ECB)helped European exporters by weakening the euro and improvingexport competitiveness. An improved credit environment and lowenergy costs were also beneficial. Stocks gave back their gains later inthe period amid renewed concerns about Greece’s debt and the fractiousrelationships between eurozone members, as well as worries about thepotential for slowing global growth to weigh on European exporters.Late in the period, concerns about immigration and a disappointinglysmall extension of the ECB’s quantitative easing program further rattledinvestor confidence. Strong fourth-quarter gains helped to lift Japaneseequities into solidlyI nterest R ate L evelspositive territory for 2015.Although inflation remains10-Year Treasury Notestubbornly low, Japan’s5-Year Treasury Noteeconomy showed signs of90-Day Treasury Billimprovement in industrialoutput and retail sales,supported by aggressivefiscal and monetarystimulus policies.Improved corporategovernance and a pensionreallocation favoringequities also helped3/1512/31/1412/31/156/159/15stocks. Emerging marketsSource: Federal Reserve Board.stocks fell sharply, withvirtually all countries in negative territory. A number of factors weighedon emerging markets equities, including persistently weak commodityprices, a stronger U.S. dollar, expectations for rising U.S. interest rates,and slowing global economic growth, particularly in China.3
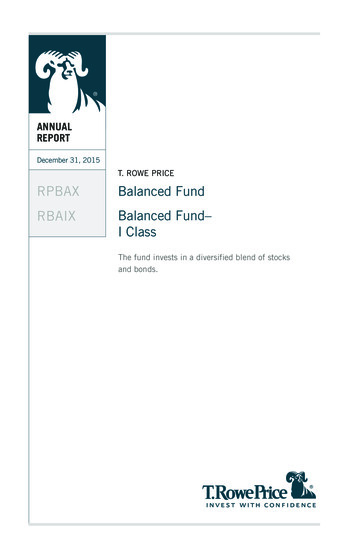
Most investment-grade U.S. bond segments were modestly positivefor the 12-month period. Global growth concerns and uncertaintyregarding the timing of Fed rate hikes led to considerable volatility inU.S. Treasuries. Treasury yields climbed for the year, especially shortterm yields, which weighed on returns. Investment-grade corporatebonds recorded modest losses amid heavy new issuance as companiesfinanced mergers or otherwise took advantage of low interest rates.High yield bonds declined and significantly lagged investment-gradedebt as falling oil and commodity prices weighed on energy and metalsand mining issuers.ASSET ALLOCATION STRATEGYThe Balanced Fund seeks to provide capital growth and current incomeby investing in a combination of U.S. and international stocks anddomestic fixed income securities. Our target allocations are currently65% in stocks and theremaining 35% in bondsS ecurity D iversificationand cash—unchangedHigh YieldCommercialfrom our semiannualBondsMortgage3%Backed Bondsreport six months ago.MortgageBackedSecurities9%Treasury andAgencyBonds9%CorporateBonds10%2%We have a neutralposition in stocksrelative to bonds. DespiteDomesticrecent volatility, equityStocksvaluations are above42%historical averages byInternationalseveral measures, withStocks23%limited support fromBased on net assets as of 12/31/15.earnings growth. At thesame time, underlyingcorporate fundamentals remain solid, and improving economic growthshould support equities. We expect modest returns from bonds as thecurrent low-yield environment offers a weak foundation and risinginterest rates are likely to weigh on most bond sectors as the Fedadvances with normalizing its interest rate policy. However, the impactof higher interest rates should be softened by the Fed’s expected gradualapproach to rate increases against a backdrop of modest economicgrowth. Additionally, demand for U.S. bonds should be supportedby their yield advantage relative to investment-grade opportunities inother developed markets. International central banks’ monetary policiesremain broadly accommodative, helping to moderate downside risksto bonds.4Other andReserves2%
StocksWe are overweight international equities versus domestic stocks basedon the former’s potential for stronger earnings and margin growth andmodestly more attractive valuations. While economic cycles in Europeand Japan are less advanced than in the U.S., they are supported byaggressive monetary stimulus and relative weaker currencies thatshould improve their export competitiveness. Attractiveness varies bycountry and region, however. European earnings, in particular, haveroom to grow if the region’s economy continues to recover.We are overweight global equities relative to real assets equities.Global prices for energy and commodities have fallen considerablyas improved extraction technologies and increased production haveraised supplies while slower global economic growth has dampeneddemand growth. While energy producers have sought to curboversupply by reducing rig counts, evidence suggests that gains inproductivity are helping offset declining supply as some companies arenow able to profit at lower energy prices. Production outside the U.S.has exacerbated global oversupply concerns as major energy-producingcountries have sought to defend market share at the expense of lowerprices. Demand for industrial metals is expected to remain subduedas China continues to shift its economy away from its dependence onindustrial production and exports to a more sustainable model drivenby domestic consumption. Fundamentals are more attractive for U.S.and other major developed market real estate stocks in light of themodestly supportive economic environment, limited new supply, andlower energy prices. Real estate stocks’ valuations are modestly abovethe broader equities market, and they remain sensitive to rising interestrates. However, expectations of a slow pace for the Fed’s interest ratepolicy normalization mitigates interest rate risk.Among domestic equities, we trimmed our modest overweight toU.S. growth stocks to a neutral position versus U.S. value. Whilebroad valuation measures continue to favor growth stocks, certaingrowth-oriented sectors, including health care and informationtechnology, have become expensive. Value stocks have higher exposureto cyclical sectors such as financials and energy, which tend to relyon stronger economic growth and commodity demand to outperform.Higher interest rates may support financials, although low globaleconomic growth remains a headwind to commodity and othercyclical sectors.5
BondsB ond P ortfolio P rofilePeriods Ended6/30/1512/31/15Weighted Average EffectiveDuration (years)5.45.5Weighted AverageMaturity (years)7.27.625.7%25.4%Quality Diversification*U.S. GovernmentAgencies**U.S. 18.120.1BB and Below13.210.6Not RatedTotal0.20.2100.0%100.0%Based on net assets as of 12/31/15.* Sources: Moody’s Investors Service; if Moody’s doesnot rate a security, then Standard & Poor’s (S&P)is used as a secondary source. When available,T. Rowe Price will use Fitch for securities that arenot rated by Moody’s or S&P. T. Rowe Price does notevaluate these ratings but simply assigns themto the appropriate credit quality category asdetermined by the rating agency.** U.S. government agency securities are issued orguaranteed by a U.S. government agency, and mayinclude conventional pass-through securities andcollateralized mortgage obligations; unlikeTreasuries, government agency securities are notissued directly by the U.S. government and aregenerally unrated but may have credit support fromthe U.S. Treasury (e.g., FHLMC and FNMA issues) ora direct government guarantee (e.g., GNMA issues).Therefore, this category may include rated andunrated securities.*** U.S. Treasury securities are issued by the U.S.Treasury and are backed by the full faith and creditof the U.S. government. The ratings of U.S. Treasurysecurities are derived from the ratings on theU.S. government.6In our fixed incomeallocation, we movedfrom an overweightposition in high yieldbonds to a modestunderweight versus U.S.investment-grade debt.Continued weakness incommodity prices hascontributed to widercredit spreads in theenergy and materialssegments, which composea significant proportion ofthe high yield universe,with risks amplified bypoor liquidity conditionsin the high yield market.Further pressure islikely as default rates areexpected to rise in 2016,albeit from historically lowlevels. An advanced creditcycle and uncertaintiesabout global economicgrowth and U.S. monetarypolicy also favor U.S.investment-grade debt.PORTFOLIO REVIEWStocksAmong the fund’s domestic equity exposure, ourlarge-cap growth portfoliodelivered the strongestabsolute returns andsignificantly outperformedits underlying benchmarkfor the 12-month period.
This portfolio was led by strong returns in the consumer discretionarysector that accounted for a substantial portion of our equity gains forthe year. Amazon.com was the portfolio’s top contributor. Thirdparty sales and Amazon Web Services (AWS), which provides cloudprocessing services for other companies, generated above-average profitmargins for the company. The company also provided greater disclosure for AWS, demonstrating that this business is far more profitablethan many had expected. Netflix was also a top contributor. Thecompany continued to grow its domestic and international subscriberbase at a rapid pace. The company’s strategy of providing more originalcontent appears to be driving new subscriber growth while alsolimiting subscriber turnover. Coffee purveyor Starbucks, Alphabet(the new parent company of Google), social networking site Facebook,and global software giant Microsoft were also major contributors.Our domestic financials stocks generally weighed on results for theperiod. Capital markets firms Ameriprise Financial, State Street, andMorgan Stanley were significant detractors. Energy shares were also adrag on the fund’s overall performance, with ExxonMobil and PioneerNatural Resources among our weaker contributors. (Please refer to theportfolio of investments for a complete list of holdings and the amounteach represents in the portfolio.)Our international stock portfolio declined for the annual reportingperiod. Not surprisingly, our energy, materials, and utilities stockswere among the biggest detractors in a global market characterized byoversupply and tepid demand growth. Oil exploration and productioncompanies Royal Dutch Shell (UK/Netherlands) and Statoil (Norway),metals and mining firms BHP Billiton (UK/Australia) and Rio Tinto(UK), and multi-utilities Engie (France) and E.ON (Germany) alldetracted from the fund’s performance. Consumer staples stocks wereamong the bright spots in our international portfolio. Multinationalconsumer goods companies Unilever (UK/Netherlands) and Nestlé(Switzerland) were two of our stronger contributors. Both companiesbenefited from moderate but resilient volume and earnings growth.BondsOur U.S. investment-grade bond portfolio managed a modest gain forthe 12-month period. Yields rose in advance of the Fed’s December2015 rate increase. Yield increases were more pronounced amongshorter-term Treasuries while yields on longer-term Treasuriesclimbed more moderately, resulting in a flatter Treasury yieldcurve. Investment-grade corporate bonds produced modest losses,with investors exhibiting a clear preference for debt with highercredit ratings.7
Our high yield bond portfolio declined for the year but outpacedits style-specific benchmark, which ended the year down more than4%—one of only four calendar year losses over the prior two-anda-half decades in the asset class. The decelerating Chinese economyraised concerns about global growth, leading to renewed declinesin commodity prices. Compounding volatility, idiosyncratic risksincreased across specific issuers and industries, and market participants had low tolerance for companies that missed earnings forecastsor faced ratings downgrades. Against this backdrop, a longstandingunderweight to the energy sector helped results, as did an emphasis onhigher-quality issuers.OUTLOOKWe expect global economic growth to be mixed, with gradualimprovements in developed markets and slowing growth in majoremerging markets. The U.S. economy grew at a 2% annualized pacein the third quarter, supported by resilient consumer spending, whileweaker global growth and a stronger dollar weighed on businessinventory spending and exports. Inflation remains below the Fed’s2% target, hindered by a stronger U.S. dollar and low energy prices.Evidence suggests, however, that wages are beginning to inflect higherfrom trough levels as the labor market has improved. On the corporatefront, healthy balance sheets and cash flows outside of energy-relatedsegments grant companies a measure of flexibility to increase capitalspending, engage in mergers and acquisitions, and return capital toshareholders through dividend increases and share repurchases.European economic growth slowed in the third quarter to itsweakest pace of the year. Despite this, Europe’s economy continuesto find support in diminished fiscal headwinds, an improvingcredit environment, lower energy costs, quantitative easing by theECB, and a weaker euro. Remaining risks include lingering structural issues, elevated unemployment, high debt, and politicaluncertainty in several countries. After seesawing between expansionand contraction, Japanese growth moved back into positive territory in the third quarter of 2015. The Bank of Japan continued itsquantitative easing program, but the results have been somewhatuneven. Wage growth has been moderate, but consumer spendinghas stagnated since the consumption tax was increased in 2014.The uncertain economic outlook has delayed business spending,and export volumes may decline because of the slowdown in China.8
Meanwhile, challenging structural issues remain, including an agingpopulation, a high government debt-to-gross domestic product ratioand cultural obstacles.Fiscal and monetary conditions continue to diverge among emergingmarkets. Slowing growth in China has hurt global trade, weighed oncommodity prices, and punished commodity-producing economiessuch as Brazil. Broad increases in credit growth over the last decadehas left numerous corporations unprepared for a sustained drop incommodity prices. On the other hand, developing countries that havemade progress on reforms, such as India and Mexico, are showingsigns of improvement, and many consumer-oriented economiesshould benefit from low commodity prices. Additionally, weakerlocal currencies should support export-focused companies in manyemerging markets. China’s transition to a consumer-driven economyremains a work in progress. Acknowledging the need for slower,more sustainable growth, policymakers reset their economic growthtarget to 6.5% over the next five years. Downside risks include significant excess capacity in many industries and high corporate leverage.The central government remains committed to policy interventionmeasures to sustain growth and market stability, as seen with recentactions to devalue the yuan and aggressive measures to stave off stockmarket declines.Markets are likely to be somewhat choppy in the coming monthsagainst a backdrop of divergent monetary policies and modest globaleconomic growth. Currency volatility and persistent geopoliticalconcerns pose additional risks. However, we believe that broaddiversification and a careful focus on fundamental research can improveour ability to identify compelling investment opportunities on behalfof our shareholders.Respectfully submitted,Charles M. ShriverChairman of the fund’s Investment Advisory CommitteeJanuary 28, 2016The committee chairman has day-to-day responsibility for managing theportfolio and works with committee members in developing and executingthe fund’s investment program.9
T. Rowe Price Balanced FundR isks of I nvesting in S tocksAs with all stock mutual funds, the fund’s share price can fall because of weakness in thestock market, a particular industry, or specific holdings. Stock markets can decline formany reasons, including adverse political or economic developments, changes in investorpsychology, or heavy institutional selling. The prospects for an industry or company maydeteriorate because of a variety of factors, including disappointing earnings or changesin the competitive environment. In addition, the investment manager’s assessment ofcompanies held in a fund may prove incorrect, resulting in losses or poor performanceeven in rising markets.R isks of I nternational I nvestingFunds that invest overseas generally carry more risk than funds that invest strictly inU.S. assets. Risks can result from varying stages of economic and political development;differing regulatory environments, trading days, and accounting standards; currencyfluctuations; and higher transaction costs of non-U.S. markets. Investments outsidethe United States could be subject to governmental actions such as capital or currencycontrols, nationalization of a company or industry, expropriation of assets, or impositionof high taxes.R isks of I nvesting in B ondsFunds that invest in bonds are subject to interest rate risk, the decline in bond pricesthat usually accompanies a rise in interest rates. Longer-maturity bonds typically declinemore than those with shorter maturities. Funds that invest in bonds are also subject tocredit risk, the chance that any fund holding could have its credit rating downgradedor that a bond issuer will default (fail to make timely payments of interest or principal),potentially reducing the fund’s income level and share price.G lossaryBarclays U.S. Aggregate Bond Index: An unmanaged index that tracks domesticinvestment-grade bonds, including corporate, government, and mortgagebacked securities.Combined index portfolio: An unmanaged portfolio of 52% domestic stocks (S&P 500Index), 35% bonds (Barclays U.S. Aggregate Bond Index), and 13% international stocks(MSCI EAFE Index).Lipper indexes: Fund benchmarks that consist of a small number (10 to 30) of thelargest mutual funds in a particular category as tracked by Lipper Inc.Merrill Lynch-Wilshire Capital Market Index: A market capitalization-weighted indexincluding the Wilshire 5000, Merrill Lynch High Yield II, and Domestic Master Indexes.This index was discontinued on June 30, 2009.10
T. Rowe Price Balanced FundG lossary ( continued )Morningstar Moderate Target Risk Index: Represents a portfolio of global equities(fixed at 60%), bonds, and other asset classes.MSCI EAFE Index: An index that measures equity market performance of developedcountries in the Europe, Australasia, and Far East regions.Real estate investment trusts (REITs): Publicly traded companies that own, develop, andoperate apartment complexes, hotels, office buildings, and other commercial properties.S&P 500 Index: An unmanaged index that tracks the stocks of 500 primarily large-capU.S. companies.Note: MSCI makes no express or implied warranties or representations and shall have noliability whatsoever with respect to any MSCI data contained herein. The MSCI data may notbe further redistributed or used as a basis for other indices or any securities or financialproducts. This report is not approved, reviewed, or produced by MSCI.11
T. Rowe Price Balanced FundP ortfolio H ighlightsLARGEST HOLDINGSPercent ofNet Assets12/31/15StocksT. Rowe Price Real Assets 0.70.610.4%Bonds (Largest Issuers)U.S. TreasuriesFederal National MortgageAssociation – MortgagesT. Rowe Price InstitutionalHigh Yield FundGovernment NationalMortgage AssociationFederal Home Loan MortgageCorporation – MortgagesBank of AmericaJPMorgan ChaseGoldman SachsT. Rowe Price U.S. BondEnhanced Index FundFREMFTotalPercent ofNet Note: The information shown does not reflect any exchange-traded funds (ETFs), cashreserves, or collateral for securities lending that may be held in the portfolio.12
T. Rowe Price Balanced FundPerformance and ExpensesG rowth of 10,000This chart shows the value of a hypothetical 10,000 investment in the fund over the past10 fiscal year periods or since inception (for funds lacking 10-year records). The result iscompared with benchmarks, which may include a broad-based market index and a peergroup average or index. Market indexes do not include expenses, which are deducted fromfund returns as well as mutual fund averages and indexes.BALANCED FUNDAs of 12/31/15 20,000Balanced Fund 18,41418,000Morningstar Moderate Target Risk Index 17,332Linked Performance Benchmark* 12/0912/1012/1112/1212/1312/1412/15Note: Performance for the I Class will vary due to its differing fee structure.*The linked performance benchmark reflects the performance of the Merrill Lynch-WilshireCapital Market Index through 6/30/09 and the performance of the Morningstar ModerateTarget Risk Index from 7/1/09 through the end of the period.A verage A nnual C ompound T otal R eturnPeriods Ended 12/31/151 Year5 Years10 YearsBalanced Fund0.65%7.90%6.30%Current performance may be higher or lower than the quoted past performance, whichcannot guarantee future results. Share price, principal value, and return will vary, andyou may have a gain or loss when you sell your shares. For the most recent month-endperformance, please visit our website (troweprice.com) or contact a T. Rowe Pricerepresentative at 1-800-225-5132, or for I Class shares, 1-800-638-8790.This table shows how the fund would have performed each year if its actual (or cumulative)returns for the periods shown had been earned at a constant rate. Average annual totalreturn figures include changes in principal value, reinvested dividends, and capitalgain distributions. Returns do not reflect taxes that the shareholder may pay on funddistributions or the redemption of fund shares. When assessing performance, investorsshould consider both short- and long-term returns.13
T. Rowe Price Balanced FundE xpense R atioBalanced Fund0.68%Balanced Fund–I Class0.50The expense ratio shown is as of the fund’s fiscal year ended 12/31/14. The expenseratio for the Balanced Fund–I Class is estimated as of the class’s inception date of12/17/15. This number may vary from the expense ratio shown elsewhere in this reportbecause it is based on a different time period and, if applicable, includes acquired fundfees and expenses but does not include fee or expense waivers.F und E xpense E xampleAs a mutual fund shareholder, you may incur two types of costs: (1) transaction costs,such as redemption fees or sales loads, and (2) ongoing costs, including management fees,distribution and service (12b-1) fees, and other fund expenses. The following example isintended to help you understand your ongoing costs (in dollars) of investing in the fundand to compare these costs with the ongoing costs of investing in other mutual funds. Theexample is based on an investment of 1,000 invested at the beginning of the most recentsix-month period and held for the entire period.Please note that the fund has two share classes: The original share class (Investor Class)charges no distribution and service (12b-1) fee, and the I Class shares are also available toi
RPBAX RBAIX Balanced Fund Balanced Fund- I Class ANNuAl REPORT December 31, 2015 T. Rowe PRICe The fund invests in a diversified blend of stocks and bonds. Proof #5 REPORTS ON THE WEB . Morningstar Moderate Target Risk Index -2.91 -1.79 Combined Index Portfolio* -0.74 0.99