Transcription
P r ac ti c a l Gu i d e t o L e a d in g I n d ic a t o r s :M et r i c s , C a s e St u die s & St r a t e gie s
Executive summaryThis report describes the second phase of a research project conducted by the Campbell Instituteto advance the state of knowledge and practice regarding the use of leading indicators to improveenvironmental, health and safety (EHS) performance. The first phase of the project established a broadconsensus among EHS leaders at Institute member organizations that sole focus on lagging metricsis not as effective in promoting continuous improvement as using leading indicators to anticipateand prevent injuries and incidents. Additionally, an expert panel of EHS professionals describeda set of successful leading indicator characteristics, including being actionable and timely.The specific aims of the project’s second phase were to:f Collect a list of key leading indicators andmetrics to use as a basis for benchmarking;f Create definitions for each key leading indicator; andf Qualitatively describe how certain leading indicators areanalyzed and put into practice through short case studies.These research aims were addressed through a series of group discussions and phone interviewswith member companies. An initial meeting of industry experts was held to generate a list of leadingindicators in each of three categories (systems-, organizations-, and behavior-based indicators). Theselists were then discussed separately in three working groups with each group creating definitions andadding specific metrics for the key leading indicators on the list. The work from all three groups wascombined to produce one matrix of key leading indicators, their definitions and associated metrics. Toprovide more context to certain leading indicators, Campbell members contributed narratives detailingthe development, implementation and analysis of a leading indicator within their organization.Table ofcontentsWhile a “full set” of leading indicators and metrics is impossible for the Campbell Institute tocreate due to the changing nature of workplace practices and ever-expanding knowledge of safetyscience, the matrix offered in this report represents a collaborative benchmarking effort on thepart of Institute member organizations to generate a catalog of key or critical leading indicators.The matrix can be used as a guide for companies on their Journey to Safety Excellence, and tohelp Campbell Institute organizations maintain their world-class status. Additionally, this paperand the information it contains can be used to not only convince senior executive management ofleading indicators’ importance and predictive power, but also demonstrate through key exampleshow particular leading indicators have produced positive outcomes in occupational safety.ExecutiveSummary .2Introduction .2Methods .4Matrix . 6CaseStudies .10Summaryand FutureDirections . 15Appendix.16Works Cited . 222VISITSafety work is today recognized as an economicnecessity, and one of the more constructivemovements that has ever come into our nationallife. It is the study of the right way to do things.R O B E R T W. C A M P B E L Lthecampbellinstitute.org CALL(630) 775-2283 EMAIL1914campbellinstitute@nsc.org
IntroductionIn the first phase of its research on leading indicators (see Campbell Institute white paper,Transforming EHS Performance Measurement through Leading Indicators), the Campbell Institutepresented a definition of leading indicators as developed by an expert panel of environmental,health, and safety (EHS) executives and described key characteristics of successful leading indicators.A survey of EHS executives in Campbell Institute member organizations identified several keyenablers of effective leading indicator implementation and use, including C-suite endorsementof leading indicators and thorough communication of leading indicators’ predictive value.Survey results also identified several common barriers to leading indicator implementation, includingdifficulty in developing consistently actionable leading indicators, lack of a reliable relationship betweenleading and lagging indicators, and sporadic non-standardized benchmarking of leading indicators.This second phase of research on leading indicators seeks to address some of these barriers througha collaborative benchmarking project and informative case studies of successful leading indicatorimplementation from Campbell Institute members and partners. Specifically, Campbell members workedtogether to produce a list of leading indicators, their definitions and specific metrics for each indicator.As high-performing organizations, Campbell Institute members rely on benchmarking to maintainand improve their safety performance records. In the first survey, Campbell members expresseda desire for more formal benchmarking opportunities due to the acknowledged importance andbenefits of benchmarking. Those who benchmark place themselves in better positions to identifybest practices, discover innovative improvements, learn from peers and competitors, and find betterperformance measurement tools (Camp, 1995; Watson, 1993). The Institute set out to understandthe best benchmarking approach to most effectively meet member needs and found several typesand approaches to benchmarking as identified by researchers in the past twenty years.Internal benchmarking usually refers to comparison within an organization, between branches ordepartments, and allows for an exchange of ideas and practices without the threat of competition (Moriarty& Smallman, 2009; Zairi, 1994). Competitive benchmarking, conversely, takes place when an organizationidentifies performance gaps in comparison to its direct competitors and seeks to adopt competitorpractices to gain market share. This type of benchmarking has been used in research on small- andmedium-sized enterprises in the U.S. and abroad (Min & Min, 2013; Min, 2010; Wang & Hong, 2011).Strategic benchmarking can be similar to competitive benchmarking in that an organization looks torivals for best practices, but instead of comparing individual procedures, they benchmark strategicinitiatives, management of change practices, and other broader, long-term processes (Bogan & English,1994; Schmidt, 1992). This type of benchmarking has been used recently to improve functionality ofwebsites (Stepchenkova et al., 2010), increase the impact of schools (Green & Davis, 2010), and reduceinjury rates among global enterprises (Wynn, 2008). In a study focused on the reduction of incidencerate through benchmarking, researchers found that setting aggressive targets for EHS performance,holding business managers accountable for progress and providing targeted assistance to strugglingsites resulted in an average reduction of incidence rates by 77% within 3-12 years (Wynn, 2008).Collaborative or consortium benchmarking refers to an exchange of information among a consortiumof organizations and most commonly involves academics and practitioners working together as coresearchers. Because consortium benchmarking “is a team-based approach focusing on best practices,relevant discussions between academics and practitioners are likely to emerge and flourish” (Schiele &Krummaker, 2011:1137-1138). This benchmarking approach has been useful in helping to monitor theprogress of students (McAllister et al., 2011) and developing curriculum enhancements (Oliver et al., 2011).Practical guide to leading indicators: Metrics, case studies & strategies 3
After this review of benchmarking types, it appeared that the strategic or collaborative benchmarkingapproaches were most appropriate for a comparison of leading indicator practices among Campbell Instituteorganizations given the focus on long-term strategies and the team-based approach between practitionersand researchers. While there is no single set of steps for benchmarking, many of the proposed processeshave four basic steps (Camp, 1989; Karlof & Ostblam, 1993; Moriarty, 2009; Schiele & Krummaker, 2011):1. Planning: identifying the process or function to be benchmarked, identifying benchmarking partners2. Analysis: collection of data and analysis of performance gaps3. Action: communicating findings, setting targets, implementing specific actions4. Review: evaluation of benefits, monitoring of improvementsThe current phase of this project on leading indicators covers the steps of planning, analysis, andcommunication of findings. Subsequent phases of this project will most likely track the benchmarkingprocess through the final review and evaluation stages. The outcome for this phase of the project is a matrixof leading indicators, their definitions, and specific metrics for each indicator. This matrix represents acollaborative effort of EHS professionals in top-performing organizations. The information it presentsshould be relevant not only to those organizations seeking to initiate implementation of leading indicators,but also to more seasoned companies looking for better practices and innovative improvement.MethodsDefining Leading IndicatorsThe first phase of this research project began with a convening of an expert panel of fifteenEHS professionals. In this moderated discussion, panel members defined leading indicators asproactive, preventive, and predictive measures that monitor and provide current informationabout the effective performance, activities and processes of an EHS management system that drivethe identification and elimination or control of risks in the workplace that can lead to incidentsand injuries. Leading indicators measure the events leading up to injuries and fatalities, andalso provide information about the current state of an organization’s safety management system.Specifically, leading indicators are designed to give advanced warning of potential problemsso that preventive actions can be taken. Additionally, they help to reveal weaknesses in anorganization’s procedures or employee behavior before they have a chance to cause real harm.Being proactive, preventive and predictive is only beneficial if the leading indicator providestimely information that can be effectively turned into action. Given the time-sensitive nature ofconditions that could lead to injuries or fatalities, it is important for leading indicators to activelymonitor the state of the safety management system and provide detailed information that can bequickly acted upon. For these reasons, the expert panel also described successful leading indicatorsas actionable, achievable, meaningful, transparent, easy to communicate, valid, useful and timely.Additionally, the expert panel created three broad categories to classify leading indicators:f Operations-based leading indicators: Indicators that are relevant to the functioning ofan organization’s infrastructure (e.g. machinery, operations); potentially site-specificf Systems-based leading indicators: Indicators that relate more to the management of an EHSsystem; can be rolled up from a facility level to a region/business unit or corporate levelf Behavior-based leading indicators: Indicators that measure the behavior or actionsof individuals or groups in the workplace; people-to-people interactions related tosupervision and management; useful at site-specific level through management level4VISITthecampbellinstitute.org CALL(630) 775-2283 EMAILcampbellinstitute@nsc.org
The Institute then conducted a survey of its members and Campbell Award winners, askingquestions about the use of leading indicators in their organizations, the key enablers of leadingindicator implementation and the most significant hurdles to incorporating leading indicators.For more details and information of this phase of the study, please see the previous CampbellInstitute white paper, Transforming EHS Performance Measurement through Leading Indicators.Identifying Leading IndicatorsThe second phase of this research project addressed one of the major noted barriers to leadingindicator implementation, which was the lack of standardized best practices or benchmarks.The Institute held a facilitated Leading Indicators Workgroup meeting in October 2013to generate a list of possible leading indicators to benchmark. Fifteen EHS executives andprofessionals representing various Campbell Institute member organizations formed threeteams to create lists of leading indicators for each of the three types of leading indicators.Each team was initially assigned a category to start, and then rotated two times allowingeach team to contribute to all three lists. Meeting participants were asked to indicate whichindicators they considered the most important. Each participant was allotted ten checkmarksthat they could distribute across all three lists to give weight to the indicators they perceivedas most significant. (See Appendix for full lists and rankings of these indicators.)After this in-person, facilitated meeting, the Leading Indicators Workgroup divided into the subgroups:systems-, operations-, and behavior-based. Through a series of conference calls and web-based workmeetings, each subgroup discussed the top-ranked indicators of each list, generating definitionsand listing various metrics for each indicator. These metrics could be ones that are currently beingmeasured at their organizations or ones that they would consider measuring in the future. Throughtheir discussions, the subgroups revised the names of leading indicators, split some indicators intodifferent component parts, and/or added more indicators to the original list provided to them.The three separate matrices of leading indicator definitions and metrics were combined intoone full matrix of leading indicators. Because some indicators were considered and discussedin more than one subgroup category (systems- and operations-based, for example), the entirereconvened Workgroup together created a single comprehensive definition incorporating allsubgroup ideas. Members of the Leading Indicators Workgroup provided final edits and additionsto the full matrix via phone conferences, email and at an in-person meeting in April 2014.To provide some context for the use of certain leading indicators, the Campbell Institute staff conductedqualitative interviews with Campbell members and partners who were willing to share informationon their uses of particular leading indicators – how they implemented them, what they did with theinformation from those indicators, the outcomes of implementation and the connection to laggingindicators. These interviews took place via phone and were between 30 and 60 minutes long. The interviewswere then transcribed and are included in this report in narrative form. These short case studies aremeant to provide more detail and background on various leading indicators listed in the full matrix.Practical guide to leading indicators: Metrics, case studies & strategies 5
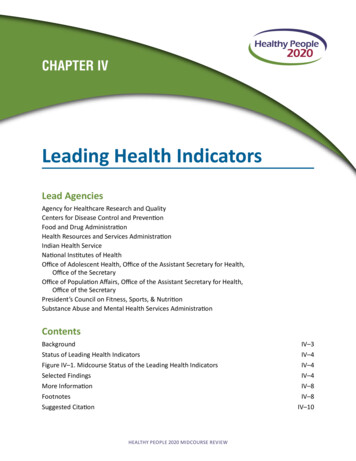
MatrixThis matrix presents leading indicators that Campbell Institute members have collectivelydetermined to be “best performing” through their various safety management programs. Thisdoes not imply that all of these indicators are measured and tracked at every Campbell Instituteorganization. Every leading indicator program is unique and tailored for a specific organization.The leading indicator matrix is not designed to be a reference, nor a consulting tool. The CampbellInstitute does not guarantee or recommend using any specific indicator or metric included here.These pages provide more detailed information regarding certain leading indicatorsbased on the relative weight of their discussion among Campbell Institutemembers. A full matrix is available at the end of this document.Leadingindicatorsby typeOPERATIONS-BASEDOInIndicatorsthat are relevant to the functioning ofan organization’s infrastructure (e.g. machinery,opoperations); potentially site-specific.SYSTEMS-BASEDSIIndicatorsnthat relate more to the managementof an EHS system; can be rolled up from a facilitylevel to a region/business unit or corporate level.levBEHAVIOR-BASEDBSee thecomplete listof LeadingIndicators andFull Matrix onpages 14–19.6VISITthecampbellinstitute.org CALL(630) 775-2283 InIndicatorsthat measure the behavior or actionsoff individuals or groups in the workplace; peopleoto-people interactions related to supervision andtomanagement; useful at site-specific level throughmmanagement level.mEMAILcampbellinstitute@nsc.org
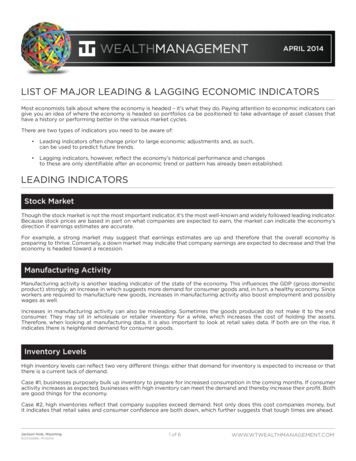
ComplianceRisk assessmentPreventive and corrective actionsEquipment and preventive maintenancePrevention through designTrainingManagement of change processHazard identification and recognitionLeading indicator component evaluationLearning systemPermit-to-work systemSafety perception surveyCommunication of safetyRecognition, disciplinary and reinforcement systemHazard analysisEHS system component evaluationRisk assessmentPreventive and corrective actionsLeadership engagementEmployee engagement and participationAt-risk behaviors and safe behaviorsArea observations and walkaroundsOff-the-job safetyPractical guide to leading indicators: Metrics, case studies & strategies 7
Case studiesCumminsLeading indicator: Training hoursLeading indicators are a process; there is no perfect mix.Four years ago when Cummins was seeking to launch a leading indicator program, management soonrealized that doing so would not be a quick or easy process. They asked themselves several questions:Which indicators would be most likely to reduce injuries? Which indicators would motivate desiredbehaviors? How can the organization contribute to that motivation? After much discussion anddebate, they eventually chose a few indicators as a starting point, one of which was training hours.With twelve months of data in hand, Cummins calculated a simple correlation coefficient foreach leading indicator; for training this included the number of training hours against theincidence rate for that same time period. They found a very strong negative correlation (r -.86)indicating that an increase in training hours was associated with a decline in the incidence rate.This correlation remained strong at the corporate level as well as within the business units.Cummins was not satisfied, however, with merely identifying training hours as a strong predictorof its incidence rate. They took the next step and set aggressive targets for training to ensure thatthis indicator remained a priority at each business unit and site. The strength of this correlation alsoprompted leaders to further investigate why training had such a large impact on the incidence rate. Adeeper inquiry revealed that the incidence rate was primarily being influenced by specific training inrisk assessment and job safety analysis. The Engine Business Unit (EBU) in particular has a programcalled Find It Fix It which trains employees to identify and mitigate hazards. Not coincidentally, theEBU showed one of the highest correlations between number of training hours and incidence rate.Michelle Garner-Janna, director of Corporate Health and Safety at Cummins, notes that having a short list ofleading indicators to be implemented at the corporate, business unit and site level is helpful for comparisonpurposes, but not all areas have the same needs or encounter the same challenges from month to month.“You identify custom leading indicators for each site. We encourage the Business Units and sites todo the same correlation analysis to understand what is working, what is not working and adjust Every six months, we take a look to see which of our indicators are the most effective and assess whatwe need to do to continue and improve visibility. Once a year, we update our indicators. If somethingis not working, we consider dropping it and identifying a new indicator that might be more effective.”Garner-Janna also mentioned the important lesson that Cummins took away from thelaunch of its leading indicator program – there is no holy grail of leading indicators.“It’s a process that is evergreen. For us, there is no such thing as a perfect leading indicator.At some time, there may be a saturation point for a certain indicator where you see less of animpact. It’s a continual improvement process where you’re actively measuring the effectiveness andadjusting your indicators based on what that indicator is telling you You have to continuouslyevaluate where you stand and make sure you’ve got the most valid indicator possible.”8VISITthecampbellinstitute.org CALL(630) 775-2283 EMAILcampbellinstitute@nsc.org
HoneywellLeading indicator: Safety observationsCreating “eyes and ears” to prevent incidentsPrior to launching its Safety Observation System four years ago, Honeywell relied on a webbased reporting system for near misses. Only managers and supervisors had access to this system,resulting in a hierarchical, bureaucratic process for employees to report events. The system handledreports in English only which given the international scope of Honeywell facilities, proved verylimiting. Honeywell executives saw that to improve company safety and drive down the incidencerate, they needed a more sophisticated system to handle near miss and hazard reporting.Unlike the previous system, the new Safety Observation System is directly accessible to allemployees and available in nearly twenty languages, providing Honeywell with more detailed andtimely information. Employees report not only near misses and incidents, but also any unsafebehaviors and conditions. Across Honeywell’s Building Solutions business unit, over 82,000safety observations were reported in 2013, equaling roughly eight observations per employee peryear. The correlation of safety observations with injury rate is clear – the business unit reducedthe number of recordable injuries from 108 in the year 2010 to 54 in 2013. During this sametime period, the number of safety observations increased nearly one hundred percent.The new system also allows for more input and analysis of near miss and incident data. Supervisorscan track the reports made by employees and any user of the system can assess and assign a risklevel to the condition or event being reported. Additionally the system provides data on any open orclosed corrective actions. Cary Gherman, global director of HSE for Honeywell Building Solutions,observed that the implementation of the Safety Observation System has increased the level of employeeinvolvement and changed the focus at Honeywell from only incidence rate to key leading indicators.“The discussion at Honeywell is on the safety observation rate, our HSE maturity and otherleading indicators as opposed to how many incidents we have. We still look at our incidencerate, but that really tells us the effectiveness of our leading indicators and the proactivesystems we put in place This reporting system shows the level of culture, of employeeinvolvement and what employees are doing to identify issues before they become incidents.”Gherman also notes that the purpose of the Safety Observation System goes beyond justcollecting observations. It’s about staying ahead of the risks that cause the most injuriesand creating vigilant observers of safety hazards at every level of the organization.“You always have to adjust to the types of injuries you see, the kinds of risks that are outthere and tell people where to focus their observations. If your observations aren’t focused onthe things causing injuries, you’re going to have a lot of observations, but they will have noeffect on your injury rate If a company really wants to systematically reduce the number ofincidents, it must identify the risks that lead to incidents. This safety observation process giveseyes and ears in all our operations to identify and fix issues before an incident occurs.”Practical guide to leading indicators: Metrics, case studies & strategies 9
NASA Safety CenterLeading indicator: Incident investigationTo predict the future, look at the presentIn 2010, NASA was encouraged by the Aerospace Safety Advisory Panel (ASAP) to provide moredetail on incidents and overall safety statistics. The NASA Safety Center team quickly realized thatthe constraints of its incident reporting database were preventing them from obtaining this detailedinformation. At that time, NASA had not developed many reporting requirements beyond OSHA togather information on underlying causes and behaviors of incidents in its agency-wide database. Theestablished categories in the Incident Reporting Information System (IRIS) did not allow for users toadequately code and describe the events that took place. The Safety Center team turned to the opentext fields to obtain more data on incidents and develop a series of categories and codes for trending.To discover these new categories, the Safety Center team looked at all the incidents of 2010 and createda set of activity codes for each incident. These activity codes describe what was happening operationallywhen the incident occurred and which programs or systems were involved. They repeated this processof categorization and coding for the years 2009 and 2011-2013, and now possess five full years of data.The NASA Safety Center team knew it could not stop at simply knowing the activities at the time of anincident. The IRIS database also contains information on the initiating event, or the specific action thatprecipitated the incident. This information is benchmarked against OSHA’s injury and illness classificationsystem and is modified to include actions and events that are specific to NASA. Finally, IRIS containsinformation on the kinds of barriers, controls and corrective actions to be implemented to prevent asimilar incident from occurring. To develop these barriers and controls, the Safety Center looked tofederally mandated safety programs and NASA’s own set of safety and mission assurance rules.It may seem odd to analyze mishap data to be proactive in preventing future incidents, butthis is what Steve Lilley and the others at the NASA Safety Center would argue.“[Our perspective] is that the findings, recommendations and interventions are independent ofleading or lagging indicators. It’s a matter of discovery whether you choose to call them ‘leading’or ‘lagging.’ They most often point to conditions that exist or continue to exist unless we fixthem. Our work moving forward is to gather more data about underlying causes. Then we canstart to point to these processes and identify the hazards that lie in these different processes.”This narrative from the NASA Safety Center shows that an incident reporting database does not have tobe built from scratch, but instead can be initially formed with federal regulations as guidelines and thentailored to organization-specific activities. Lilley emphasizes that to be truly proactive and vigilant for asyet unknown hazards, the reporting system must be open to change and updates. Approximately 1% to 5%of cases a year do not correspond to existing IRIS codes or categories, prompting the Safety Center team toupdate codes and definitions. Making these changes in the present can lead to the tracking of trends andprevention of future events. Conclusion: To plan where you want to go, you have to know where you are.10VISITthecampbellinstitute.org CALL(630) 775-2283 EMAILcampbellinstitute@nsc.org
USGLeading indicator: Site auditsMaking safety everyone’s responsibilityIn the early 1990s at USG, certified safety professionals performed audits of USG facilities in Texas. Thosefacilities that received this thorough, two- to three-day audit saw vast improvements in safety operationsover those facilities that did not receive audits. Leadership and plant managers at USG expressed a desireto expand and standardize the audit process to involve operations personnel, not just safety professionals.To do this, the safety department, plant managers, and other leaders had to develop a broad-based,standard document to rate facility operations. This became known as the Safety Activity Rating (SAR).To create the SAR document, Don Schaefer, director of Safety and Fleet Operations met withplant managers and other group leaders every 6-8 weeks for nearly two years to decide ona rating system and the descriptions for each rating category. Schaefer notes that this initialplanning phase can provide real value beyond the desired reduction in injury rate:“The key is to take the time to go through a year or two of meetings to hash out what worksfor your company. How does this fit your culture? Where are you in your safety progress?What’s the right next step for you? The real value lies in a group of operational managersdeciding what is important and how the document should read. Then they own it.”To conduct a Safety Activity Rating, a team of six consisting of a plant manager, employees,operators and supervisors visit a different USG site and perform an audit using the SAR document.Afterwards the team lead reviews the report with the plant manager who received the auditto develop corrective actions to address any weaknesses found in the report. The scores fromthe audits are seen by the safety department, but are otherwise not published and shared tothe entire company. Schaefer emphasizes that these scores are used not to force-rank facilitiesand incite competition, but rather for self-evaluation and improvement within sites.The Safety Activity Rating process not only allows a team to view another facility’s operations in anunbiased way, but also provides team members the opportunity to see what other sites do well andmentally benchmark these processes against what takes place in their home facilities. Besides thereduction in injury rate that USG has seen, a major outcome of SAR has been a heightened awarenessof safety among employees. As knowledge increases, so does participation and compliance, leading to areduction in incidents. Finally, Schaefer notes that because the SAR process is conducted
adding specific metrics for the key leading indicators on the list. The work from all three groups was combined to produce one matrix of key leading indicators, their definitions and associated metrics. To provide more context to certain leading indicators, Campbell members contributed narratives detailing