Transcription
Energy efficiency appliance standards:Where do we stand, how far can we go andhow do we get there? An analysis acrossseveral economiesVirginie E. LetschertPuneeth KalavaseEnvironmental Energy Technologies DivisionLawrence Berkeley National LaboratoryBerkeley, California 94720USAVLetschert@lbl.govLawrence Berkeley National LaboratoryPDKalavase@lbl.govAllison Hua FanCollaborative Labeling Appliances and Standards Programafan@clasponline.orgStephane de la Rue du CanGabrielle DreyfusLawrence Berkeley National LaboratorySadelarueducan@lbl.govU.S. Department of Energygabrielle.dreyfus@hq.doe.govMichael A. McNeilLawrence Berkeley National LaboratoryMamcneil@lbl.govKeywordsappliances, modelling, minimum energy efficiency standardsAbstractThis paper analyses several potential savings scenarios for minimum energy performance standard (MEPS) and comparableprograms for governments participating in the Super-efficientEquipment and Appliance Deployment (SEAD) Initiative, ofthe Clean Energy Ministerial, which represent over 60 % of primary energy consumption in the world. We compare projectedenergy savings from the main end uses in the residential sector using three energy efficiency scenarios: (1) recent achievements, (2) cost-effective saving potential, and (3) energy efficiency technical potential.The recent achievement scenario (1) evaluates the futureimpact of MEPS enacted or under development between 2010and 2012. The cost-effective potential scenario (2) identifiesthe maximum potential for energy efficiency that results in netbenefits to the consumer. The best available technology scenario (3) represents the full potential of energy efficiency considering best available technologies as candidates for MEPS andincentive programs. We use the Bottom Up Energy AnalysisSystem (BUENAS), developed by Lawrence Berkeley NationalLaboratory in collaboration with the Collaborative Labellingand Appliances Standards Program (CLASP), to provide a consistent methodology to compare the different scenarios. Thispaper focuses on the main end uses in the residential sector. Thecomparison of the three scenarios for each economy providespossible opportunities for scaling up current policies or implementing additional policies. This comparison across economiesreveals country best practices as well as end uses that presentthe greatest additional potential savings. The paper describesareas where methodologies and additional policy instrumentscan increase penetration of energy efficient technologies. First,we summarize the barriers and provide remedial policy tools/best practices, such as techno-economic analysis, in responseto each barriers that prevent economies from capturing the fullcost-effective potentials of MEPS (Scenario 1 to 2). Then, weconsider the possible complementary policy options, such asincentive programs, to reach the full technical potential of energy efficiency in the residential sector (Scenario 2 to 3).IntroductionAs part of the ongoing effort to estimate the foreseeable impactsof minimum energy performance standards (MEPS) programsin 11 major economies participating into the Super-efficientEquipment and Appliance Deployment (SEAD) Initiative ofthe Clean Energy Ministerial, Lawrence Berkeley NationalLaboratory (LBNL) has developed the following energy efficiency scenarios:1. The “recent achievements” (RA) scenario estimates the im-pact of MEPS that were implemented, announced, or arebeing considered from January 2010 to July 2012 (Kalavaseet al., 2012).2. The “cost-effective scenario” (CEP) seeks to identify themaximum energy savings while providing net positive benefits to consumers (Letschert et al., 2012a).3. The “best available technology” (BAT) scenario seeks to de-termine the maximum potential savings that would resultfrom large scale adoption of the most efficient available technologies in these major economies (Letschert et al., 2012b).ECEEE SUMMER STUDY PROCEEDINGSContentsKeywordsAuthors1759
6-191-13 LETSCHERT ET AL6. APPLIANCES, PRODUCT POLICY AND ICTWe use the Bottom-Up Energy Analysis System (BUENAS)to estimate potential impacts and savings for a wide range ofresidential and industrial end uses and to generate and analyzethese scenarios. BUENAS has previously been used to estimatepotential national energy demand savings1 and carbon dioxide(CO2) mitigation potential from MEPS around the world forthe Collaborative Labeling and Appliance Standards Program(CLASP) and the SEAD Initiative (McNeil et al., 2013).In this paper, rather than focusing on the energy demand ineach scenario, we study the differences between the three efficiency scenarios to reflect the impact of current policies andidentify additional opportunities for scaling up current policiesor implementing additional policies. This comparison acrosseconomies reveals best practices as well as end uses that presentthe greatest additional potential savings. The paper describesareas where methodologies and additional policy instrumentscan increase penetration of energy efficient technologies. First,we cover the barriers and identify remedial policy tools/bestpractices to capture the full cost-effective potential of MEPSsuch as techno-economic analysis (Scenario 1 to 2). Then, weconsider the possible complementary policy options such as incentive programs to reach the full technical potential of energyefficiency in the residential sector (Scenario 2 to 3).The study focuses on electric end uses in the residentialsector, specifically on the most energy-intensive end-uses forwhich data are available across most economies (i.e. lighting,refrigerators, air conditioners, televisions, standby power andwashing machines). We present the results of each scenario,by economy and for each end use in terms of annual energydemand savings in 2030.their relative impacts on the energy demand results. A complete discussion of input parameters, methodology, results anderror analysis can be found (McNeil et al., 2013).RECENT ACHIEVEMENTS IN SEAD PARTICIPATING GOVERNMENTSThe recent achievements (RA) scenario is built on the BAUscenario developed in BUENAS. To build the RA scenario, wecollect and compile information on standards and labelling(S&L) programs in SEAD economies and analyze the impactsof individual policies that were implemented, announced, orare being considered between January 2010 and July 2012 inthose economies (Kalavase et al., 2012) (McNeil et al., 2012)2. These programs have either entered into force since 2010 orwill enter into force before 2016. Impacts of these programs areprojected to 2030. It should be noted that the assumptions anddata used in the BUENAS model may be different from thoseuse by each government, and as a result the model projectionscan possibly differ from each program own projections.The following S&L programs were analyzed: Equipment Energy Efficiency (E3) program of the Austral-ian Department of Climate Change and Energy Efficiency ecoENERGY Efficiency for Equipment S&L program ofNatural Resources Canada (NRCan) Ecodesign program from the European Commission S&L program from the Bureau of Energy Efficiency of India(BEE) Top-Runner program from Ministry of Economy, Trade andIndustry of Japan (METI) S&L program from Korean Energy Management Corpora-Scenarios DescriptionThe three efficiency scenarios are built on the business-asusual (BAU) scenario developed in (McNeil et al., 2013). Asdescribed in the section below, we consider different criteriato define the target efficiencies in each scenario. The underlying data and assumptions for each end use and economy areavailable in the technical reports referenced in the followingscenario descriptions.BUSINESS-AS-USUAL SCENARIOThe BAU scenario is a projection of energy consumption byend use from 2010 (base year) to 2030 for the residential, commercial and industry sectors. In the residential sector, whichis the focus of the present study, the BAU takes inputs fromproduct ownership rates, product sales, annual unit energyconsumption, and per unit percentage improvement potential. In the absence of reliable market data, the model forecastsappliance ownership using an econometric model relying onmacro-economic variables, such as household income, urbanization, electrification, and climate variables. Stock and sales arethen calculated through a stock turnover analysis consideringhistorical sales, population (number of households), and appliance lifetime. As a consequence the drivers of energy demandin the model are numerous and vary by economy depending ondata availability. Table 1 lists the key drivers from the BAU and1. BUENAS scenarios estimate energy demand savings as opposed to energy consumption savings (i.e. they do not account for electricity demand not delivered).tion (KEMCO) S&L program from the National Commission for EnergyEfficiency (CONUEE) in Mexico Building and Technology program of the U.S. Departmentof Energy (DOE)Even though S&L programs exist in Brazil and Russia (CLASP,2011), the data were not sufficient to model the impacts ofrecent activities. As for South Africa, the appliance standardsprogram is still at an early stage of development, so it has notbeen included in the present analysis.COST-EFFECTIVE POTENTIAL IN SEAD PARTICIPATING ECONOMIESThe CEP scenario is built on the BAU scenario developed inBUENAS. CEP targets are determined according to the cost ofconserved energy (CCE) of various design options/technologies that provide higher appliance energy efficiency. The CCEis defined as the ratio between the annualized incremental appliance cost3 and the energy saved in a year, which shows theinvestment needed per unit of energy savings ( /kWh).2. The SEAD participating governments modeled in BUENAS are Australia, Brazil,Canada, European Union, India, Japan, Mexico, Russia, South Korea, South Africa,and the United States. The United Arab Emirates participate in SEAD, but have notyet been incorporated into the BUENAS model.3. The annualized extra cost of purchasing a high-efficiency appliance is the product of the incremental investment and a capital recovery factor, which is a functionof the consumer discount rate.1760 ECEEE 2013 SUMMER STUDY – RETHINK, RENEW, RESTARTContentsKeywordsAuthors
6. APPLIANCES, PRODUCT POLICY AND ICT6-191-13 LETSCHERT ET ALTable 1. Summary of Key Drivers and Associated Impact on Results.VariableHistorical SalesLifetimeBase Year Efficiency DistributionUsageField Consumption VariabilityRebound EffectsSales Growth RatesPopulation and Household SizeGDP Growth RateUrbanization and ElectrificationEfficiency and Product Class TrendsImpact on ResultsData-Driven VariablesModerateModerateLow to ModerateSignificant for some equipment typesModerateModerateForecast ParametersSignificantLowModerate to SignificantLowModerate to SignificantThe CCE is calculated from cost efficiency data from the Global Energy-Efficiency Cost (GEEC) database, a compilation ofinternational cost curves for equipment and appliances (Mc Neil, 2012) . The GEEC database builds upon a variety of sources, including technical analysis studies performed by LBNL insupport of the SEAD Initiative, technical support documents(TSDs) developed for the U.S. DOE standards program, preparatory studies from the European Commission Ecodesignprogram, and retail price surveys. Where data are not available,we use regional market assumptions to extrapolate incrementalcosts for specific countries. The CCE is then recalculated usinglocal parameters (discount rates and energy prices).By comparing the CCE with the local electricity tariff in eacheconomy, we determine the highest cost-effective efficiency targets for that country. These targets provide the greatest energysavings while ensuring a net financial benefit to consumers.The targets determined using the CCE are then propagated intoBUENAS to estimate global savings over the full life of productsshipped between 2015 and 2030 (Letschert et al., 2012a).BEST AVAILABLE TECHNOLOGY SCENARIOThe BAT scenario targets represent the maximum achievableenergy-efficient designs, based on emerging technologies thatare commercialized (or will be soon) but have a small market share, or designs that combine the most efficient currentlyavailable components. In cases where neither of these optionsis available, the analysis uses an aggressive target from an existing efficiency program. BAT targets exclude promising technologies that are in development but are several years awayfrom commercialization. In addition, large-scale productionof products or technologies that meet the BAT targets mustbe feasible by 2015, which is the year we assume the MEPSwould enter into effect (Letschert et al., 2012b). In the rest ofthe paper, the savings potential from a MEPS mandating bestavailable technologies is also referred to as the technical potential for energy efficiency.In contrast to previous efficiency scenarios (RA and CEP),in which country or regional considerations are taken into account in determining MEPS targets, in this analysis we identifyone common international BAT target (or technology) for eachend use. This target is generally characterized by an efficiencyrating that we use to determine the unit energy consumption(UEC) of the BAT scenario for each country, according to theUEC and efficiency in the BAU scenario. The BAT targets aretherefore adjusted for typical appliance capacities and usageprofiles specific to each country. For example, the lightingUECs are adjusted for the typical wattage of incandescent bulbsin every country, along with the typical hours of usage. As aconsequence, each country has a different UEC target even forthe same technology with the same efficiency.As it is the case for the other scenarios, the BAT scenariois built on the BAU scenario. BAT targets are determined according to the above criteria using a variety of sources, such as:technical analysis studies performed by LBNL in support of theSEAD Initiative, the Max Tech and Beyond study (Desrochesand Garbesi, 2011), TSDs developed for the U.S DOE standardsprogram, preparatory studies from the European CommissionEcodesign program, and the Japanese Top Runner program’starget definitions.SCOPE OF THE SCENARIOS COVERAGEBecause BUENAS has been used to support the activities ofthe SEAD Initiative, BUENAS includes all SEAD participatingeconomies for which appropriate data is available4. The scope ofthe original studies covers 14 end-uses in the residential sectorand motors and transformers in the industry sectors. In thispaper, because we are trying to compare all economies on aconsistent basis, we reduced the scope to electric appliancesin the residential sector that are covered in most economies5.Table 2 shows the appliances and countries covered in the BAU,RA, CEP and BAT scenarios.Scenario Cross-Cutting AnalysisIn this section we combine the three efficiency scenarios andBAU scenario presented above in order to gain insights on energy efficiency achievements since January 2010 and potentialfuture opportunities, as well as end-use specific energy efficiency potential.4. See footnote 2.5. I.e. data on water heating and space heating is scarce and doesn’t allow for acomprehensive modeling in every country, so these end-uses have been takenout in this paper.ECEEE SUMMER STUDY PROCEEDINGSContentsKeywordsAuthors1761
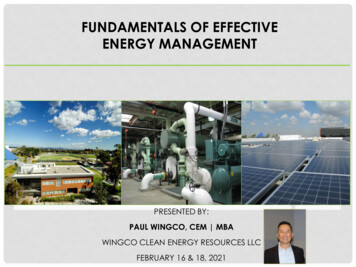
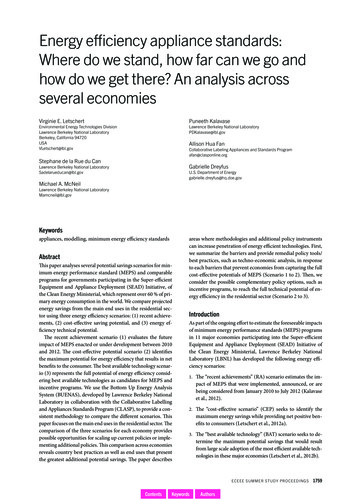
6-191-13 LETSCHERT ET AL6. APPLIANCES, PRODUCT POLICY AND ICTTable 2. Comparison of BAU and BUENAS Scenario Scope (Shaded cells countries covered in BAU scenario; XX covered in RA, CEP and BAT, X covered onlyin CEP and BAT r Conditioner*XXXXXXXXXXXXXXXXXXXXXXXCentral Air ConditionersFansXXFreezersXXXXXXXWashing geratorsXXXXXXXXXXXXXXXXStandby PowerXXXXXXXXXXXXXXXTelevisionsXXXXXXXXXXXAUS Australia; BRA Brazil; CAN Canada; EU European Union; IND India; JPN Japan; KOR South Korea; MEX Mexico;RUS Russia; USA United States of America; ZAF South Africa.* Includes heating mode for reversible calPotential(notyetcost- ‐effective)Figure 1. Annual Energy Savings in 2030 from Energy Efficiency Standards in billion kilowatt-hours (TWh) – Current Achievements andPotential for SEAD economies.In Figures 1 and 2, we present the recent achievements scenario, the difference between the cost-effective potential andthe recent achievements (“remaining cost-effective potential”),and the difference between the technical potential and the costeffective potential (“remaining technical potential (not yet costeffective)”). Figures 1 and 2 show the annual energy savings in2030 for each economy and end uses from BUENAS.Another way to look at the scenarios is from the technical/engineering perspective: what appliances present a large po-tential for savings and are not being addressed – are not yetcost-effective to be addressed – by current policies? In light ofrecent technical analysis studies commissioned by the US DOEthrough the SEAD Initiative (Park et al., 2012; Sathaye et al.,2012; Shah et al., 2012) , large cost-effective and technical potential has been revealed for televisions, air conditioners andceiling fans. The cost vs. efficiency relationship determined inthese studies have been incorporated into the CEP and BATscenarios.1762 ECEEE 2013 SUMMER STUDY – RETHINK, RENEW, RESTARTContentsKeywordsAuthors
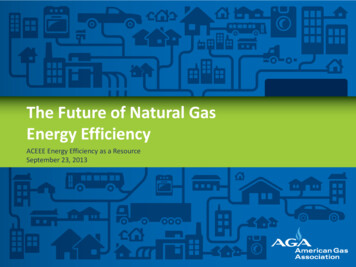
6. APPLIANCES, PRODUCT POLICY AND ICT6-191-13 LETSCHERT ET ies050100150200250300TWh350CentralA mA iningTechnicalPotential(notyetcost- ‐effective)Figure 2. Annual Energy Savings in 2030 from Energy Efficiency Standards in billion kilowatt-hours (TWh) in SEAD economies by end-useproduct.KEY DRIVERS:As is the case for the BAU scenario (see Table 1), the magnitudeof cost-effective and technical potentials is driven by appliancesales and forecasted economic growth rates. Besides these keyfactors, most of the variation between economies can be attributed to difference in usage patterns (for example, climaticdifferences affect potential savings from air conditioners andfans) and on the baseline efficiency of the existing equipmentand appliance stock (countries like India with a very inefficientbaseline stock in 2010 present a lot of potential savings). Forthe CEP, economic parameters – such as residential electricityprice, price of appliances and discount factors – have a largeimpact on the target efficiency level as well. Also, there is ahigh correlation between the fact that there is a standard beingdeveloped in a country and the availability of data to model theimpacts. As a consequence, the identification of cost-effectivepotential is highly dependent on the state of the policy development in a country. For example, the cost-effective potentialin South Africa or Russia will grow as country-specific databecome available.KEY CONSIDERATIONS:A few considerations on the recent achievement scenario haveto be taken into account in order to weigh the results shown inFigures 1 and 2.Schedule: Recent achievements do not reflect S&L programsimplemented before 2010. Hence the variations between countries may be caused by different S&L implementation sched-ules and do not reflect don’t reflect governments’ commitmentsto S&L programs before 2010 (the base year in the BUENASmodel). For example, Mexico has shown a strong commitmentto MEPS since the mid-90s, which is not being reflected in thepresent analysis.Data availability: When modeling the impacts of the currentprograms, we are limited to the data provided by each government or available from other sources.Focus on MEPS: Complementary energy efficiency programssuch as labels and other non-regulatory measures are not represented in Figure 1.For these reasons, the estimates presented in the recentachievement scenario have to be taken as the lower boundof the projected impacts from all activities carried-out by theSEAD participating economies.As well as a few considerations on the cost-effective potentialand best available technology scenario.Moving targets: Innovation and learning drive down the costof efficient technologies, such that products and technologiesfrom the BAT scenario that are not cost-effective today, may becost-effective in one or more years. The same is true for BAT,because our analysis is limited to technology developments thatare foreseeable and that can be evaluated in terms of energyperformance as of today, our estimate of technical potential hasto be seen as conservative.As a result, our estimates of cost-effective and technicalpotential are the lower bounds of the likely cost-effective andtechnical potential just a few years from now.ECEEE SUMMER STUDY PROCEEDINGSContentsKeywordsAuthors1763
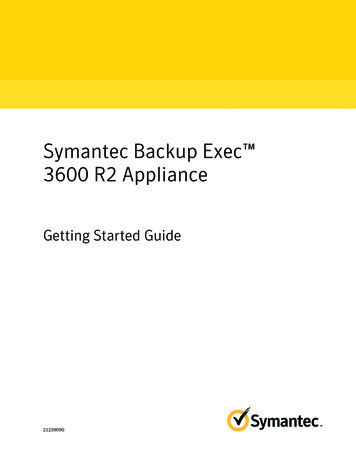
6-191-13 LETSCHERT ET AL6. APPLIANCES, PRODUCT POLICY AND ICTKEY RESULTS:By comparing the recent achievements to the cost-effective andtechnical potentials, we can identify additional opportunitiesfor cost-effective potential savings and remaining technicalpotential savings.Figure 1 illustrates the potential captured by the recent S&Lactivities as well as what is left on the table in the SEAD economies. With a multitude of standards on their way, the European Union is the region capturing the most cost-effectivepotentials by setting their standards at the most aggressivecost-effective levels for consumers, although the full potential is still unrealized. This remains true for the U.S. program,which captures two-third of the cost-effective potential of theend uses analyzed here. Notable good practices are found inSouth Korea and Japan, where, even though the price of electricity is high (which implies a high cost-effective potential),KEMCO’s standby power MEPS and METI’s Top RunnerProgram for room air conditioners address about half of thetotal cost-effective potentials in each country. India is achieving 50 % of its cost-effective potential thanks to BEE’s recentactivities on room air conditioners and refrigerators, representing respectively 80 % and 20 % of the recent achievementsavings.We can distinguish among three groups of appliances/technologies: Established/conservative technologies: end uses for whichrecent achievements have captured a fair portion of the costeffective potential, and for which the cost-effective potentialis about two-thirds of the technical potential6. This is thecase for products that have been regulated on a regular basissuch as refrigerators-freezers, room air conditioners, central air conditioners, washing machines and more recentlystandby power. These products all have remaining cost-effective potential and technical potential, and this potentialis likely to be growing with innovation/learning. Highly cost-effective technologies: our study suggests thatfans present high potential for cost-effective savings andthat no standards have been proposed or implemented forthis product since 2010. Two-thirds of the cost-effective potential savings are found in India. Technologies not yet cost-effective: though promising,these are still emerging technologies that are not cost-effective under any economic/usage conditions in the SEADeconomies. These are namely: LEDs for general lightingpurposes and OLED used in televisions. These technologies have not yet hit mass production, which means theirprice remains high, which is a barrier for new technologyadoption. In this case, financial incentives (described in thelast section) can serve as a tool to bring the technology tocost-effective levels and to foster adoption of new products,which is expected to induce a drop in price once mass-production occurs (Weiss, 2010).6. This is an artifact of the way the cost-curves were built and the BAT was determined. We are looking at technology mass-producible in the near future and as aconsequence in the engineering continuity of the existing technologies. Prototypesand new emerging technologies have not been selected for this study in order tobe conservative.Reaching Cost-Effective PotentialThe previous section revealed that no government S&L program captures the full cost-effective potential for energy efficiency of the 14 end-uses studied. In this section we explorepossible barriers to full adoption of cost-effective policies andprovide insights on best practices that may enable governmentsto capture a great share of these potential savings.BARRIERS AND BEST PRACTICESMost of the SEAD participating governments already have orare in the process of developing S&L programs, which meansthey have overcome, or are in the process of overcoming, thechallenges that often face governments developing their firstprogram, such as policy makers’ lack of confidence in the effectiveness of standards, lack of availability of testing laboratories, or lack of awareness of energy efficiency. However,program implementation stage varies widely among SEADgovernments, hence the barriers confronted vary on a case bycase basis (IEA, 2012; Wiel and J.E. McMahon, 2005). Table 37describes the barriers, effects and potential solutions to implement MEPS that would move governments towards capturingthe full cost-effective potential.STUDY LIMITATIONIn addition to some of the most important criteria for setting astandard – such as the consumer impact and national impacts(energy, environmental and financial impacts), there are a variety of additional criteria that should be considered at whendesigning a MEPS program. Based on a review of practices inthe SEAD economies (EC, 2005; METI, 2010; USC, 1978), wehave identified additional criteria: Impacts on the manufacturers/industry (e.g. lessening ofcompetition, loss of revenue and job). Life-cycle analysis (e.g. environment impact from produc-tion phase to disposal). Market consideration (e.g. possibility of mass production,% of products impacted by MEPS) Political considerations.The BUENAS model does not account for these considerations,some of which may contribute to the gap between the recentachievements and the cost-effective potential.Moving toward Technical PotentialThe BAT scenario shows that emerging technologies continueto generate more efficient products that have a large potentialto reduce energy consumption as their market penetration increases. Moreover, the comparison of the cost-effective potential to the recent achievement potential shows that a significantamount of the cost effective potential is not currently capturedby S&L programs. Hence, complementary energy efficiencypolicies, such as incentive programs, can help transform themarket towards more efficient products.7. PAMS-MEPS is a spreadsheet model developed by LBNL for CLASP and is available for download for free at: /PolicyAnalysisModelingSystem.1764 ECEEE 2013 SUMMER STUDY – RETHINK, RENEW, RESTARTContentsKeywordsAuthors
6. APPLIANCES, PRODUCT POLICY AND ICT6-191-13 LETSCHERT ET ALTable 3. Key Barriers and Best Practices/Remedial Policy Instruments.Best Practices/RemedialPolicy InstrumentsEngage representatives ofthe principal stakeholders –including manufacturers,consumers, utilities, localgovernments, andenvironmental or energy –efficiency interest groups – inan open and transparentprocess to contributeinformation and raiseconcerns through all steps ofthe standards-settingprocess.BarrierEffectLack of a publicprocess thatinvolves allstakeholdersExperiences frommany countrieshave shown thateffective standardsare difficult toestablish withoutstakeholderinvolvement.Standardschedules andscopesOpportunities foradditional costeffective potentialthat are not yetexploitedEstablish systematic processfor prioritization of standardsand identifying opportunitiesfor extension of scope. Toolssuch as BUENAS cansupport this process.There is considerable evidence thatthe real price of appliances in theresidential sector is declining overtime(Desroches et al., 2013).Design options that were not costeffective a few years again mightwell be a few years later.Lack ofrequirements ofanalysisStandards are notoptimized forenergy savings andconsumer financialbenefits.Mandate policy analysis inregulatory frameworksIdeally, criteria to set the MEPSlevel are made explicit in theregulatory framework.Cost effectivepotential isunderestimatedRemove subsidies orconsider incentives forenergy efficient appliances.Tools such as LEERAprovide an analysis of thisoption.LEERA is a spreadsheet model toolthat analyzes the revenue transferinvolved between government,manufacturers and consumerswhen subsidizing more efficientappliances (Gopal et al., yHigh up-frontcost of energyefficient productsLack of dataEven though costeffectiveness isknown, the addedfirst cost ofpurchasing energyefficient productsmay be a barrier tobuyers.Damages thecredibility of theanalysis, increasinglikelihood ofstakeholderopposition to thestandardThis barrier can be reducedby rebates, attractive loanfinancing or leasing, taxcredits, or governmentpurchasing policies (see nextsection).Involve a wide range ofstakeholders in datacollection to support thestandard-setting process (seeabove).Lack of analysisStandards are notset at an optimallevel thatmaximizes savingswhile ensuringconsumer netbenefitsPolicy analysis tools such asthe Policy Analysis ModelingSystem (PAMS-MEPS) canaddress such barriers. Themodel provides estimates ofconsumer impact (based on acomparative life-cycle costanalysis of different efficiencylevels), potential energysavings and greenhouse gasemissions reductionpotentials, and net presentvalues
the Clean Energy Ministerial, which represent over 60 % of pri-mary energy consumption in the world. We compare projected energy savings from the main end uses in the residential sec-tor using three energy efficiency scenarios: (1) recent achieve-ments, (2) cost-effective saving potential, and (3) energy ef-ficiency technical potential.