Transcription
EFFECT OF FEED SALINITY ON THE PERFORMANCE OFHUMIDIFICATION DEHUMIDIFICATION DESALINATIONAuthors:Karim M. Chehayeb, John H. Lienhard VPresenter:Karim M. ChehayebDoctoral Candidate – Massachusetts Institute of Technology – USAchehayeb@mit.eduAbstractHumidification dehumidification (HDH) is a thermal desalination technology that imitates the rain cyclein an engineered setting. It can be advantageous is small-scale, decentralized applications. In addition,the components used in HDH systems are fairly robust, and can treat highly saline water. Thetechnology has recently been commercialized in order to treat highly saline produced water fromhydraulically fractured oil and gas wells. That plant has proved HDH’s ability to treat water that mostcurrent seawater desalination technologies are unable to treat.The major disadvantage of HDH is its low energy efficiency compared to other desalinationtechnologies when treating seawater. Previous studies have shown that the system’s energy efficiencycan be improved greatly by varying the water-to-air mass flow rate ratio within the system. Thistranslates into operating two or more adjacent stages at different mass flow rate ratios, which is done byextracting an air stream from an intermediate location in the humidifier and injecting it at anintermediate location in the dehumidifier.Previous models have used fixed effectiveness or fixed pinch approaches to evaluate the benefits ofmulti-staging, but these do not take account of the size of the system. In physical systems, what remainsconstant when going from a single-stage to a multi-stage system is the total size of the system and notthe effectiveness or the pinch. Therefore, comparing systems with the same total heat exchanger area isthe best way to understand the effect of extraction/injection and whether its implementation is beneficialor not.In this paper, a numerical heat and mass transfer model is used to simulate the operation of HDH atvarious feed salinities. For each case, the performance of the single-stage system is compared to that of atwo-stage system of the same size at different values of feed salinity. The ability of HDH to treat feedswith varying salinity is also studied.The International Desalination Association World Congress on Desalination and Water Reuse 2015/San Diego, CA, USAREF: IDAWC15- Chehayeb 51572
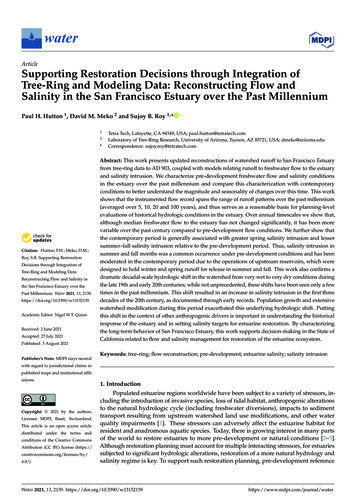
I.INTRODUCTIONHumidification dehumidification (HDH) is a thermal desalination technology that can be advantageousin small scale, decentralized applications [1, 2, 3]. The technology does not use membranes or hot metalsurfaces, which allows it to treat highly saline water with some oil content. In addition, the equipment inHDH can be replaced cheaply if scaling does occur. These characteristics make HDH suitable fortreating produced water from hydraulically fractured oil and gas wells. In fact, HDH has recently beencommercialized, and was shown to treat very saline water from shale wells that most other technologieshave so far failed to treat [4].A typical humidification dehumidification (HDH) system consists of a humidifier, a dehumidifier, and aheater. As shown in Fig. 1, cold air is put in direct contact with a stream of hot saline water in thehumidifier, causing the air to heat up and carry more water vapor. The hot moist air is then put inindirect contact with cold saline water in the dehumidifier, causing the air to cool down and lose some ofits moisture, which exits the system as fresh liquid water. The dehumidifier also serves to preheat thesaline water before entering the heater, which results in better energy efficiency than simple distillation.Figure 1: A schematic diagram of a humidification dehumidification (HDH) desalination systemwith a single air extraction/injection.The major shortcoming of previous HDH systems has been their high energy consumption. This hasspurred extensive research on improving the energy efficiency of these systems. Narayan et al. [5, 6]showed that the water-to-air mass flow rate ratio has a major effect on the energy efficiency of thesystem, and that a single value of the water-to-air mass flow rate ratio resulted in the highest energyefficiency. It was found that the condition for optimal performance was to set the modified heat capacityrate ratio (HCRd) in the dehumidifier to unity, where HCRd was defined in [7] as the ratio between themaximum change in the enthalpy rate of the cold stream to that of the hot stream:HCR d 𝛥𝐻̇max,cold𝛥𝐻̇max,hotThe International Desalination Association World Congress on Desalination and Water Reuse 2015/San Diego, CA, USAREF: IDAWC15- Chehayeb 51572Page - 2 - of 16
In addition, the specific heat of moist air varies greatly with temperature due to the latent heat of thewater vapor, whereas the specific heat of water remains relatively constant. It is therefore beneficial tooperate the system at a varied water-to-air mass flow rate ratio in order to keep the total heat capacityrates of the two streams as close as possible [8, 9, 10, 11, 12, 13, 14, 15]. This can be done by extractingan air stream from an intermediate location in the humidifier and injecting it at an intermediate locationin the dehumidifier. In a recent study, it was found that the highest energy efficiency was achieved whenthe modified heat capacity rate ratio, HCRd, was equal to 1 in each of the stages [16]:HCR d,1 HCR d,2 1This paper studies the effect of feed salinity on the benefit that comes with operating the HDH system intwo stages. The operation of a fixed-size HDH system under different feed salinities is simulated, and ateach value of feed salinity the increase in efficiency and water production due to multi-staging isstudied. In addition, the ability of HDH to treat a feed of varying salinity is studied by examining theflow rates that result in optimal performance at each feed salinity.II.MODELINGThe HDH system studied consists of a multi-tray bubble column dehumidifier and a packed-bedhumidifier. This section briefly presents the models used, and the detailed descriptions of these modelsand their numerical solutions can be found in [17, 18] as well as in the Appendix.2.1Bubble Column DehumidifierConventional dehumidifiers use a cold surface to condense water out of the air stream. However, thehigh concentration of air results in a very large resistance to water vapor mass transfer and necessitates avery large condensing surface. Narayan et al. [19] proposed the use of short bubble columns for thedehumidification side of HDH. Condensation in a bubble column occurs on the bubble-water interface,so the expensive metal surface required in previous dehumidifiers is replaced by a very large air-waterinterface.In a bubble column dehumidifier, hot air bubbles travel through a column of fresh water and saline watertravels through a coil that is submerged in the column. The air is cooled and dehumidified and the salinewater is heated.In this paper, the model developed by Tow and Lienhard [20] is used. This model uses a resistancenetwork to model the heat and mass transfer between the air bubbles and the saline water. Tow andLienhard assume perfect mixing in the column, which results in the air leaving the dehumidifiersaturated at the temperature of the column. This means that the air-side resistance is negligible and thereare only two resistances left: the outer resistance, Rout, between the coil and the column of fresh water,which is calculated using the correlation by Deckwer et al. [21], and the inner resistance, Rin, betweenthe coil and the saline water, which is calculated using the correlations developed by Mori andNakayama [22, 23]. Tow and Lienhard found that their model was in good agreement with experimentsconducted at various conditions.The International Desalination Association World Congress on Desalination and Water Reuse 2015/San Diego, CA, USAREF: IDAWC15- Chehayeb 51572Page - 3 - of 16
Although the bubble column may at first appear to be a counterflow heat and mass exchanger, it iseffectively a parallel flow configuration. Both streams exchange heat with a column of fresh waterwhich is well mixed and at a uniform temperature. This means that at best the two streams can exit at thesame temperature, which is that of the column of fresh water. This results in a low effectiveness if onlyone column is used. The solution to this limitation is to stack up multiple trays in series to achieve higheffectiveness. The equations above apply for a single tray, and modeling the multi-tray bubble column isa question of matching the boundary conditions between the successive trays. The numerical algorithmof the solution method can be found in [17, 24].2.2Packed-bed HumidifierThe packed-bed humidifier is modeled using the Poppe and Rögener cooling tower model [25]. Thismodel is the most thorough model for cooling towers. It is widely used and has been experimentallyverified [18]. The model was solved numerically using the fourth-order Runge-Kutta method, asdescribed in great detail by Kloppers and Kröger [18, 26]. In this paper, the specifications provided byBrentwood Industries for their CF-1200MA packing (summarized in Table 1) are used to determine theperformance of the packing. The equations summarizing the model as well as the solution algorithm canbe found in the Appendix.2.3Complete SystemIn modeling a single-stage system, the packed-bed humidifier is coupled with the multi-tray bubblecolumn and the air temperatures are matched between the two components, as shown in Fig. 1. Thespecifications of the system that are held constant are summarized in Table 1.Table 1: Specifications of the system studied.Operating conditionsTop temperature90 CBottom temperature25 CFeed mass flow rate0.242 kg/sFeed water salinity0 - 200 pptHumidifier geometryHeight, H3mCross-sectional area0.05 m2Fill surface area226 m2 / m3Merkel number, Me0.967Minimum-maximum water loading13.4-32 m3 / hr - m2Dehumidifier geometryPipe length per tray2.5 mNumber of trays30Pipe outer / inner diameter9.5 mm / 8.7 mmCoil turn diameter0.4 mThe International Desalination Association World Congress on Desalination and Water Reuse 2015/San Diego, CA, USAREF: IDAWC15- Chehayeb 51572Page - 4 - of 16
In order to model a two-stage system, the location of extraction/injection is varied, and the flow rates ofdry air in the two stages are chosen such that the injected air stream is in equilibrium with the mainstream in the dehumidifier at the point of injection. This condition means that there are only certain pairsof air flow rates that satisfy the requirement that no entropy is generated due to mixing at the point ofinjection. The location of extraction/injection and the flow rates of air are varied, and only the optimalconditions are presented in the following section. The numerical algorithms for the complete singlestage and two-stage systems are summarized in the Appendix, and are described in detail in [17].2.4Thermophysical PropertiesThe thermophysical properties of moist air and water vapor were evaluated using the ASHRAE Libraryof Humid Air Psychrometric & Transport Property (LibHuAirProp) which is based on ASHRAE RP1485 [27].The viscosity and conductivity of saline water were evaluated using the correlations presented bySharqawy et al. [28]. The correlations for these variables are only verified up to a salinity of 160 ppt andhad to be extrapolated to 200 ppt. However, these properties are only used in the calculation of theresistance of the liquid inside the coil in the bubble column dehumidifier, and the length of the pipe pertray is large enough such that this resistance is small and has minimal effect on the performance of thesystem.In addition, the thermophysical properties of saline water were evaluated as those of aqueous NaClbased on the equations given in [29]. The air in the humidifier is in direct contact with the saline water,which lowers its water vapor pressure. In the equations describing the Poppe and Rögener model, thehumidity ratio at saturation is evaluated using the reduced water vapor pressure.2.5Performance ParametersThe gained output ratio, GOR, is used to evaluate the energy efficiency of the system. It is defined as theratio of the latent heat of vaporization of the product water to the heat input into the system:GOR 𝑚̇pw ℎfg𝑄̇inIn calculating GOR, the latent heat of vaporization, hfg, was evaluated at the feed salinity and at 60 C,which is representative of the operating range of temperatures.The recovery ratio, RR, is the ratio of the mass flow rate of product water to that of the feed water:RR 𝑚̇pw𝑚̇feedIn this paper, the feed flow rate, 𝑚̇feed , is kept constant so RR is a direct measure of the waterproduction in the system.The International Desalination Association World Congress on Desalination and Water Reuse 2015/San Diego, CA, USAREF: IDAWC15- Chehayeb 51572Page - 5 - of 16
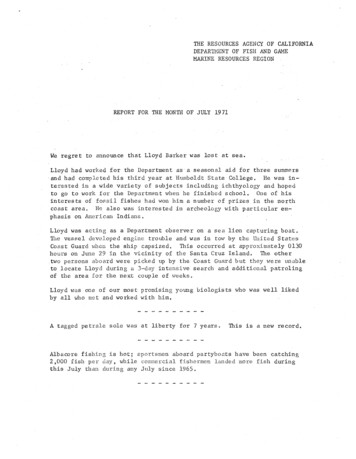
III.RESULTSThis section studies the effect of the feed salinity on the performance of a system of fixed-size, and onthe increase in performance in going from single-stage to two-stage operation. In addition, this sectionexplains why the use of a packed-bed humidifier decreases the effect of the decreasing vapor pressure onthe system performance. The ability of HDH to handle varying feed salinity, up to 200 ppt, is alsostudied.3.1 Effect of Salinity on the Gain from Multi-stagingAs discussed in Section 1, operating a humidification dehumidification system in two stages withdifferent mass flow rate ratios can help decrease the entropy generated and improve the energyefficiency of the system. This section evaluates the improvement in performance gained by going from asingle-stage to a two-stage system while keeping the total system size constant.At each value of feed salinity, the operating conditions that result in the best performance are found forsingle-stage and two-stage systems. The component dimensions and the operating conditions that areheld constant are summarized in Table 1. For the single-stage case, the mass flow rate of dry air isvaried, and the mass flow rate ratio that results in the best performance is that which also results inHCRd 1. To find the best performance that can be achieved by a two-stage system, the location ofextraction/injection and the flow rates of dry air in the two stages are varied such that the injected streamis at the same temperature as the main stream in the dehumidifier at the location of injection. Thecombined sizes of the humidifiers and of the dehumidifiers are fixed. The operating conditions thatresult in the best performance for each salinity are those which result in HCRd,1 HCRd,2 1, which isconsistent with the results reported in [17] for seawater.Figure 2 shows the highest GOR that can be achieved by optimized single-stage and two-stage systemsof the same total size. It can be seen that the GOR of the single-stage system is not a strong function ofthe feed salinity. GOR for a feed salinity of 200 ppt is 11% lower than that at 0 ppt. This result iscomparable to the findings of Thiel et al. [30] who report that a GOR drop of around 17-27% by goingfrom a feed salinity of 0 to 260 ppt by using a fixed temperature pinch. It is expected that the drop willfurther increase as salinity is increased to 260 ppt.The performance of the two-stage system drops with increasing salinity. However, as shown in Fig. 3,the gain in GOR as a result of multi-staging is still sizeable. The increase in GOR drops from around60% at 0 ppt to around 40% at 200 ppt. It is worth noting that these numbers are specific to the systemsimulated in this paper, which is large enough to result in high component effectiveness (εd 98%, εh 92%) when operated as a single stage. As the system size decreases, the improvement in performancewould decrease because the portion of entropy generation saved by better balancing becomes smallercompared to the total entropy generated in the system.The International Desalination Association World Congress on Desalination and Water Reuse 2015/San Diego, CA, USAREF: IDAWC15- Chehayeb 51572Page - 6 - of 16
Gained Output Ratio, GOR Feed salinity [ppt]150200Figure 2: Variation of GOR with feed salinity for a single-stage system and a two-stage system ofthe same size.70Increase in GOR [%]6050403020100050100Feed salinity [ppt]150200Figure 3: Variation of the improvement in GOR with feed salinity when going from a single-stagesystem to a two-stage system of the same size.The International Desalination Association World Congress on Desalination and Water Reuse 2015/San Diego, CA, USAREF: IDAWC15- Chehayeb 51572Page - 7 - of 16
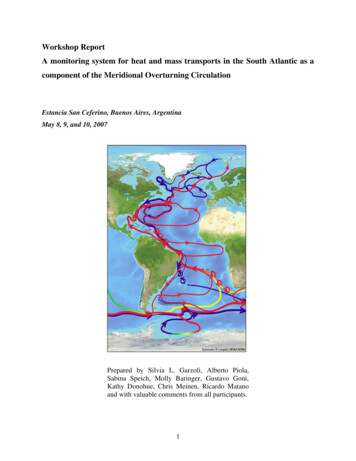
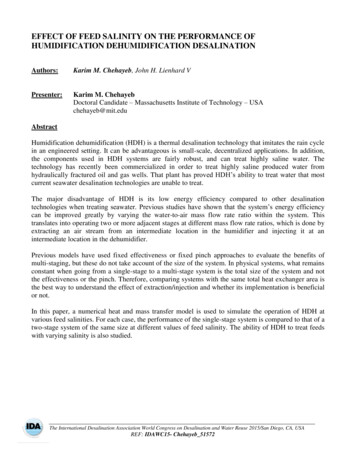
Figure 4 shows the effect of a single air extraction on the recovery ratio. It can be seen that the recoveryratio is not a strong function of salinity. It remains constant at around 7.5% for the single-stage system,and decreases form 8.3% to 7.9% for the two-stage system when the salinity is increased from 0 to 200ppt. As was shown in previous studies [11, 14, 24], the effect of multi-staging has a much higher impacton the energy efficiency than on the water recovery.8.5Recovery Ratio, RR [-]87.576.56two-stagesingle-stage5.55050100150Feed salinity [ppt]200Figure 4: Variation of the recovery ratio, RR, with the feed salinity for a single-stage system and atwo-stage system of the same size.3.2Reduced Effect of Salinity on Vapor PressureAs explained in Section 2, salinity affects many properties of water, thus affecting the performance of anHDH system. The most important effect of salinity is that it decreases the vapor pressure of water in thehumidifier where the air is in direct contact with saline water. This decrease in vapor pressure decreasesthe humidity ratio that saturated air can achieve. It is therefore expected that the amount of water carriedby the air decreases with increasing salinity. However, in the case of a packed-bed humidifier, the aircan reach supersaturation, with the water content above saturation condensing and remaining in the airstream in the form of fine mist. This phenomenon can be seen above the cooling towers used in powerplants where the high content of mist gives the discharged air stream its white color.According to Kloppers and Kröger [26], once the air in the humidifier reaches supersaturation it willremain supersaturated until it exits the humidifier. This means that the water that can be carried by theair stream is not limited by the saturation curve, and that the additional water content will only condensewhen it enters the dehumidifier.Figure 5 shows the temperature profile of the different streams under optimal operating conditions at afeed salinity of 100 ppt. As proposed by McGovern et al. [10], the specific enthalpy is expressed per unitmass of dry air so that all the curves can be superposed on the same graph. It can be seen that the air inThe International Desalination Association World Congress on Desalination and Water Reuse 2015/San Diego, CA, USAREF: IDAWC15- Chehayeb 51572Page - 8 - of 16
Temperature, T [ C]the humidifier does not follow the saturation curve corresponding to 100 ppt and that it is in factsupersaturated. It follows a path that is close to that followed by the air in the dehumidifier, which issaturated and in contact with pure water in the bubble column. The air exits the humidifier with somewater content in the form of mist, which is condensed as soon as it enters the dehumidifier. This meansthat the lower vapor pressure does not limit the water content that can be carried by the air, and its onlyeffect is that it decreases the driving force to mass transfer in the humidifier, reducing the ter in humidifierSaturated air at 100 pptAir in humidifierAir in dehumidifierWater in dehumidifier0200400600800Specific enthalpy, h [kJ/kg da]1000Figure 5: Temperature-enthalpy profile of a single-stage system with a feed salinity of 100 ppt.3.3 Ability of HDH to Respond to Varying SalinityThis section examines the ability of HDH to respond to varying feed salinity, which is relevant totreating water from hydraulically fractured wells. As the age of the well increases, so does the salinity ofthe produced water [31].Figure 6 shows that the optimal water-to-air mass flow rate ratio, MR, for this system goes from 4.2 to4.8 when the salinity goes from 0 to 200 ppt, where𝑚̇wMR 𝑚̇daFigure 7 shows the variation of the GOR of two systems with feed salinity. The first system adjusts itsmass flow rate ratio to maintain optimal energy efficiency regardless of the feed salinity. It operatesunder the values of the mass flow rate ratio shown in Fig. 6. The second system always operates at themass flow rate ratio that yields optimal performance only at 100 ppt (MR 4.5). The two systems yielda very similar performance, and it is clear that there is very little loss in GOR by not operating under avarying mass flow rate ratio. The effect of varying feed salinity on the performance of the system isThe International Desalination Association World Congress on Desalination and Water Reuse 2015/San Diego, CA, USAREF: IDAWC15- Chehayeb 51572Page - 9 - of 16
much smaller than that of the top and bottom temperatures, as reported in [24]. This makes HDHsuitable for applications where the feed salinity varies greatly such as treating produced water fromshale wells.Optimal mass flow rate ratio, MR[kg w/kg da]876543210050100150Feed salinity [ppt]200Figure 6: Variation of the optimal water-to-air mass flow rate ratio, MR, with the feed salinity.Gained Output Ratio, GOR [-]32.521.51varied MRfixed MR0.50050100150Feed salinity [ppt]200Figure 7: Effect of salinity on the performance of (a) a system with an optimal mass flow rateratio, and (b) a system with its mass flow rate ratio fixed at the optimal for 100 ppt.The International Desalination Association World Congress on Desalination and Water Reuse 2015/San Diego, CA, USAREF: IDAWC15- Chehayeb 51572Page - 10 - of 16
IV.CONCLUSIONSIn this paper the operation of a humidification dehumidification system under varying feed salinity ismodeled. The following conclusions are reached:-V.It is beneficial to implement a variation of the mass flow rate ratio through extraction/injectioneven at high salinity.The negative effects of rising salinity on GOR are reduced because air in the humidifier canreach a supersaturated state that is not limited by the water content at saturation.HDH is suitable for operation under varying feed salinity because the optimal mass flow rateratio is not a strong function of feed salinity.ACKNOWLEDGEMENTSWe would like to thank the King Fahd University of Petroleum and Minerals for funding the researchreported in this paper through the Center for Clean Water and Clean Energy at MIT and KFUPM(Project #R4-CW-08). In addition, we would like to thank Gregory Thiel for providing the MATLABimplementation of the aqueous sodium chloride properties.VI.APPENDIX6.1Bubble Column Dehumidifier ModelThe bubble column dehumidifier is modeled using Tow and Lienhard’s model [20]. The equations usedin the model are the following:A water mass balance:𝑚̇cond,out 𝑚̇cond,in 𝑚̇da (𝜔in 𝜔out )where 𝑚̇cond,out is the mass flow rate of the condensate leaving the bubble column, and 𝑚̇da is that ofthe dry air. 𝜔 is the humidity ratio.An energy balance:𝑚̇da (ℎa,in ℎa,out ) 𝑚̇cond,in ℎcond,in 𝑚̇cond,out ℎcond,out 𝑚̇w (ℎw,out ℎw,in ) 𝑄̇where ℎa is the enthalpy of the moist air, and ℎw is that of the saline water.The heat transferred to the water stream can be calculated as follows:𝑄̇ Δ𝑇lm𝑅in 𝑅outwhere the logarithmic mean temperature difference is defined as:The International Desalination Association World Congress on Desalination and Water Reuse 2015/San Diego, CA, USAREF: IDAWC15- Chehayeb 51572Page - 11 - of 16
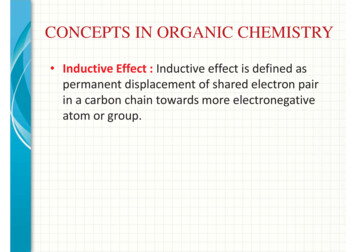
Δ𝑇lm 𝑇w,out 𝑇w,in𝑇 𝑇ln (𝑇 col 𝑇 w,in )colw,outand 𝑇col is the column temperature.6.2Packed-bed Humidifier ModelThe equations used in the model presented by Kloppers and Kröger [18, 26] are summarized as follows:The Lewis factor according to Bosnjakovic [32]:𝜔sw 0.622𝜔sw 0.622 1𝐿𝑒f 0.8650.667 ( 1) [ln ()]𝜔sa 0.622𝜔sa 0.622The governing equations for supersaturation:Χ ℎa,sw ℎa,ss (𝐿𝑒f 1)[ℎa,sw ℎa,ss (𝜔sw 𝜔sa )ℎv (𝜔sa 𝜔)𝑐p,w 𝑇w ] (𝜔sw 𝜔)𝑐p,w 𝑇w(𝜔sw 𝜔sa )𝑐p,w 𝑇w𝑑ℎa 𝑚̇w 𝑐p,w (1 )𝑑𝑇w𝑚̇aΧ𝑚̇w 𝑐p,w 𝜔sw 𝜔sa𝑑𝜔 ()𝑑𝑇w𝑚̇aΧ𝑑𝑀𝑒 𝑐p,w 𝑑𝑇wΧThe subscript ‘sa’ means that the property is evaluated at saturation at the air temperature, and thesubscript ‘ss’ denotes supersaturation.The solution algorithm is presented in Fig. 8 below.The International Desalination Association World Congress on Desalination and Water Reuse 2015/San Diego, CA, USAREF: IDAWC15- Chehayeb 51572Page - 12 - of 16
Figure 8: Solution algorithm for the humidifier model [17].The International Desalination Association World Congress on Desalination and Water Reuse 2015/San Diego, CA, USAREF: IDAWC15- Chehayeb 51572Page - 13 - of 16
6.3Single-stage System Solution AlgorithmThe solution algorithm for the single-stage system consists of simply coupling a humidifier and adehumidifier. Given that the top and bottom air temperatures are not known, the dehumidifier and thehumidifier cannot be simulated independently. The bottom air temperature is guessed, the humidifier isthen simulated and the top air temperature is calculated. The dehumidifier is then simulated and thelower air temperature is updated. The procedure is repeated until the error on the bottom air temperatureis small enough.6.4Two-stage System Solution AlgorithmFigure 9: Solution algorithm for the two-stage system [17].The International Desalination Association World Congress on Desalination and Water Reuse 2015/San Diego, CA, USAREF: IDAWC15- Chehayeb 51572Page - 14 - of 16
VII.REFERENCES[1] G. P. Narayan and J. H. Lienhard V, "Thermal Design of Humidification Dehumidification Systemsfor Affordable Small-scale Desalination," IDA Journal, vol. 4, pp. 24-34, 2012.[2] G. P. Narayan and J. H. Lienhard V, "Humidification-dehumidification desalination," inDesalination: Water from Water, Salem, MA, Wiley-Scrivener, 2014.[3] P. G. Narayan, M. H. Sharqawy, E. K. Summers, J. H. Lienhard V, S. M. Zubair and M. A. Antar,"The potential of solar-driven humidification-dehumidification desalination for small-scaledecentralized water production," Renewable and Sustainable Energy Reviews, vol. 14, pp. 11871201, 2010.[4] T. Pankratz, "HDH tackles brine disposal challenge," Water desalination report, pp. 2-3, 6 May2014.[5] G. P. Narayan, J. H. Lienhard V and S. M. Zubair, "Entropy generation minimization of combinedheat and mass transfer," International Journal of Thermal Sciences, vol. 49, pp. 2057-66, 2010.[6] G. P. Narayan, M. H. Sharqawy, J. H. Lienhard V and S. M. Zubair, "Thermodynamic analysis ofhumidification-dehumidification desalination cycles," Desalination and Water Treatment, vol. 16,pp. 339-353, 2010.[7] G. P. Narayan, K. H. Mistry, M. H. Sharqawy, S. M. Zubair and J. H. Lienhard V, "EnergyEffectiveness of Simultaneous Heat and Mass Exchange Devices," Frontiers in Heat and MassTransfer, vol. 1, pp. 1-13, 2010.[8] H. Muller-Holst, "Solar thermal desalination using the Multiple Effect Humidification (MEH)method in Solar Desalination for the 21st Century," in NATO Security through Science Series,Springer, Dordrecht, 2007, pp. 215-25.[9] M. Zamen, S. M. Soufari and M. Amidpour, "Improvement of Solar HumdificationDehumidification Desalination Using Multi-Stage Process," Chemical Engineering Transactions,vol. 25, pp. 1091-1096, 2011.[10] R. K. McGovern, G. P. Thiel, G. P. Narayan, S. M. Zubair and J. H. Lienhard V, "PerformanceLimits of zero and single extraction Humidification Dehumidification Desalination Systems,"Applied Energy, vol. 102, pp. 1081-1090, 2013.[11] G. P. Narayan, K. M. Chehayeb, R. K. McGovern, G. P. Thiel, S. M. Zubair and J. H. Lienhard V,"Thermodynamic balancing of the humidification dehumidification desalination system by massextraction and injection," International Journal of Heat and Mass Transfer, vol. 57, no. 2, pp. 756770, 2013.[12] J. A. Miller and J. H. Lienhard V, "Impact of extraction on a humidification dehumidificationdesalination system," Desalination, vol. 313, pp. 87-96, 2013.[13] G. P. Thiel, J. A. Miller, S. M. Zubair and J. H. Lienhard V, "Effect of mass extractions andinjections on the performance of a fixed-size humidification–dehumidification desalinationsystem," Desalination, vol. 314, pp. 50-58, 2013.[14] K. M. Chehayeb, G. P. Narayan, S. M. Zubair and J. H. Lienhard V, "Use of multiple extractionsand injections to thermodynamically balance the humidification dehumidification desalinationsystem," International Journal of Heat and Mass Transfer, vol. 68, pp. 422-434, 2014.[15] G. P. Narayan, M. G. St. John, S. M. Zubair and J. H. Lienhard V, "Thermal design of thehumidification dehumidification desalination system: An experimental investigation," InternationalJournal of Heat and Mass Transfer, vol. 58, pp. 740-748, 2013.The International Desalination Association World Congress on Desalination and Water Reuse 2015/San Diego, CA, USAREF: IDAWC15- Chehayeb 51572Page - 15 - of 16
[16] K. M. Chehayeb, G. P. Narayan, S. M. Zubair and J. H. Lienhard V, "Thermodynamic balancing ofa fixed-size two-stage humidification dehumidification desalination system," Desalination, vol.369, pp. 125-139, 2015.[17] K. M. Chehayeb, Numerical fixed-effectiveness and fixed-area models of the humidificationdehumidification desalination system with air extractions and injections, Master’s thesis,Cambridge: Massachusetts Institute of Technology, 2014.[18] J. C. Kloppers, A critical evaluation and refinement of the performance prediction of wet-coolingtowers, PhD thesis, Stellenbosch: University of Stellenbosch, 2003.[19] G. P. Narayan, M. H. Sharqawy, S. Lam, S. K. Das and J. H. Lienhard V, "Bubble columns forcondensation at high c
The International Desalination Association World Congress on Desalination and Water Reuse 2015/San Diego, CA, USA REF: IDAWC15- Chehayeb_51572 Page - 2 - of 16 I. INTRODUCTION Humidification dehumidification (HDH) is a thermal desalination technology that can be advantageous in small scale, decentralized applications [1, 2, 3].