Transcription
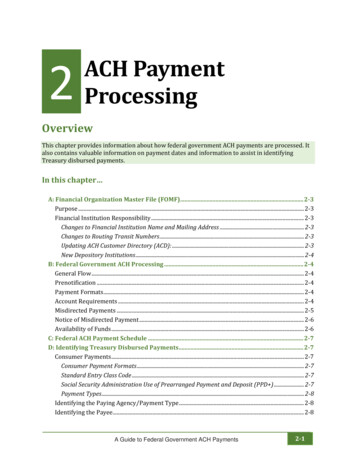
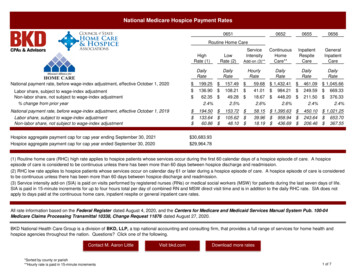
National Medicare Hospice Payment patientCareDailyRateDailyRateRoutine Home CareNational payment rate, before wage-index adjustment, effective October 1, 2020Labor share, subject to wage-index adjustmentNon-labor share, not subject to wage-index adjustment% change from prior yearNational payment rate, before wage-index adjustment, effective October 1, 2019Labor share, subject to wage-index adjustmentNon-labor share, not subject to wage-index adjustmentHospice aggregate payment cap for cap year ending September 30, 2021Hospice aggregate payment cap for cap year ended September 30, 2020HighRate (1)LowRate eAdd-on (3)**Care**HourlyRateDailyRate 199.25 136.90 62.35 2.4%157.49 108.21 49.28 2.5%59.68 1,432.41 41.01 984.21 18.67 448.20 2.6%2.6%461.09 1,045.66249.59 669.33211.50 376.332.4%2.4% 50.10243.64206.46 1,395.63 958.94 436.69 1,021.25 653.70 367.55 30,683.93 29,964.78(1) Routine home care (RHC) high rate applies to hospice patients whose services occur during the first 60 calendar days of a hospice episode of care. A hospiceepisode of care is considered to be continuous unless there has been more than 60 days between hospice discharge and readmission.(2) RHC low rate applies to hospice patients whose services occur on calendar day 61 or later during a hospice episode of care. A hospice episode of care is consideredto be continuous unless there has been more than 60 days between hospice discharge and readmission.(3) Service intensity add-on (SIA) is paid on visits performed by registered nurses (RNs) or medical social workers (MSW) for patients during the last seven days of life.SIA is paid in 15-minute increments for up to four hours total per day of combined RN and MSW direct visit time and is in addition to the daily RHC rate. SIA does notapply to days paid at the continuous home care, inpatient respite or general inpatient care rates.All rate information based on the Federal Register dated August 4, 2020, and the Centers for Medicare and Medicaid Services Manual System Pub. 100-04Medicare Claims Processing Transmittal 10338, Change Request 11876 dated August 27, 2020.BKD National Health Care Group is a division of BKD, LLP, a top national accounting and consulting firm, that provides a full range of services for home health andhospice agencies throughout the nation. Questions? Click one of the following.Contact M. Aaron Little*Sorted by county or parish**Hourly rate is paid in 15-minute incrementsVisit bkd.comDownload more rates1 of 7
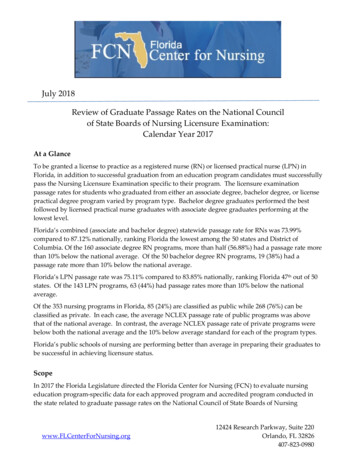
Missouri Wage-Index Adjusted Medicare Hospice Payment RatesEffective October 1, 2020 Through September 30, atientCareDailyRateDailyRateRoutine Home CareBillingCodeCore-Based Statistical Area41140 St. JosephCounty or Parish*StateAndrewMOAfter 2% reduction for sequestration% change from prior yearPrior year comparison, after 2% reduction for sequestration28140 Kansas CityBatesMOAfter 2% reduction for sequestration% change from prior yearPrior year comparison, after 2% reduction for sequestration16020 Cape GirardeauBollingerMOAfter 2% reduction for sequestration% change from prior yearPrior year comparison, after 2% reduction for sequestration17860 ColumbiaBooneMOAfter 2% reduction for sequestration% change from prior yearPrior year comparison, after 2% reduction for sequestration41140 St. JosephBuchananMOAfter 2% reduction for sequestration% change from prior yearPrior year comparison, after 2% reduction for sequestration28140 Kansas CityCaldwellMOAfter 2% reduction for sequestration% change from prior yearPrior year comparison, after 2% reduction for sequestration*Sorted by county or parish**Hourly rate is paid in 15-minute incrementsWageIndexHighRate (1)LowRate eAdd-on (3)**Care**HourlyRateHourlyRate0.9472 -0.2%192.02 188.18 2.3%151.78 148.74 2.3%57.51 56.36 2.5%57.52 56.37 2.5%447.91 1,010.32438.95 990.112.3%2.3%0.9491 183.95145.3755.0055.00428.950.9125 -2.4%187.27 183.52 0.8%148.02 145.06 0.8%56.09 54.97 1.0%0.9351 182.11143.9354.450.8019 0.0%172.13 168.69 2.5%136.05 133.33 2.5%51.56 50.53 2.7%0.8015 164.61130.1049.220.8359 -0.4%176.78 173.24 2.2%139.73 136.94 2.2%52.95 51.89 2.4%0.8391 169.54134.0050.690.9472 -0.2%192.02 188.18 2.3%151.78 148.74 2.3%57.51 56.36 2.5%57.52 56.37 2.5%447.91 1,010.32438.95 990.112.3%2.3%0.9491 183.95145.3755.0055.00428.950.9125 -2.4%187.27 183.52 0.8%148.02 145.06 0.8%56.09 54.97 1.0%0.9351 182.11143.9354.45 968.2256.10 54.98 1.0%439.25 430.47 1.1%987.09967.350.8%54.45425.60 959.2451.56 50.53 2.7%411.65 403.42 2.5%913.07894.812.4%49.22393.71 873.6652.95 51.89 2.4%420.13 411.73 2.2%935.82917.102.2%50.69402.68897.75 968.2256.10 54.98 1.0%439.25 430.47 1.1%987.09967.350.8%54.45425.60959.24 2 of 7
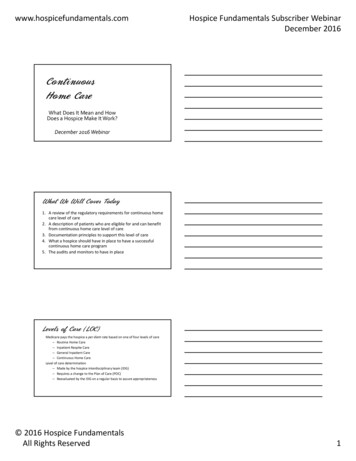
Missouri Wage-Index Adjusted Medicare Hospice Payment RatesEffective October 1, 2020 Through September 30, atientCareDailyRateDailyRateRoutine Home CareBillingCodeCore-Based Statistical Area27620 Jefferson CityCounty or Parish*StateCallawayMOAfter 2% reduction for sequestration% change from prior yearPrior year comparison, after 2% reduction for sequestration16020 Cape GirardeauCape GirardeauMOAfter 2% reduction for sequestration% change from prior yearPrior year comparison, after 2% reduction for sequestration28140 Kansas CityCassMOAfter 2% reduction for sequestration% change from prior yearPrior year comparison, after 2% reduction for sequestration44180 SpringfieldChristianMOAfter 2% reduction for sequestration% change from prior yearPrior year comparison, after 2% reduction for sequestration28140 Kansas CityClayMOAfter 2% reduction for sequestration% change from prior yearPrior year comparison, after 2% reduction for sequestration28140 Kansas CityClintonMOAfter 2% reduction for sequestration% change from prior yearPrior year comparison, after 2% reduction for sequestration*Sorted by county or parish**Hourly rate is paid in 15-minute incrementsWageIndexHighRate (1)LowRate eAdd-on (3)**Care**HourlyRateHourlyRate0.8270 -1.7%175.57 172.06 1.3%138.77 135.99 1.3%52.59 51.54 1.5%52.59 51.54 1.5%417.91 409.55 1.6%929.87911.271.4%0.8411 169.79134.2050.7650.76403.16 899.030.8019 0.0%172.13 168.69 2.5%136.05 133.33 2.5%51.56 50.53 2.7%51.56 50.53 2.7%411.65 403.42 2.5%913.07894.812.4%0.8015 164.61130.1049.2249.22393.71 873.660.9125 -2.4%187.27 183.52 0.8%148.02 145.06 0.8%56.09 54.97 1.0%56.10 54.98 1.0%439.25 430.47 1.1%987.09967.350.8%0.9351 182.11143.9354.4554.45425.60 959.240.8000 0.0%171.87 168.43 2.4%135.85 133.13 2.4%51.48 50.45 2.6%51.48 50.45 2.6%411.17 402.95 2.4%911.79893.552.4%0.8000 164.41129.9549.1649.16393.34 872.700.9125 -2.4%187.27 183.52 0.8%148.02 145.06 0.8%56.09 54.97 1.0%56.10 54.98 1.0%439.25 430.47 1.1%987.09967.350.8%0.9351 182.11143.9354.4554.45425.60 959.240.9125 -2.4%187.27 183.52 0.8%148.02 145.06 0.8%56.09 54.97 1.0%56.10 54.98 1.0%439.25 430.47 1.1%987.09967.350.8%0.9351 182.11143.9354.4554.45425.60959.24 3 of 7
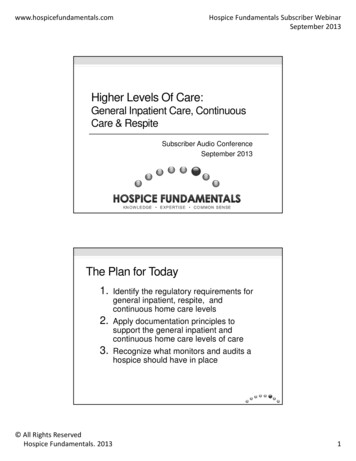
Missouri Wage-Index Adjusted Medicare Hospice Payment RatesEffective October 1, 2020 Through September 30, atientCareDailyRateDailyRateRoutine Home CareBillingCodeCore-Based Statistical Area27620 Jefferson CityCounty or Parish*StateColeMOAfter 2% reduction for sequestration% change from prior yearPrior year comparison, after 2% reduction for sequestration17860 Columbia99926CooperMOAfter 2% reduction for sequestration% change from prior yearPrior year comparison, after 2% reduction for sequestration44180 SpringfieldDallasMOAfter 2% reduction for sequestration% change from prior yearPrior year comparison, after 2% reduction for sequestration41140 St. JosephDe KalbMOAfter 2% reduction for sequestration% change from prior yearPrior year comparison, after 2% reduction for sequestration41180 St. LouisFranklinMOAfter 2% reduction for sequestration% change from prior yearPrior year comparison, after 2% reduction for sequestration44180 SpringfieldGreeneMOAfter 2% reduction for sequestration% change from prior yearPrior year comparison, after 2% reduction for sequestration*Sorted by county or parish**Hourly rate is paid in 15-minute incrementsWageIndexHighRate (1)LowRate eAdd-on (3)**Care**HourlyRateHourlyRate0.8270 -1.7%175.57 172.06 1.3%138.77 135.99 1.3%52.59 51.54 1.5%52.59 51.54 1.5%417.91 409.55 1.6%929.87911.271.4%0.8411 169.79134.2050.7650.76403.16 899.030.8359 4.5%176.78 173.24 5.4%139.73 136.94 5.4%52.95 51.89 5.6%52.95 51.89 5.6%420.13 411.73 4.7%935.82917.105.1%0.8000 164.41129.9549.1649.16393.34 872.700.8000 0.0%171.87 168.43 2.4%135.85 133.13 2.4%51.48 50.45 2.6%51.48 50.45 2.6%411.17 402.95 2.4%911.79893.552.4%0.8000 164.41129.9549.1649.16393.34872.700.9472 -0.2%192.02 188.18 2.3%151.78 148.74 2.3%57.51 56.36 2.5%57.52 56.37 2.5%447.91 1,010.32438.95 990.112.3%2.3%0.9491 183.95145.3755.0055.00428.950.9317 -0.8%189.90 186.10 1.9%150.10 147.10 1.9%56.88 55.74 2.1%0.9389 182.60144.3254.600.8000 0.0%171.87 168.43 2.4%135.85 133.13 2.4%51.48 50.45 2.6%0.8000 164.41129.9549.16 968.2256.88 55.74 2.1%444.04 435.16 2.0%999.94979.941.9%54.60426.51 961.6851.48 50.45 2.6%411.17 402.95 2.4%911.79893.552.4%49.16393.34872.70 4 of 7
Missouri Wage-Index Adjusted Medicare Hospice Payment RatesEffective October 1, 2020 Through September 30, atientCareDailyRateDailyRateRoutine Home CareBillingCodeCore-Based Statistical Area17860 Columbia99926County or Parish*StateHowardMOAfter 2% reduction for sequestration% change from prior yearPrior year comparison, after 2% reduction for sequestration28140 Kansas CityJacksonMOAfter 2% reduction for sequestration% change from prior yearPrior year comparison, after 2% reduction for sequestration27900 JoplinJasperMOAfter 2% reduction for sequestration% change from prior yearPrior year comparison, after 2% reduction for sequestration41180 St. LouisJeffersonMOAfter 2% reduction for sequestration% change from prior yearPrior year comparison, after 2% reduction for sequestration28140 Kansas CityLafayetteMOAfter 2% reduction for sequestration% change from prior yearPrior year comparison, after 2% reduction for sequestration41180 St. LouisLincolnMOAfter 2% reduction for sequestration% change from prior yearPrior year comparison, after 2% reduction for sequestration*Sorted by county or parish**Hourly rate is paid in 15-minute incrementsWageIndexHighRate (1)LowRate eAdd-on (3)**Care**HourlyRateHourlyRate0.8359 4.5%176.78 173.24 5.4%139.73 136.94 5.4%52.95 51.89 5.6%52.95 51.89 5.6%420.13 411.73 4.7%935.82917.105.1%0.8000 164.41129.9549.1649.16393.34 872.700.9125 -2.4%187.27 183.52 0.8%148.02 145.06 0.8%56.09 54.97 1.0%56.10 54.98 1.0%439.25 430.47 1.1%987.09967.350.8%0.9351 182.11143.9354.4554.45425.60 959.240.8000 0.0%171.87 168.43 2.4%135.85 133.13 2.4%51.48 50.45 2.6%51.48 50.45 2.6%411.17 402.95 2.4%911.79893.552.4%0.8000 164.41129.9549.1649.16393.34 872.700.9317 -0.8%189.90 186.10 1.9%150.10 147.10 1.9%56.88 55.74 2.1%56.88 55.74 2.1%444.04 435.16 2.0%999.94979.941.9%0.9389 182.60144.3254.6054.60426.51 961.680.9125 -2.4%187.27 183.52 0.8%148.02 145.06 0.8%56.09 54.97 1.0%56.10 54.98 1.0%439.25 430.47 1.1%987.09967.350.8%0.9351 182.11143.9354.4554.45425.60 959.240.9317 -0.8%189.90 186.10 1.9%150.10 147.10 1.9%56.88 55.74 2.1%56.88 55.74 2.1%444.04 435.16 2.0%999.94979.941.9%0.9389 182.60144.3254.6054.60426.51961.68 5 of 7
Missouri Wage-Index Adjusted Medicare Hospice Payment RatesEffective October 1, 2020 Through September 30, atientCareDailyRateDailyRateRoutine Home CareBillingCodeCore-Based Statistical Area27620 Jefferson CityCounty or Parish*StateMoniteauMOAfter 2% reduction for sequestration% change from prior yearPrior year comparison, after 2% reduction for sequestration27900 JoplinNewtonMOAfter 2% reduction for sequestration% change from prior yearPrior year comparison, after 2% reduction for sequestration27620 Jefferson CityOsageMOAfter 2% reduction for sequestration% change from prior yearPrior year comparison, after 2% reduction for sequestration28140 Kansas CityPlatteMOAfter 2% reduction for sequestration% change from prior yearPrior year comparison, after 2% reduction for sequestration44180 SpringfieldPolkMOAfter 2% reduction for sequestration% change from prior yearPrior year comparison, after 2% reduction for sequestration28140 Kansas CityRayMOAfter 2% reduction for sequestration% change from prior yearPrior year comparison, after 2% reduction for sequestration*Sorted by county or parish**Hourly rate is paid in 15-minute incrementsWageIndexHighRate (1)LowRate eAdd-on (3)**Care**HourlyRateHourlyRate0.8270 -1.7%175.57 172.06 1.3%138.77 135.99 1.3%52.59 51.54 1.5%52.59 51.54 1.5%417.91 409.55 1.6%929.87911.271.4%0.8411 169.79134.2050.7650.76403.16 899.030.8000 0.0%171.87 168.43 2.4%135.85 133.13 2.4%51.48 50.45 2.6%51.48 50.45 2.6%411.17 402.95 2.4%911.79893.552.4%0.8000 164.41129.9549.1649.16393.34 872.700.8270 -1.7%175.57 172.06 1.3%138.77 135.99 1.3%52.59 51.54 1.5%52.59 51.54 1.5%417.91 409.55 1.6%929.87911.271.4%0.8411 169.79134.2050.7650.76403.16 899.030.9125 -2.4%187.27 183.52 0.8%148.02 145.06 0.8%56.09 54.97 1.0%56.10 54.98 1.0%439.25 430.47 1.1%987.09967.350.8%0.9351 182.11143.9354.4554.45425.60 959.240.8000 0.0%171.87 168.43 2.4%135.85 133.13 2.4%51.48 50.45 2.6%51.48 50.45 2.6%411.17 402.95 2.4%911.79893.552.4%0.8000 164.41129.9549.1649.16393.34 872.700.9125 -2.4%187.27 183.52 0.8%148.02 145.06 0.8%56.09 54.97 1.0%56.10 54.98 1.0%439.25 430.47 1.1%987.09967.350.8%0.9351 182.11143.9354.4554.45425.60959.24 6 of 7
Missouri Wage-Index Adjusted Medicare Hospice Payment RatesEffective October 1, 2020 Through September 30, atientCareDailyRateDailyRateRoutine Home CareBillingCodeCore-Based Statistical Area41180 St. LouisCounty or Parish*StateSt. CharlesMOAfter 2% reduction for sequestration% change from prior yearPrior year comparison, after 2% reduction for sequestration41180 St. LouisSt. LouisMOAfter 2% reduction for sequestration% change from prior yearPrior year comparison, after 2% reduction for sequestration41180 St. LouisSt. Louis CityMOAfter 2% reduction for sequestration% change from prior yearPrior year comparison, after 2% reduction for sequestration41180 St. LouisWarrenMOAfter 2% reduction for sequestration% change from prior yearPrior year comparison, after 2% reduction for sequestration44180 SpringfieldWebsterMOAfter 2% reduction for sequestration% change from prior yearPrior year comparison, after 2% reduction for sequestration99926 Rural MissouriAll Other CountiesMOAfter 2% reduction for sequestration% change from prior yearPrior year comparison, after 2% reduction for sequestration*Sorted by county or parish**Hourly rate is paid in 15-minute incrementsWageIndexHighRate (1)LowRate eAdd-on (3)**Care**HourlyRateHourlyRate0.9317 -0.8%189.90 186.10 1.9%150.10 147.10 1.9%56.88 55.74 2.1%56.88 55.74 2.1%444.04 435.16 2.0%999.94979.941.9%0.9389 182.60144.3254.6054.60426.51 961.680.9317 -0.8%189.90 186.10 1.9%150.10 147.10 1.9%56.88 55.74 2.1%56.88 55.74 2.1%444.04 435.16 2.0%999.94979.941.9%0.9389 182.60144.3254.6054.60426.51 961.680.9317 -0.8%189.90 186.10 1.9%150.10 147.10 1.9%56.88 55.74 2.1%56.88 55.74 2.1%444.04 435.16 2.0%999.94979.941.9%0.9389 182.60144.3254.6054.60426.51 961.680.9317 -0.8%189.90 186.10 1.9%150.10 147.10 1.9%56.88 55.74 2.1%56.88 55.74 2.1%444.04 435.16 2.0%999.94979.941.9%0.9389 182.60144.3254.6054.60426.51 961.680.8000 0.0%171.87 168.43 2.4%135.85 133.13 2.4%51.48 50.45 2.6%51.48 50.45 2.6%411.17 402.95 2.4%911.79893.552.4%0.8000 164.41129.9549.1649.16393.34 872.700.8000 0.0%171.87 168.43 2.4%135.85 133.13 2.4%51.48 50.45 2.6%51.48 50.45 2.6%411.17 402.95 2.4%911.79893.552.4%0.8000 164.41129.9549.1649.16393.34872.70 7 of 7
Routine Home Care Service Continuous Inpatient General High Low Intensity Home Respite Inpatient Rate (1) Rate (2) Add-on (3)** Care** Care Care Billing Wage-Daily Daily Hourly Hourly Daily Daily Code Core-Based Statistical Area County or Parish* State Index Rate 41140 St. Joseph Andrew