Transcription
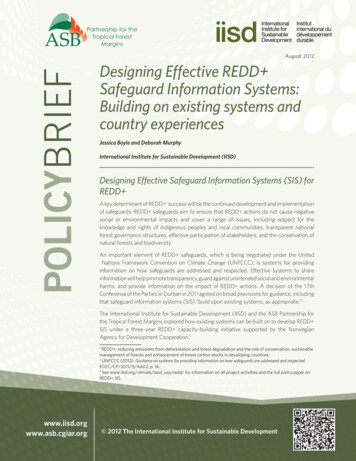
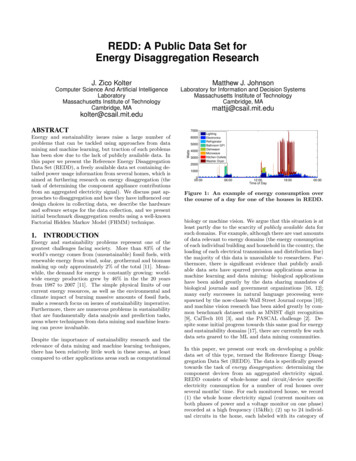
REDD: A Public Data Set forEnergy Disaggregation ResearchJ. Zico KolterMatthew J. JohnsonComputer Science And Artificial IntelligenceLaboratoryMassachusetts Institute of TechnologyCambridge, MALaboratory for Information and Decision SystemsMassachusetts Institute of TechnologyCambridge, 1. INTRODUCTIONEnergy and sustainability problems represent one of thegreatest challenges facing society. More than 83% of theworld’s energy comes from (unsustainable) fossil fuels, withrenewable energy from wind, solar, geothermal and biomassmaking up only approximately 2% of the total [11]. Meanwhile, the demand for energy is constantly growing: worldwide energy production grew by 46% in the the 20 yearsfrom 1987 to 2007 [11]. The simple physical limits of ourcurrent energy resources, as well as the environmental andclimate impact of burning massive amounts of fossil fuels,make a research focus on issues of sustainability imperative.Furthermore, there are numerous problems in sustainabilitythat are fundamentally data analysis and prediction tasks,areas where techniques from data mining and machine learning can prove invaluable.Despite the importance of sustainability research and therelevance of data mining and machine learning techniques,there has been relatively little work in these areas, at leastcompared to other applications areas such as computational700060005000WattsEnergy and sustainability issues raise a large number ofproblems that can be tackled using approaches from datamining and machine learning, but traction of such problemshas been slow due to the lack of publicly available data. Inthis paper we present the Reference Energy DisaggregationData Set (REDD), a freely available data set containing detailed power usage information from several homes, which isaimed at furthering research on energy disaggregation (thetask of determining the component appliance contributionsfrom an aggregated electricity signal). We discuss past approaches to disaggregation and how they have influenced ourdesign choices in collecting data, we describe the hardwareand software setups for the data collection, and we presentinitial benchmark disaggregation results using a well-knownFactorial Hidden Markov Model (FHMM) athroom GFIDishwaserMicrowaveKitchen OutletsWasher Dryer20001000000:0006:0012:00Time of Day18:0000:00Figure 1: An example of energy consumption overthe course of a day for one of the houses in REDD.biology or machine vision. We argue that this situation is atleast partly due to the scarcity of publicly available data forsuch domains. For example, although there are vast amountsof data relevant to energy domains (the energy consumptionof each individual building and household in the country, theloading of each electrical transmission and distribution line)the majority of this data is unavailable to researchers. Furthermore, there is significant evidence that publicly available data sets have spurred previous applications areas inmachine learning and data mining: biological applicationshave been aided greatly by the data sharing mandates ofbiological journals and government organizations [16, 12];many early successes in natural language processing werespawned by the now-classic Wall Street Journal corpus [10];and machine vision research has been aided greatly by common benchmark datasest such as MNIST digit recognition[9], CalTech 101 [3], and the PASCAL challenge [2]. Despite some initial progress towards this same goal for energyand sustainability domains [17], there are currently few suchdata sets geared to the ML and data mining communities.In this paper, we present our work on developing a publicdata set of this type, termed the Reference Energy Disaggregation Data Set (REDD). The data is specifically gearedtowards the task of energy disaggregation: determining thecomponent devices from an aggregated electricity signal.REDD consists of whole-home and circuit/device specificelectricity consumption for a number of real houses overseveral months’ time. For each monitored house, we record(1) the whole home electricity signal (current monitors onboth phases of power and a voltage monitor on one phase)recorded at a high frequency (15kHz); (2) up to 24 individual circuits in the home, each labeled with its category of
appliance or appliances, recorded at 0.5 Hz; (3) up to 20plug-level monitors in the home, recorded at 1 Hz, with afocus on logging electronics devices where multiple devicesare grouped to a single circuit. An example of this type ofdata is shown in Figure 1. As of the time of writing (June15th, 2011), we have 10 homes monitored, with a total of 119days of data (combined over all homes), 268 unique monitors, and more than 1 terabyte of raw data. To the best ofour knowledge, REDD represents the largest publicly available data set for disaggregation with the true loads of eachhouse identified. The entirety of the data as well as code forparsing the data and running basic algorithms is publiclyavailable on the web: http://redd.csail.mit.edu.While we present some basic results on disaggregation here,the focus of this paper is the data set itself: the designdecisions that went into the data collection, as well as thehardware and software system. We begin by presenting abrief overview of existing work on disaggregation and discuss how this influenced our choices of which data to collectfrom each home and at what frequency. We then describethe software and hardware systems we have built for thistask, and discuss their strengths and limitations. Finally,we present brief results on the data, and highlight severaldirections for future algorithmic work.2. ENERGY DISAGGREGATIONEnergy disaggregation, also referred to as a non-intrusiveload monitoring (NILM),1 is the task of using an aggregateenergy signal, such as that coming from a whole-home powermonitor, to make inferences about the different individualloads of the system. The value of this technology is thatinformation about individual appliances is much more useful to consumers than simply total electricity usage; studies have shown that user feedback of this type can inducebehavior chances that improve user efficiency by 15% [1,13]. Disaggregation technology is also seen as an intermediate between existing electricity meters (which merely recordwhole-home power usage at some frequency) and a fullyenergy-aware home appliance network, where each devicereports its consumption to a central location; an oft-statedgoal of disaggregation research is to push energy awarenessto a ubiquitous level, paving the way for more detailed energy monitoring in the future.Academic work on energy disaggregation began with thework of Hart et. al [6] in the 1980s and 1990s. The initialapproaches look for sharp edges (corresponding to deviceon/off events) in both the real and reactive power signals,and would cluster devices according to these changes in consumption. Later work has explored a number of differentdirections: using more complex device models with multiple states, integrating frequency analysis and other featuresof the AC waveforms, and making use of external featuressuch as time of day or weather conditions. A recent reviewof numerous existing techniques for energy disaggregationcan be found in [18]. In this paper, we highlight here someof the key distinctions which have characterized past workin energy disaggregation and how they have informed ourchoices for REDD.1Some authors make subtle distinctions between energy disaggregation and NILM, but for our purposes we treat theseterms as synonymous.Frequency of Measurements. Past work has spanned abroad range in terms of the frequency of energy measurements used for disaggregation: some work has used averagepower measurements over periods as long as an hour [8],while others have analyzed the harmonics of AC waveformsusing Mhz resolutions [14, 5].2 Most approaches fall somewhere in between these two extremes, with many studieseither using power readings on the order of a 1 Hz rate orAC current measurements on the order of several kilohertz.Since higher-frequency measurements can be sub-sampled toproduce lower frequency data, for our purposes of data collection it makes sense to collect data at the highest frequencypossible up to the feasibility of storing the data. We chose15kHz monitoring (for the whole-home data) as a trade-offbetween these factors.Real / Reactive Power. Past work has also differed inwhether the methods consider only the real power signal orboth the real and reactive powers.3 This decision is connected to the point above, since real and reactive powerscan be computed using measurements of the AC waveform,but reactive power is a common enough quantity to meritits own distinction. For REDD, since we are collecting theAC waveform itself, we can easily compute both real andreactive powers.Use of External Features. Some past approach use external features such as time of day, day of year, or weatherinformation, whereas some merely use the power signal itself. All data in REDD is recorded with UTC time stamps,along with general geographical information (only up to acity level, for privacy reasons), so that it can be associatedwith such external features.Supervised / Unsupervised Training. Most approachesto energy disaggregation have been supervised, in that thesystem is trained on individual device power signals (or isgiven manually identified device change-points in a wholehome energy signal). Alternatively, some recent work hasadvocated unsupervised approaches that consider the wholehome signal without labeling, and automatically separatedifferent signals [7]. To facilitate supervised approaches andto aid in evaluating all approaches, REDD includes as much“supervised” information as possible: we monitor each individual circuit in the home (especially important for largeloads that cannot be easily monitored by a plug load) as wellas many large plugs loads as is feasible.Training / Testing Generalization. Another key distinction (which has not been greatly considered in past energy disaggregation work) is generalizing from training datato test data. The vast majority of previous disaggregationapproaches (at least those with rigorous quantitative evalu2The work of Patel el al. is substantially different frommost other approaches to disaggregation, as they use highfrequency measurements to look for transients of the voltagesignal of the home, and not necessarily the current.3Since the data mining community may not be familiarwith this terminology, briefly, real power corresponds to thepower that is actual consumed by an appliance, whereas reactive power corresponds to current that flows through acircuit, but is put back into the system typically via an inductive load in the appliance. Any text on AC power willinclude a rigorous description of these quantities.
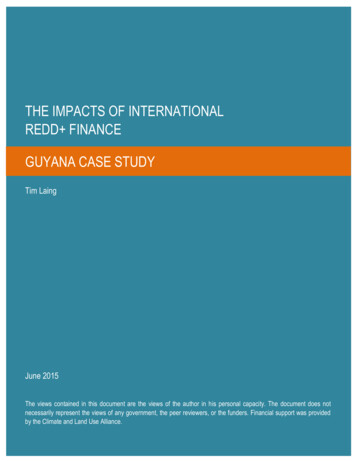
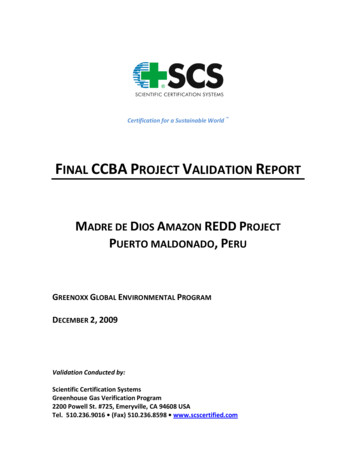
ation) have typically evaluated the algorithms on the samedevices (but in different conditions) as they were trainedon; that is, they attempt to build a model that can disaggregate a given appliance even in new conditions, but donot attempt to build models that explicitly generalize acrossmultiple different devices of the same category. In our ownpast work [8] we have considered this challenge of generalizing across multiple homes, but the data used in that workwas only available at an extremely low resolution (one hour),and was not permitted to be made publicly available, greatlylimiting the ability of researchers to directly compare to theapproach. In contrast, a goal of REDD is to consider severaldifferent homes, such that work that attempts to generalizeacross device types can be rigorously evaluated using thisdata set. As expected, and as we illustrate concretely inSection 4, generalization across homes and device categoriesmakes disaggregation a much more challenging problem.Evaluation Metrics. Finally, previous work in power disaggregation has used different metrics for evaluating performance: initial work typically focused only on on/off changesfor devices, and the natural metric here is whether or not thealgorithm can correctly classify which device is turning onor off given a change point in the whole home signal. An alternative approach is to the look at the percentage of energycorrectly classified (the original work by Hart et al., [6] considered both these metrics). The latter has the advantagethat it is more generally applicable to disaggregation tasks,since it does not rely on extracting edges in the aggregatepower signal, and applies to devices with multiple states or“smooth” power ons. This metric naturally weights highpower devices more heavily than low-power devices. Whilewe argue that this feature is often desirable, since the absolute power consumed is the ultimate quantity we ope toinfluence, the metric may indicate good performance evenwhen low-power devices are classified poorly, and in somecases these low-power devices are those over which the userhas greatest control. Thus, while we will consider the “totalenergy properly classified” metric in our experiments, REDDcan accommodate many performance metrics.3. THE REDD HARDWARE ANDSOFTWARE SYSTEMSWe developed the REDD hardware and software systemswith the considerations of the previous section in mind. Thehardware system in each house logs data from the wholehome current and voltage (at high-frequency) from each individual circuit and from selected plugs. The data is loggedboth locally and to central database, which stores information from all the houses and can be accessed via a web interface. A schematic of the system is shown in Figure 2.Figure 2: Schematic of the different components ofthe REDD hardware and software system.Figure 3: Enmetric router and Power Port, designedand built by Enmetric Systems, Inc.system as-is for the plug level data collection.Circuit-level data and whole-home data require a more involved setup. For circuit level data, we again make use ofan off-the-shelf solution: the eMonitor, developed by Powerhouse Dynamics (http://www.powerhousedynamics.com),shown in Figure 4. The eMonitor comes with current transformers (CTs) that attach to each individual circuit of thehome in a house’s circuit breaker panel; the version we usemonitors up to 24 circuits independently. However, theeMonitor reports power consumption to a central server at amaximum rate of once per minute. Since we are looking formore frequent power readings, we directly request measurements from the monitor using its API at the highest ratepossible (for the current hardware, about one reading for allthe circuits every 3 seconds).3.1 Hardware SetupFor plug-level data, we use a wireless plug monitoring systemdeveloped by Enmetric (http://www.enmetric.com), shownin Figure 3. The system consists of several power strips,each containing four independently monitored outlets, anda router that connects to the home’s internet connection viaDHCP and processes the reading from each of the wirelessdevices. Energy information is then sent to a central serverat a rate of 1Hz. Because the system reports at a sufficientrate and is fairly easy to install in most homes, we use theFigure 4: The eMonitor, designed and built by Powerhouse Dynamics, Inc.
Figure 5: The REDDBox, installed in a home (left)and showing internals (right).To measure whole-home AC waveforms at high frequency, weuse CTs from a TED (http://www.theenergydetective.com)to measure current in the power mains, a Pico TA041 oscilloscope probe (http://www.picotechnologies.com) to measurevoltage for one of the two phases in the home, and a NationalInstruments NI-9239 analog to digital converter to transformboth these analog signals to digital readings. This A/D converter has 24 bit resolution with noise of approximately 70µV, which determines the noise level of our current and voltage readings: the TED CTs are rated for 200 amp circuitsand a maximum of 3 volts, so we are able to differentiate between currents of approximately ((200))(70 10 6 )/(3) 4.66mA, corresponding to power changes of about 0.5 Watts.Similarly, since we use a 1:100 voltage stepdown in the oscilloscope probe, we can detect voltage differences of about7mV. All the data is sent to a laptop, which logs the dataand sends a subset of the raw data to our central server.Finally, since the system contains a number of electronicsin close proximity to the circuit breaker box (the eMonitor, A/D converter, oscilloscope proper, computer, externalhard drive, and various power supplies/cables), we have builtsmall boxes, dubbed “REDDBoxes,” to contain all theseparts in a single unit. A picture of the complete systemas it would be installed near a circuit breaker box is shownin Figure 5.3.2 Software SystemThe software system on the laptops in each REDDBox contains all the logic to query data from each of the monitors,store the readings locally, and send processed information(power from each of the monitors at at most 1Hz) to a central database. Recall that we log two phases of current andone phase of voltage at 15kHz; readings from the A/D converter are 24-bit, resulting in 11GB of data logged fromeach home per day (which we can compress 1.5-3X usingbzip2). It is infeasible to send this much information overthe network, so we log the data locally to an external harddisk, which we manually collect periodically and copy tothe REDD server. Since developing new features from ACwaveforms is a principle research direction for disaggregationmethods, we include this full data for researchers to analyzeif desired, though we also compute simple power informationfrom the signal.In addition to the software running locally at each home,we have a central database that stores power readings fromall the homes as well as a web interface that displays theFigure 6: Live web interface displaying power consumption at the circuit level in a x3x2.(1)y2(2)(2)x1.x3y3.ȳ2ȳ3Figure 7: Graphical model representation of theFactorial Hidden Markov Model (FHMM).real-time status of the system and allows user to see recentdata from the houses. A view of the web interface is shownin Figure 6.3.3Privacy ConsiderationsFinally, given the nature of this public data set, we want tobriefly discuss the privacy concerns involved. Sharing someone’s real-time power data in addition to their identity ispotentially quite harmful: in addition to simply being ableto estimate private information such as the amount of timesomeone spends watching television, it would be quite easyto determine if someone was home or not based upon theirpower usage. For these reasons, we (1) store no identifyinginformation about the houses in the database, and discloseonly that they are in the greater Boston area, and (2) releaseonly historical data, and keep the live portion of the websitefor private use alone (and, of course, all participants in thestudy are made aware of these stipulations). Although privacy concerns are still an issue that requires constant monitoring, our hope is that these safeguards greatly decrease therisk of disclosing or identifying personal information fromthe data.4.EXPERIMENTAL RESULTSHere we present examples of simple algorithms applied toREDD. The goal of this section is not to present state-ofthe-art performance results, but rather to demonstrate theperformance of a well-studied algorithm for this task andhighlight some of the challenges for future work.We focus on the Factorial Hidden Markov Model (FHMM)[4], which has been considered recently as a method for dis-
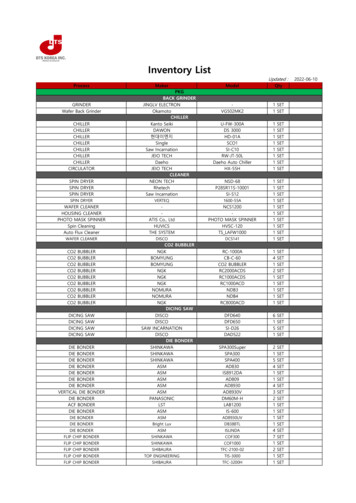
House1Monitors20219324419510Device CategoriesElectronics,Lighting,Refrigerator, Disposal, Dishwasher, Furnace,Washer Dryer,Smoke Alarms,Bathroom GFI, Kitchen Outlets,MicrowaveLighting, Refrigerator, Dishwasher,Washer Dryer,Bathroom GFI,Kitchen Outlets, Oven, Microwave,Electric Heat, StoveElectronics,Lighting,Refrigerator, Disposal, Dishwasher, Furnace,Washer Dryer,Bathroom GFI,Kitchen Outlets, Microwave, ElectricHeat, Outdoor OutletsLighting,Dishwasher,Furnace,Washer Dryer, Smoke Alarms, Bathroom GFI, Kitchen Outlets, Stove,Disposal, Air ConditioningLighting, Refrigerator, Disposal, Dishwasher, Washer Dryer, Kitchen Outlets, Microwave, StoveTable 1: Description of the houses and devices usedin the evaluation.aggregation [7]. In the FHMM, each of the n devices (or circuits) in the home is described via a Hidden Markov Model(HMM). Each device has a discrete hidden state, denoted(i)xt {1, . . . , Ni } for the state at time t for device i, whichcorresponds roughly to the internal state of the device (“off”,or in one of several possible “on” states). At each time t,given the internal state, the ith device emits a Gaussian(i)distributed power, denoted yt , with state-specific meanand variance parameters. However, we only observe theP(i)sum of all the power outputs at each time, ȳt ni 1 yt .The disaggregation task can then be framed as an inference problem: given an observed sequence of aggregate energy ȳ1 , . . . , ȳT , we aim to compute the posterior probabil(i)ity of the individual device consumptions yt , i 1, . . . , n,t 1, . . . , T . A graphical model depicting representing thisFHMM is shown in Figure 7.Although training and inference in an FHMM is nontrivial,the algorithms are described in detail in other work, and sowe only discuss them briefly here and include code for thealgorithm in the REDD release. To build the model fromdata we use the individual appliance energy sequences, ascollected by the individual device monitors, and train HMMsusing the standard Baum-Welch (EM) algorithm (thus, thealgorithm we are describing falls under the “supervised” designation of Section 2). Exact posterior inference in theFHMM model is not tractable (we use 4 states per device,and typically around 20 devices per home for a total of420 1 1012 different combinations of hidden states), sowe use a blocked Gibbs sampling scheme: we fix the hiddenstates of all but one of the chains, resulting in a Gaussianposterior over the emissions over the remaining chain; atthis point, we can efficiently sample over hidden states forthe held-out chain, and repeat the process until the distribution over all hidden states mixes. (We also anneal thesampling procedure by artificially inflating the variance ofthe observed aggregate outputs during the early iterationsof Gibbs sampling.)House12346TotalFHMMTrainTest71.5% 46.6%59.6% 50.8%59.6% 33.3%69.0% 52.0%62.9% 55.7%64.5% Test21.5%36.7%18.8%32.5%19.8%25.9%Table 2: Percentage of total energy classified correctly for different houses, using FHMM disaggregation and a simple model that predicts the device’saverage consumption percentage at each time.To evaluate the method, we used 2 weeks of data from 5 ofthe houses in REDD; since the plug-level monitors had notyet collected sufficient data at the time of writing, we usethe whole-home and circuit level data. A description of thedevices in each of these homes is given in Table 1. In thepresented experiments we sub-sampled the data to 10 secondintervals using a median filter. To evaluate the performanceof the method, we used the “total energy correctly assigned”metric described in Section 2, defined formally asPTAcc 1 t 1(i)Pni 12PT(i)ŷt ytt 1ȳt(1)(i)where ŷt denotes the algorithm’s prediction for the ith device at the tth time step, and where the 2 factor in thedenominator comes from the thatabsolute valueP that(i)the P(i)nwill “double count” errors, since ni 1 ŷt .i 1 yt Table 2 shows the disaggregation performance of the FHMMmodel on the five houses we consider. We focus on two testing procedures: in the first case we build HMM models fromdevices in a given house, and then attempt to disaggregateenergy in that house; in the second case, we train on four ofthe houses and test on the remaining held-out house. Thisprocedure is analogous to “training” versus “testing” error,and we label the results accordingly in Table 2. For comparison we also show the performance of a simple mean prediction algorithm, which estimates the total percentage thateach device type consumes and predicts that the total energybreaks down according to this percentage at all times.As seen in Table 2, the FHMM is able to disaggregate thepower data reasonably well; as expected, there is a significant drop in accuracy when moving from training prediction to test prediction, but the FHMM method still workssubstantially better than simple mean prediction. Althoughaverage accuracies of around 50% may seem low, we emphasize that this is for the case of predicting a previously unseenset of devices, and this metric measures the percentage oftotal energy correctly classified at each 10 second interval.If we aggregate the predictions over a longer time horizon,then errors tend to ”cancel out,” and we often obtain muchhigher accuracy. Figure 8, for example, shows the total trueand predicted energy for house 5 (training only on houses1-5), summed over two weeks. At this level of aggregation,the method classifies 82% of the energy correctly, and such“aggregated” charts have significant value for user feedback.
True ContributionsEstimated ContributionsThis work was supported by ARPA-E (Advanced ResearchProjects Agency-Energy) under grant number DE-AR0000018.J. Zico Kolter is supported by a National Science Foundation Computing Innovation Fellowship. Matt J. Johnsonis supported by an National Science Foundation GraduateResearch Fellowship. We thank Carrie Armel and MarioBerges for helpful discussions. We thank Enmetric Systemsand Powerhouse Dynamics for their assistance in using theirhardware for this r DryerKitchen OutletsMicrowaveStoveFigure 8: Pie chart showing predicted and actualenergy consumed for House 5 (when the FHMMis trained only on houses 1-4), averaged over thecourse of two :00Time of DayAcknowledgments09:00Figure 9: Predicted versus actual energy signal forthe refrigerator in House 5.5. CONCLUSIONThis paper has introduced REDD, a data set for researchenergy disaggregation. Energy disaggregation is an algorithmic challenge where advances can have a real impact onenergy efficiency and sustainability. We have described thehardware and software setup and demonstrated a standardalgorithm, the FHMM, for the disaggregation task.Our ultimate goal in developing REDD, however, is to provide an easily-accessible data set for researchers working indata mining or machine learning to energy. Thus, we highlight the fact that while FHMMs performed reasonably wellin the experiments we presented, there is also much room forimprovement. For example, Figure 9 shows an actual andpredicted signal for the refrigerator in House 5; although theFHMM sometimes extracts the signal correctly, it also oftenfails to detect the refrigerator or estimates a noisy and unrelated signal. Many modifications, such including explicitdurations via an HSMM [15], incorporating hard constraintson device signals, or looking at more complex features of thepower signal can all help to improve this performance. Ofparticular interest to us is how such techniques could will extend to generalize across different devices in multiple homes.We are also excited by the prospect of semi-supervised techniques for disaggregation; while REDD aims to be a largeresource, we can only outfit so many homes with such detailed sensing, and a great challenge that remains is to discover ways to merge this type of high-fidelity measurementswith the massive amounts of (unlabeled) smart meter datathat utility currently generate. Our hope is that the availability of a data set such as REDD can further motivate themachine learning and data mining communities to tacklethis problem.6.REFERENCES[1] S. Darby. The effectiveness of feedback on energyconsumption. Technical report, Environmental ChangeInstitute, University of Oxford, 2006.[2] M. Everingham, L. V. Gool, C. Williams, J. Winn, andA. Zisserman. The PASCAL visual object classes (VOC)challenge. International Journal fo Computer Vision,88(2):303–338, 2010.[3] L. Fei-Fei, R. Fergus, and P. Perona. Learning generativevisual models from few training examples: An incrementalBayesian approach tested on 101 object categories.Computer Vision and Image Und., 106(1):59–70, 2007.[4] Z. Ghahramani and M. I. Jordan. Factorial hidden markovmodels. Machine Learning, 29(2–3):245–273, 1997.[5] S. Gupta, S. Reynolds, and S. N. Patel. ElectriSense:Single-point sensing using EMI for electrical eventdetection and classification in the home. In Proceedings ofthe Conference on Ubiquitous Computing, 2010.[6] G. Hart. Nonintrusive appliance load monitoring.Proceedings of the IEEE, 80(12), 1992.[7] H. Kim, M. Marwah, M. Arlitt, G. Lyon, and J. Han.Unsupervised disaggregation of low frequency powermeasurements. In Proceedings of the SIAM Conference onData Mining, 2011.[8] J. Z. Kolter, S. Batra, and A. Y. Ng. Energy disaggregationvia discriminative sparse coding. In Neural InformationProcessing Systems, 2010.[9] Y. LeCun, L. Bottou, Y. Bengio, and P. Haffner.Gradient-based learning applied to document recognition.Proceedings of the IEEE, 86(11):2278–2324, 1998.[10] M. P. Marcus, M. A. Marcinkiewicz, and B. Santorini.Building a large annotated corpus of English: the Penntreebank. Computational Linguistics: Special issue onusing large corpora: II, 19(2), 1993.[11] Multiple. Annual energy review 2009. Technical report,U.S. Energy Information Administration, 2009.[12] National Institute of Health. NIH data sharing policy andimplementation guidance.http://grants.nih.gov/grants/policy/data sharing/data sharing guidance.htm, 2003.[13] B. Neenan and J. Robinson. Residential electricity usefeedback: A research synthesis and economic framework.Technical report, Electric
energy-aware home appliance network, where each device reports its consumption to a central location; an oft-stated goal of disaggregation research is to push energy awareness to a ubiquitous level, paving the way for more detailed en-ergy monitoring in the future. Academic work on energy disaggregation began with the