Transcription
ASSET MAPPING OF SUS VILLAGEBY:M.SC (BATCH 2018-20)SYMBIOSIS INSTITUTE OF GEOINFORMATICSSYMBIOSIS INTERNATIONAL (DEEMED UNIVERSITY)5Th & 6th Floor, Atur Center, Gokhale Cross Road,Model Colony, Pune-4110161 Page
e51.2What is a community asset51.3When to use asset mapping5Study area72.1Introduction72.2History72.3Geography and Climate72.4Location8Methodology83.1Identification of Potential Resources83.2Asset Mapping8Result10Annexure112.03.04.05.02 Page5.1
LIST OF MAPS:SR.NO TITLEPG. NO.1.1Location of study area81.2Basic assets of sus9LIST OF TABLES:SR.NO TITLEPG. NO.1.Demography of Sus62.Total Assets in Sus village103.Basic Parameters114.Economic-Development and Livelihood115.Financial inclusion116.Health, Nutrition and Sanitation117.Women Empowerment128.Key Infrastructure Parameters123 Page
1.0 INTRODUCTION:Planning is an integral part of the functioning of any government, at the local level it issocial decision making which changes lives and future of the society. Planning for well-beingof the people requires proper understanding of the local context including the resources,economic activities, social and cultural environment of the area and this helps in harnessing themanner. The basic idea of decentralization is sharing the power of decision-making with lowerlevels in the organization, as people living there, their issues need to be solved and they planbest in teams; hence it is decision making for common cause, creative and structured problemsolving process.Spatial planning involves making decisions based on the spatial patterns and processes such asdistance, location, neighbourhood and proximity of various natural resources, infrastructuralfacilities, human activities and welfare activities in a set of terrain conditions.Remote sensing plays a key role in community driven management and acquires specialimportance in the context of the process of participatory, integrated decentralized planning.Now with the availability of one-meter spatial resolution satellite data in public domain inIndia, Remote Sensing and GIS technologies are capable of creating various detailed naturaldevelopmental potential and improve the living conditions of the people, particularly thedisadvantaged sections. In other words, it is social or organizational activity of developing anoptimal strategy for solving problems and reaching the desired goal. In decentralized planning,local organizations formulate, adopt, execute actions and supervise the plan in participatoryresources information layers on large scale in short time. The synoptic view provided bysatellite imagery offers technologically the most appropriate method for quick and reliablemapping and monitoring of various natural resources both in space and time domain. It depictsthe terrain, natural resources and human activities along with infrastructure facilities as anintegrated view, which is the base for spatial thinking and further decides on interventionrequired and forming planning strategy. It helps to make an informed decision at the Panchayatlevel for effective and transparent planning, implementation & monitoring of centrally or statesponsored schemes, governance and finally spatially enabling the Nation.National Remote Sensing Centre has developed a Geo-Portal called Bhuvan PanchayatPortal (url: http://www.bhuvan-panchayat.nrsc.gov.in) This has been designed and developedto help in Panchayat Level Planning and Governance. This Portal comprises High ResolutionDatasets and Thematic Maps to enable Panchayat Level Planning. Besides high-resolutionspatial data it provides enabling environment for asset mapping, activity planning,4 Page
implementation, monitoring and interactively report generation up to Panchayat level. AssetMapping Module helps in mapping the assets and creating the Assets Directory.A.Asset Directory:The Asset Directory is the comprehensive compilation of different types of assets/resourcesavailable in various parts of the country which are being created under several schemes ofGovernment of India, States and communities by themselves to facilitate the local population.Every asset type is identifiable with a unique code. A unique symbol is associated with eachasset group and every category is presented in a unique colour. An Android based Mobileapplication is also available in this portal using which the assets can be mapped.The Asset Directory is made on community based and village-based assets in a Panchayat. Thecompilation and categorization of assets/resources is in reference to the Space basedInformation Support for Decentralized Planning (SIS-DP) Project. To add assets and attributesnot available in the asset inventory, there is a provision to add these under 'other asset' and'other attribute'1.1.PurposeAsset mapping provides information about the strengths and resources of a community andcan help uncover solutions. Once community strengths and resources are inventoried anddepicted in a map, you can more easily think about how to build on these assets to addresscommunity needs and improve health.Finally, asset mapping promotes communityinvolvement, ownership, and empowerment.1.2.What is a community asset?A community asset or resource is anything that improves the quality of community life.Assets include: The capacities and abilities of community members. A physical structure or place. For example, a school, hospital, or church. Maybea library, recreation centre, or social club. A business that provides jobs and supports the local economy. Associations of citizens. For example, a Neighbourhood Watch or a ParentTeacher Association. 5 PageLocal private, public, and non-profit institutions or organizations.
1.3.When to use Asset MappingYou want to start a new local program and need information about available resources.For example, you are interested in teen mothers finishing their education. You coulddraw a community asset map that identifies school drop-out prevention, tutoring, andeducation counselling programs for young teen mothers. This helps you see what alreadyexists, or if support services are lacking. You may find it is necessary to develop aprogram to help young mothers finish their education.You are making program decisions. An asset map can help you identify communityassets and concerns. The map results help determine new directions for your program oridentify new programs that need to be developed. For example, an asset map of foodbanks and nutrition resources for low-income families in your neighbourhood may revealthat there is a lack of programs, or that existing programs are located in areas that are notaccessible to families in your service area.You want to mobilize and empower the community. If you involve different communitymembers in constructing the asset map, the process itself can be an organizing tool. Forexample, mapping local public services and identifying the dollars spent per communitymember can mobilize residents to lobby city or county council members to improve localpublic services.Table 1: Demography of susTotal No. of )Schedule Caste750388362Schedule Tribe122655783.31 %90.92 %74.80 %1,9751,4575181115952LiteracyTotal WorkersMarginal Worker6 Page
2.0 STUDY AREA:2.1 INTRODUCTION:According to Census 2011 information the location code or village code of Sus village is556123. Sus village is located in Mulshi Tehsil of Pune district in Maharashtra, India. It issituated 22km away from sub-district headquarter Paud and 12km away from districtheadquarter Pune. As per 2009 stats, Sus village is also a gram panchayat.The total geographical area of village is 912.97 hectares. Sus has a total population of 4,865peoples. There are about 3784 houses in Sus village. Pune is nearest town to Sus which isapproximately 18km away.2.2 HISTORY:Sus Road is a newly developed location after the expansion of Pune city limits in the late 1990s.Real estate in the area has increased tenfold in the past decade in order to meet the growingdemand of residents. Once an underdeveloped road, Sus Road was renovated in 2008 on theoccasion of the Commonwealth Youth Games held in the neighbouring suburb of Balewadi.The road width was increased, and a six-lane asphalt road was laid to promote growth andtravel. Few more additions included a recreational park near the bypass intersection andpedestrian footpaths.2.3 GEOGRAPHY AND CLIMATESus Road lies in a valley and is surrounded by hills both sides. The average elevation the roadtravels on is 550 m (1,800 ft), gradually increasing while nearing the villages of Sus and Nande.Nearby hills include the Baner and Pashan Hills, Sutarwadi Hill and the Lavale Hills. Sus Roadshares the climate of Pune city, with warm summers, moderate rainfall and moderate winters.7 Page
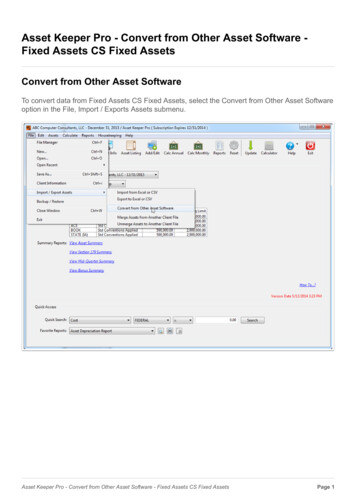
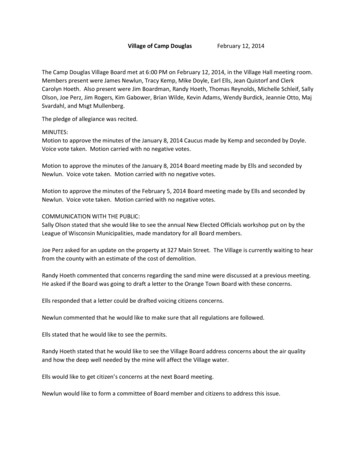
2.4. LOCATION OF THE STUDY AREA:Figure 1: Location of study area3.0 METHODOLOGY:Phases of assets mapping of Panchayat in GIS mdifferentsourcesHill shade and Slope mapping using satellite images for information on different categoriesPrimary data was collected from plot to plot survey using GPS ESSENTIAL. Identification ofindividual and community resources using G.P.S. Population data of the study area from censusof Pune, ernanceAsset mapping create a comprehensive list of community resources that can provideprogrammes, services and a base of support and partnership for neighbourhood network (Burnset. al. 2012). It may be used in conjunction with the website creation tool to create navigationof the assets. Creation of Area of Interest (AOI) of that Gram Panchayat with villageboundaries. Collection of GCP of different assets. Identification of different assets from GoogleEarth.8 Page
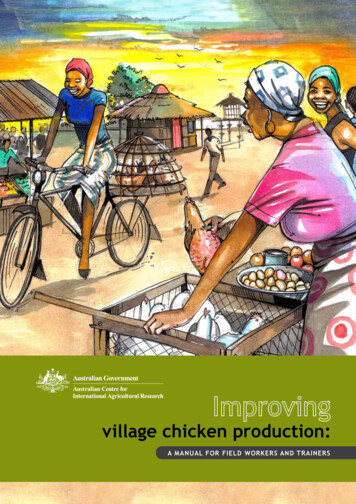
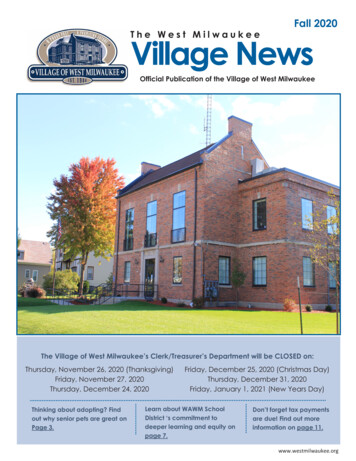
Figure 4: Basic assets of sus9 Page
4.0 RESULT:After preparing the asset map it has been observed that the most important assets areconcentrated in one region which is the most central region of Sus Village.Health Care Centre, Pharmacies, schools, ATMs, Banks, Markets are majorly seen inthe central part of the village (Figure 4).Due to rugged topography in certain parts of the village there is lack of accessibilitythus very few or no resources can be seen.Table 1: Total assets in sus Total Assets11.1Educational Facilities (School)1.2Medical and Health Facilities1.33Hospital2Pharmacy6SanitationPublic Toilets21.4Postal and Telecom Services11.5General Assets1.610 P a g eTemples13Garbage Disposal Sites3Water Source3Government Center2
5.0 ANNEXURE:TABLE 3: Basic ParametersBASIC PARAMETERSSURVEY 2018Total Population4865Male2435Female2430Total Household3784Total no. of Self-Help Group20Total area of village (in ha)912.173Net sown area (in ha)736.157Total unirrigated land area (in ha)102.302Area irrigated (in ha)633.855TABLE 4: Economic-Development and LivelihoodEconomic-Development and LivelihoodSurvey 2018Soil Testing CenterNO (5-10 KMS)Gov Seed CenterNO (2-5 KMS)Fertilizer ShopNO (5-10 KMS)TABLE 5: Financial inclusionFinancial inclusionSurvey 2018No of SHGs accessed Bank Loans9TABLE 6: Health, Nutrition and SanitationHealth, Nutrition and SanitationSurvey 2018Community waste disposal systemNOCommunity Bio-Gas or recycle of water for production useNOIs the village open Defection FreeNOAvailability of Anganwadi CenterYESNo of total children in the age group 0-3 yrs.91No of children aged 0-3 yrs. Registered under Anganwadi52No of children aged 0-3 yrs. Immunized7011 P a g e
TABLE 7: Women EmpowermentWomen EmpowermentSurvey 2018No of Household mobilized into SHGs215No of Household mobilized into producer Groups2No of Household supported by village-based Agriculture2Extension WorkersNo of Household supported by village-based Livestock35Extension WorkersTABLE 8: Key Infrastructure ParametersKey Infrastructure ParametersSurvey 2018% of household engaged in farming activities20.0% of household engaged in non-farming activities80.0Availability of BanksYESAvailability of ATMYESWhether the village has an internal cc/brick roadNOWhether the village is connected to all weather roadYESAvailability of Public TransportBUSAvailability of Internet CaféAvailability of electricity for domestic use (in hrs.)Availability of Public Distribution CenterAvailability of MarketsAvailability of Piped tap waterNO (2-5 KMS) 12 HRS.NO (5-10 KMS)WEEKLY HAAT 50% HABITATIONCOVEREDAvailability of Telephone ServicesTotal no of household using clean energy (LPG/BIO-GAS)No of household with Kuccha wall and roofAvailability of post officeAvailability of schoolAvailability of Vocational EducationalMOBILE369945YESMIDDLE-SCHOOLNO (5-10 KMS)Centre/ITI/RESETI/DDU-GKYAvailability of Sub-Center/PHC/CHCAvailability of Veterinary clinic12 P a g eSUB-CENTERYES
Pharmacy 6 1.3 Sanitation Public Toilets 2 1.4 Postal and Telecom Services 1 1.5 General Assets Temples 13 Garbage Disposal Sites 3 Water Source 3 1.6 Government Center 2 . 11 P a g e. 5.0 ANNEXURE: TABLE 3: Basic Parameters. BASIC PARAMETERS SURVEY 2018 .