Transcription
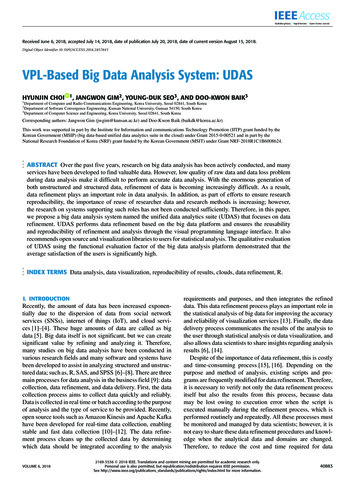
Received June 6, 2018, accepted July 14, 2018, date of publication July 20, 2018, date of current version August 15, 2018.Digital Object Identifier 10.1109/ACCESS.2018.2857845VPL-Based Big Data Analysis System: UDASHYUNJIN CHOI1 Department1,JANGWON GIM2 , YOUNG-DUK SEO3 , AND DOO-KWON BAIK3of Computer and Radio Communications Engineering, Korea University, Seoul 02841, South Korea2 Department of Software Convergence Engineering, Kunsan National University, Gunsan 54150, South Korea3 Department of Computer Science and Engineering, Korea University, Seoul 02841, South KoreaCorresponding authors: Jangwon Gim (jwgim@kunsan.ac.kr) and Doo-Kwon Baik (baikdk@korea.ac.kr)This work was supported in part by the Institute for Information and communications Technology Promotion (IITP) grant funded by theKorean Government (MSIP) (big data-based unified data analytics suite in the cloud) under Grant 2015-0-00521 and in part by theNational Research Foundation of Korea (NRF) grant funded by the Korean Government (MSIT) under Grant NRF-2018R1C1B6008624.ABSTRACT Over the past five years, research on big data analysis has been actively conducted, and manyservices have been developed to find valuable data. However, low quality of raw data and data loss problemduring data analysis make it difficult to perform accurate data analysis. With the enormous generation ofboth unstructured and structured data, refinement of data is becoming increasingly difficult. As a result,data refinement plays an important role in data analysis. In addition, as part of efforts to ensure researchreproducibility, the importance of reuse of researcher data and research methods is increasing; however,the research on systems supporting such roles has not been conducted sufficiently. Therefore, in this paper,we propose a big data analysis system named the unified data analytics suite (UDAS) that focuses on datarefinement. UDAS performs data refinement based on the big data platform and ensures the reusabilityand reproducibility of refinement and analysis through the visual programming language interface. It alsorecommends open source and visualization libraries to users for statistical analysis. The qualitative evaluationof UDAS using the functional evaluation factor of the big data analysis platform demonstrated that theaverage satisfaction of the users is significantly high.INDEX TERMS Data analysis, data visualization, reproducibility of results, clouds, data refinement, R.I. INTRODUCTIONRecently, the amount of data has been increased exponentially due to the dispersion of data from social networkservices (SNSs), internet of things (IoT), and cloud services [1]–[4]. These huge amounts of data are called as bigdata [5]. Big data itself is not significant, but we can createsignificant value by refining and analyzing it. Therefore,many studies on big data analysis have been conducted invarious research fields and many software and systems havebeen developed to assist in analyzing structured and unstructured data; such as, R, SAS, and SPSS [6]–[8]. There are threemain processes for data analysis in the business field [9]: datacollection, data refinement, and data delivery. First, the datacollection process aims to collect data quickly and reliably.Data is collected in real time or batch according to the purposeof analysis and the type of service to be provided. Recently,open source tools such as Amazon Kinesis and Apache Kafkahave been developed for real-time data collection, enablingstable and fast data collection [10]–[12]. The data refinement process cleans up the collected data by determiningwhich data should be integrated according to the analysisVOLUME 6, 2018requirements and purposes, and then integrates the refineddata. This data refinement process plays an important role inthe statistical analysis of big data for improving the accuracyand reliability of visualization services [13]. Finally, the datadelivery process communicates the results of the analysis tothe user through statistical analysis or data visualization, andalso allows data scientists to share insights regarding analysisresults [6], [14].Despite of the importance of data refinement, this is costlyand time-consuming process [15], [16]. Depending on thepurpose and method of analysis, existing scripts and programs are frequently modified for data refinement. Therefore,it is necessary to verify not only the data refinement processitself but also the results from this process, because datamay be lost owing to execution error when the script isexecuted manually during the refinement process, which isperformed routinely and repeatedly. All these processes mustbe monitored and managed by data scientists; however, it isnot easy to share these data refinement procedures and knowledge when the analytical data and domains are changed.Therefore, to reduce the cost and time required for data2169-3536 2018 IEEE. Translations and content mining are permitted for academic research only.Personal use is also permitted, but republication/redistribution requires IEEE permission.See http://www.ieee.org/publications standards/publications/rights/index.html for more information.40883
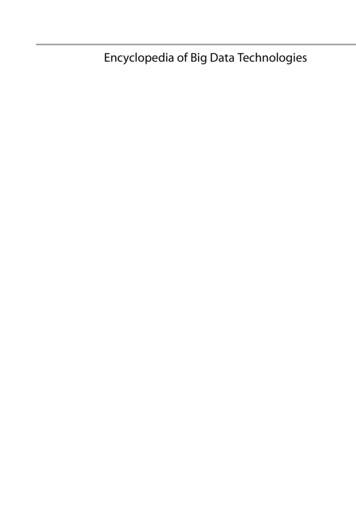
H. Choi et al.: VPL-Based Big Data Analysis System: UDASanalysis, we need a solution for efficient and convenient datarefinement process [17]. Recently, research related to datacollection and data delivery have been actively conducted,and various tools and systems have been developed in thebig data field; however, research regarding tools focused ondata refinement are insufficient [18]–[20]. OpenRefine [21]is widely used as a tool for data refinement. This tool canexpand the knowledge graph substantially by supporting datawrangling functions such as data syntax checking, data clustering, and data cleansing. However, the detailed proceduresand methods for the data refinement process are not provided.Therefore, when integrating knowledge graphs for new rawdata, much time and effort is required for the data scientist toperform iterative data wrangling process.In this paper, to reduce the cost of existing approachesfor data analysis, we define methods for data refinement andimplement a data analysis system focusing on data refinement to consider the convenience of users. In other words,we propose a big data refinement and statistical analysissystem based on the visual programming language (VPL)concept [22].The main contributions of this paper are as follows: Big data collection, refinement, statistical analysis, andvisualization system in the cloud environment: Capableof collecting unstructured text data and structured data,refining and analyzing through the cloud environment,and providing a visualization service of the analysisresults on the web interface. Ensure reusability of the data refinement process: Datarefinement process design, data wrangling, data mapping, and data integration can all be performed via theVPL interface, depending on the data analysis requirements. The data refinement process can be configuredusing the drag and drop method, and the process can besaved and shared as a template so that users can performthe refinement process easily. Ensure reproducibility of open source-based data analysis: R packages and functions widely used for statisticalanalysis can be programmed through the VPL interface,and the generated data analysis model can be stored andused by users such as domain experts, and the executedprocess can be reproduced. In other words, the proposedsystem ensures reproducibility of research methodology.In addition, various visualization results can be obtainedby applying the visualization library provided in D3.jsthrough the proposed system [23].The remainder of this paper is organized as follows.In section 2, we describe the existing data analysis tools,particularly focusing on data refinement function, andVPL-based data analysis tools. Section 3 explains the UDASarchitecture in detail. Section 4 describes an implementationof the UDAS, focusing on the main modules. In section 5,we evaluate the UDAS on the basis of a use case studyand qualitative evaluation. Finally, section 6 presents a briefconclusion.40884II. RELATED WORKA. DATA ANALYSIS TOOLSAs the importance of data analysis has increased in big dataenvironments, software tools supporting data collection, datarefinement, and data delivery for data analysis, such as R [24],SAS [25], and SPSS [26], have been developed. Most toolsprovide a data delivery function focusing on statistical analysis and data visualization; however, there are no tools thatcover three major functions for data analysis, with the exception of Deducer [27] and SAS. In addition, limited workshave been conducted on the provision of the data refinementfunction, which is the most important function in the dataanalysis process. Table 1 represents the classification of existing data analysis tools. They are classified into three maincategories: functionality, feature, and environment. Functionality represents the main three processes of data analysis.The feature category represents the ability of tools to focuson reproducibility and reusability. Finally, in environmentcategory, we examine the availabilities of cloud services andopen source software for data analysis.Especially, data analysis tools are predominantly basedon R, which is a free programming language for statisticalcomputing. Open source R has recently been widely used invarious fields for big data analysis. Researchers can freelycustomize the published R libraries for research purposes andapply the various analysis models easily. As a result, the useof R has increased in recent years not only in the analysisof big data, but also in visualization of results of machinelearning. Various tools and interfaces related to R have beendeveloped, such as RStudio [28], RKWard [29], JGR [30],RCommander [31], Rattle [32], and Deducer. RStudio is themost well-known and representative open source data analysis software for R. It is the most popular of all data analysistools related to R. RKWard, JGR, and R Commander havebeen developed to facilitate easier use and higher efficiency ofthe R language and R packages to focus on the GUI. Recently,tools for various operating system environments have beendeveloped to guarantee platform independency and enableanalysis in the big data ecosystem; these tools include Rattleand Deducer.Nevertheless, the R engine has structural limitations thatprevent satisfactory performance in analyzing large amountsof data. To solve these problems and to ensure the abovementioned advantages of using R, there are projects thatconsider distributed and cloud computing. Apache Sparkhas released SparkR [33] for interoperability with R. SparkRsupports the interoperability between Spark data frames andR data frames, which are capable of memory-based distributed processing, and it used in large-scale data analysis and visualization. Microsoft has released the MicrosoftMachine Learning Server [34]–[36], an open source analyticsplatform. Users can conduct analysis models using R librariesin a cloud through Microsoft Machine Learning Server. In thisway, projects related to the R engine are implemented inthe distributed processing and cloud computing for big dataVOLUME 6, 2018
H. Choi et al.: VPL-Based Big Data Analysis System: UDASTABLE 1. Classification of existing data analysis tools.processing, and the use of R is increasing to enhance the productivity of the researchers and to support the reproducibilityof the research methods.Most R-based data analysis tools focus on the data delivery,because R is a strong tool for statistical analysis and datavisualization. However, there is no tool to support all the dataanalysis processes, and in particular, they do not offer thedata refinement process. Deducer provides a data refinementfunction, but it is not fully functional.SAS and SPSS are the most representative statistical analysis tools similar to R. There are some differences betweenSPSS and SAS; SPSS is a statistical analysis tool that focusesonly on the statistical analysis algorithm, whereas SAS isable to provide various data analysis functions, as well asa statistical analysis algorithm. They both provide powerfuldata analysis functions in terms of the data delivery, andpartially support the data collection. However, considerabletime and costs are required for users to use them, becausethey were both developed for experts, such as statisticians anddata scientists. SRC-STAT [37] was developed consideringthe convenience of users who are unfamiliar with statistical processing and analysis. This tool adds visual analysisfunctions, such as a scatter plot matrix explorer, hierarchicalclustering explorer, and data visualization explorer, to providea GUI for users to explore and analyze data easily. SRC-STAThas a scatter plot matrix explorer and a hierarchical clustering explorer. Based on these functions SRC-STAT canrefine data. However, users must possess substantial statistical knowledge to use SRC-STAT; besides, exploring the dataintuitively is difficult. Furthermore, SRC-STAT is not suitablefor the big data environment because it does not considerVOLUME 6, 2018the processing of big data. Stat! [38] refines appropriatequeries for data scientists to explore data and provides tablesand graphs of data analysis results through multiple queries.However, Stat! does not provide the ultimate purpose of thedata refinement function, because it only refines the queryfor the data explorer. In addition, it supports some tables andgraphs, but not various data visualization functions, and theUI is not user-friendly. ManyEyes [39] is a web-based systemthat allows users to collaborate on data analysis and visualization. Users can obtain visualization results and the visualization results can be modified via feedback from other usersusing web-based interface. Communication among users isthe most important requirement of this web-based system.However, without active communication, achieving the goalof this system is difficult. In addition, this system does notsupport the data collection and refinement functions.OpenRefine is the only data analysis tool that focuses fullyon the data refinement function. This tool provides fundamental refinement functions, such as data cleaning and datatransformation, as well as automation for refinement, whichallows users to reduce the time and cost required for datarefinement. Furthermore, it is useful for identifying trendsin big data sets, and allows expanding the data by linkingwith a knowledge base such as Wikipedia. However, OpenRefine does not store the refinement process worked on bythe users. Therefore, if users conduct the same data analysisprocess again, the cost of data refinement is incurred as inany other tools. In other words, OpenRefine does not support reusability and reproducibility. In existing data analysistools, the data analysis processes have not been developed toenable linking data refinement and visualization as a series of40885
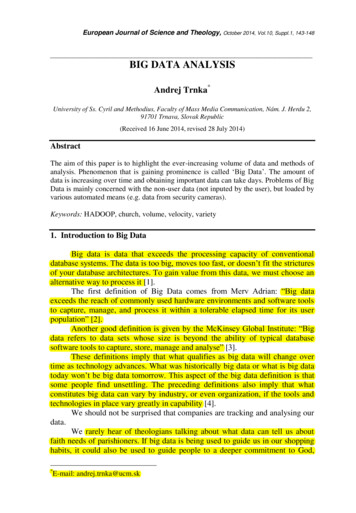
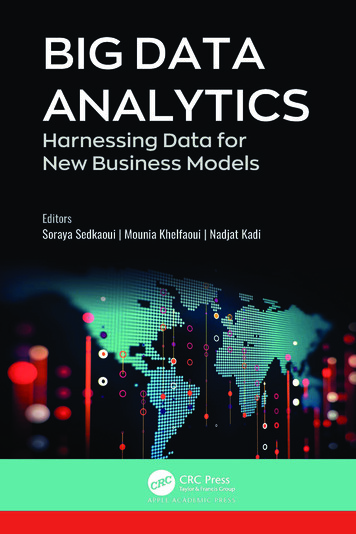
H. Choi et al.: VPL-Based Big Data Analysis System: UDASprocesses, but rather as independent modules. Therefore,there is a difficulty in integrating and linking the resultsof each process. Furthermore, the linkage and integrationinformation of data for the continuous processes is missing;thus, loss of implicitly derivable information can occur.The proposed UDAS provides all functions necessary fordata analysis, such as data collection, refinement, and delivery. We establish the process for data refinement in the UDASto reduce the cost of refinement. In addition, the UDAS storesthe continuous processes from data refinement to visualization as a template. To use this template, users can perform theprocesses necessary for data analysis easily compared withother tools. The UDAS system also ensures the advantagesof open source R in the cloud computing and uses the Rlibrary flexibly. The VPL-based interface of UDAS facilitatesdata collection, processing, and refinement, as well as dataanalysis in distributed and cloud computing.B. VISUAL PROGRAMMING LANGUAGE (VPL)A programming language that uses a visual representationsuch as graphics, drawings, animation, or icons, partiallyor completely is named VPL. It can help manipulate visualinformation, support visual interaction, and allow programming with visual expressions. VPL is a set of spatial arrangements of text/graphic symbols with a semantic interpretationthat is used in generating communication data. VPL has several advantages such as fewer programming concepts, immediate visual feedback, and explicit depiction of relationships.Thus, many tools have been developed to analyze big datausing the VPL concept, such as Azure [40], Orange [41], andKNIME [42].Azure is a representative platform that applies VPL and itwas designed based on a graphical dataflow-based programming model. Azure is targeted for beginner programmersand users, with a basic understanding of tools and functions,who want to analyze big data without the help of data scientists or statistical experts. Therefore, Azure can be used toconduct rapid prototyping or code development to analyzebig data. In addition to Azure, Orange and KNIME feature auser-friendly programming language based on VPL, makingit easier for users to integrate data.Existing VPL-based tools and platforms focus on the easeof use of the programming language for users. However, theydo not consider the various and complex situations, suchas BI and BA. Furthermore, there are little works for bigdata analysis tools based on VPL. IBM Cognos [43] is arepresentative system based on VPL for data analysis, and itsupports actively flexible programming to take advantage ofVPL for diversifying business situations. Nonetheless, Cognos does not support important functions for data collectionand refinement in big data analysis. However, the UDASsystem proposed in this paper provides users with three mostimportant functions for analyzing big data such as data collection, data refinement, and data delivery.40886III. SYSTEM ARCHITECTUREThe UDAS proposed in this paper supports the design andexecution of the refining and analysis process by applyingVPL concepts, including data collection, refinement, andanalysis functions, for big data analysis. Fig. 1 shows theoverall system architecture. The UDAS consists of threestages: data collection, data refinement, and data analysis.In the first step, the data collection phase, various typesof big data (e-mail, SNS, Web documents, RDB, Web logfiles, etc.) are collected in real time and in batch mode usingeach collection agent. In addition, the collected raw data isreferred to the data analysis policy, and data schema storedin the Data Orchestrator for decomposition and reintegrationaccording to the purpose of analysis and data type. A messagequeuing module can control and save each data in a Hadoopcluster capable of distributed parallel processing, as shownin Fig. 2.The second step, data refinement, includes the data manipulation function that includes the data wrangler function,data query, and data mapping necessary to design the logicaland physical model of the data to analyze and refine thedata. As a result, a refinement process can be created andstored as a template. At this time, the target data used inthe refining process, refinement table information, mappingrules, and the order of the refinement process are stored in theUDAS as metadata to ensure reusability and reproducibilityof the template. Therefore, non-specialists as well as domainexperts can reuse or customize the data refinement processby selecting the template. This is because the UDAS supports the entire process from data collection to refinementand analysis to be modularized procedurally, and executedstep by step. The main components of the UDAS are asfollows.A. ER DESIGNERER designer is a component used for designing accurate datamodels (logical and physical) for data analysis. It supportsdata duplication prevention and data normalization.B. QUERY DESIGNERQuery designer supports accurate and rapid generation ofvarious queries (inner join, outer join, cross join, and otherjoins) through a VPL-based query design interface.C. MAPPING DESIGNERData wrangling is the task of manipulating raw data manuallyfor data analysis or integrating modified data with other interoperable data. As a result, data wrangling work is made up ofvarious scripts used in R, and this work is difficult to reuseexisting scripts for new incoming raw data without changingthe purpose of analysis. Through the VPL-based GUI interface, the refined data are mapped to the physical schema ofthe refinement table while diagnosing and processing the dataof the wrangling object.VOLUME 6, 2018
H. Choi et al.: VPL-Based Big Data Analysis System: UDASFIGURE 1. Architecture of UDAS.FIGURE 2. Data collection process in the UDAS.D. DATA DICTIONARYTo ensure the interoperability of the terms used in the datarefining and analysis process, a data dictionary is createdfor ensuring the consistency of terms. Specifically, the datadictionary is used to unify the terms used in the schema for theanalysis data and the representative terms in the processingof the original data. As a result, it is possible not only toprevent lexical inconsistency in analyzing data generated inVOLUME 6, 2018the domain field (financial, sensor data, log analysis, etc.),but also to manage standard terms by controlling terms thatcan be used differently by user change.E. DATA DOMAIN COMPONENTTo ensure the accuracy of data analysis, it is necessary to manage primitive types of data (e.g., integer, float, double, etc.).In the process of generating analysis data, some raw data may40887
H. Choi et al.: VPL-Based Big Data Analysis System: UDASbe lost owing to data type conversion (e.g., float to double).Therefore, the data quality should be managed throughoutthe data analysis. To this end, the data domain managementcomponent of the UDAS refers to the data schema for analysisand performs continuous management of the domain of data.F. TEMPLATE FOR REFINEMENT AND ANALYSISAn analytical project generated through the UDAS includesat least one or more refining processes and analytical models.The refinement processes and analysis models used in projectcan be saved as a template after completion of the project.Therefore, user can reuse this templet next time, and it meansthat UDAS guarantee reusability.G. STATISTICAL ANALYSIS AND VISUALIZATIONThe analytical model of the UDAS recommends a statisticalanalysis library applicable to the data considering the typesof data (e.g., nominal, discrete, etc.).The analytical model uses a library of open source R,which is widely used in statistical analysis. To achievethis, we define the metadata by analyzing the representativeanalytic functions defined in R (2,583 functions in total).The UDAS recommends functions applicable to the analysismodel through defined metadata and the analysis of datatype. The UDAS also applies D3.js, which includes variouslibraries based on JavaScript, for visualization of the analysisresults. To achieve this, we analyze 150 graphs used in D3.jsand define the metadata. As a result, the UDAS supports various visualizations of data frames generated from the analysismodel.IV. IMPLEMENTATIONThis chapter discusses the implementation of the UDASdefined in Chapter 3.A. DATA COLLECTIONThe data collection step performs the function of collecting various types of data (structured, unstructured, andsemi-structured) in real time. For this purpose, the UDASis implemented based on the Hadoop ecosystem for storing and processing large amounts of unstructured text data(e.g., e-mail, log file, text web document, etc.). In addition,it supports relational databases and machine-readable datasuch as CSV and XML. The UDAS can monitor the statusof the data collection step from the relational database in thedashboard, along with unstructured data such as e-mail andweb logs. Further, it is possible to monitor the occurrenceof errors during collection and cope with the data collectionstage. In addition, the vast amount of data collected in realtime is stored according to subject classification and datacharacteristics by the purpose of analysis using Apache Kafkaand a message queuing system.B. DATA REFINEMENTFirst, in the data refinement step, UDAS performs the dataextraction and integration process for analysis to reproduce40888raw data as analyzed data. In these processes, the user designsthe table schema to select the data to be analyzed. Then, datamapping is performed based on the designed table schema,where the raw data are reproduced and integrated into cleandata by data wrangling process. The data type definitions anddata mapping rules which are used during data refinement arestored with the order information of the refinement process.As a result, the refinement process is reusable for analyticalmodels that require the same refinement process. In addition,a single refinement process can be distinguished into severalsub steps, which can be applied to new analytical modelsby disassembling and reassembling the refinement processfor the purpose of analysis. The UDAS can visualize thedata refining process through the VPL-based GUI interface tograsp the flow of the refinement process so that it can changethe configuration of the refinement process and assemblingthe lower-level component. In addition, the refinement ofunstructured data is developed in different types of scripts orprogramming languages, taking into consideration the type ofdata and the purpose of analysis. Therefore, it is not easy toreuse individual scripts or programs. Thus, this supports thereusability of existing scripts and libraries in the refinementmodel and the analysis model. Fig. 3 shows the IDE screen formanipulating and executing the data refinement process. Theinterface of data refinement process includes the followingmodels.1) REFINEMENT MODELThe refinement process consists of several individual components, and each component produces the next step ofinput data according to the data refinement flow. In otherwords, the refinement component represents the data to berefined and the wrangling operation on that data. Q notationin Fig. 3 indicates the raw data loading process that requiresrefinement through the query designer. M notation representsthe wrangling of the tabular data. For example, when performing data analysis in open source R, multiple data framesand various refinement scripts are needed. These tasks consistof a single refinement process when mapped to individualrefinement components.2) ANALYSIS MODELThe analysis model component binds both statistical analysisfunctions and visualization libraries applicable to the data tobe analyzed. Fig. 3 includes two analytical models, indicatingthat the refined data can be used as two different analyticalmodels.The refinement and analysis models included in the refinement process are executed by using the following components. Fig. 4 shows the design of the schema through ERdesigner, and the flow of execution of query designer to mapthe data to the designed schema.i) ER DesignerER designer designs table schemas during data refinementand performs data quality control, as shown in Fig. 5. ERdesigner supports various relational databases (e.g., MySQL,VOLUME 6, 2018
H. Choi et al.: VPL-Based Big Data Analysis System: UDASFIGURE 3. IDE screen of data refinement in the UDAS.Oracle, MS-SQL, etc.) and provides forward engineering andreverse engineering for analyzed data generation to compareand merge data schemas.ii) Query DesignerThe query designer supports the design of the relationship and the schema structure of the data with the dragand drop function based on the VPL concept, and generatesthe SQL statement for data collection, as shown in Fig. 6.There are four IDE components as follows: Join operation &data source, Query design, Query & query result, and Inputdetailed information. Join operation & data source performsthe join query (e.g., inner join, outer join, and cross join)between data to be refined. Query design represents the components of the FROM clause and JOIN clause that make upa query. A large circle represents a table in a FROM or JOINclause, and a small circle represents a column used in a JOINoperation. The arrows indicate the equal operator between thetable and the columns. Query & query result is the execution syntax for the query designed by the GUI and is automatically generated; the designed query can be confirmed.Input detailed information is a function with which to inputVOLUME 6, 2018various requirements such as column selection, place clause,and group by clause, where the clause constitutes the querystatement in detail.3) MAPPING DESIGNERWhen mapping rules for the schema and data are definedthrough the mapping designer interface, the refined script isinvoked to automatically perform schema-to-data mapping.At this time, data quality is guaranteed through the metadata regarding the data and schema. In addition, in-memoryjoins can be performed to map large amounts of data, andvarious types of data can be integrated by data joiningbetween heterogeneous DBMSs. Fig. 7 shows the mappingdesigner interface, where nodes represent physical tables andsmall circles attached to nodes represent the columns ofeach table. The users of UDAS can specify and verify themapping between the tables. As shown in Fig. 7, Mappingdesigner displays the FROM and JOIN clauses that makeup the join operation through the GUI. Selected columnallows the analyst to select the column to be used for themapping.40889
H. Choi et al.: VPL-Based Big Data Analysis System: UDASFIGURE 4. Query design flow of data refinement in the UDAS.FIGURE 5. ER designer in the UDAS.C. DATA ANALYSISThe data analysis step derives the visualization result by running the analysis model using the refined data. Through theUDAS interface, users ca
of R has increased in recent years not only in the analysis of big data, but also in visualization of results of machine learning. Various tools and interfaces related to R have been developed, such as RStudio [28], RKWard [29], JGR [30], RCommander [31], Rattle [32], and Deducer. RStudio is the most well-known and representative open source .