Transcription
2016 FOREST SURVEY RESULTS MARBLED MURRELETS IN THE SANTA CRUZ MOUNTAINSBySteven W. Singer, M.S.Steven Singer Environmental & Ecological ServicesSanta Cruz, CaliforniaPrepared for:Santa Cruz Mountains DistrictCalifornia State Parks DepartmentFelton, CA.January 2017
2016 FOREST SURVEY RESULTS MARBLED MURRELETS IN THE SANTA CRUZ MOUNTAINSBySteven W. SingerSteven Singer Environmental & Ecological ServicesSanta Cruz, CaliforniaABSTRACTSimultaneous A-V surveys were conducted at the Butano, Gazos Camp, Portola, Big Basin, and, for thefirst time, Pescadero Creek County Park breeding areas on 5 days in July 2016. Data from the four preexisting stations were compared with existing prior year data, and the 2014 - 2016 data were subject tostatistical analysis. Total detection numbers for all four stations combined were up in 2016. Thenumber of total detections at Portola reached an all-time high, although mostly due to heard-onlydetections. Total detection numbers and below-one-canopy detection numbers were downconsiderably at Butano, including wing sound detections. As in previous years, every station had at leasta few below-one-canopy detections.The only statistically significant findings of year-to-year changes were an increase in the number ofsingle silent birds flying below one canopy (SSBBC) from 2015 to 2016 at Gazos Creek, a decrease inbelow-one-canopy detections from 2014 to 2016 at Butano, and an increase in heard-only detectionsfrom 2014 to 2016 at Big Basin. Over the same period in Big Basin, there was also an increase in totaldetections and below-one-canopy detections, but it was not statistically significant.INTRODUCTIONThis report discusses the results of 2016 Marbled Murrelet audio-visual (A-V) surveys at fivebreeding areas in the Santa Cruz Mountains. A new station, Pescadero Creek County Park, wasadded to the four stations surveyed last year. This effort is the continuation, on a reducedscale, of a long term inland murrelet monitoring program that was administered by theCalifornia State Parks Department and ended in 2011. That effort included 11 stations and 3 –5 surveys at each station. Results of that effort can be found in Shaw (2011). Other long-termmurrelet A-V surveys in Zone 6 are the Gazos Mountain Camp study which began in 1998, and,consisted of 7 surveys per year at one station (Singer 2013), and the Upper Pilarcitos Creekstudy near Stone Dam on land belonging to the San Francisco Public Utility District.A good long-term murrelet monitoring program should strive to obtain information that willeventually provide answers to the following questions:(1) Which sites are the most important murrelet breeding areas and how does breedingeffort (as indicated by nesting-associated-behaviors) vary from year to year?SW SingerMurrelets in the Santa Cruz Mtns.-2016Page 1 of 23
(2) What is the long-term trend for murrelet use at each site, and for the Santa CruzMountains as a whole?(3) How does murrelet use or murrelet breeding effort correlate to corvid control efforts orlack of same at each site?(4) Is more supporting evidence available for the hypothesis that murrelets in the SantaCruz Mountains population divide themselves into subgroups that regularly use specificwatersheds, flyways, and breeding areas; and that they do not visit more than onebreeding site in the same morning?Consequently, A-V surveys at breeding sites are an important component of any comprehensiveMarbled Murrelet monitoring program.METHODSAudio-visual (A-V) Survey MethodologySurvey procedures followed the 1994 Pacific Seabird Group (PSG) protocol for forest surveys(Evans et al. 2003), starting 45 minutes before sunrise and lasting for a minimum of two hours,or 15 minutes from the last detection. Occupied behavior is defined as flights below onecanopy or circling above one-canopy height but below two-canopy height. This definition isslightly different than that used in the protocol, in Shaw (2011), and in Singer (2013), but theresulting values are very similar and the raw data from Shaw were not available. Audible wingsounds from murrelets not seen were considered to be below-canopy flights by single birds.As in 2015, A-V surveys at all sites in 2016 were done simultaneously. Surveys were done atBig Basin, Butano, Gazos Camp, Portola, Pescadero Creek County Park on these dates: July 1,July 14, July 15, July 21, and July 22. A map showing survey station locations appears inAppendix 2. Surveys were done by Ramona Arechiga, Portia Halbert, Michelle Laskowski, MarkMorrissette, Sean McAllister, Bryan Mori, Bill Webb, and the author. Emily Comfort provided astatistical review of the data to the author for use in this report.In 2011 and prior years A-V surveys were not conducted simultaneously and the number ofsurveys per season (normally 3) was different at Portola and Gazos Camp. Portola had 5surveys per season and Gazos Camp had 6 - 7 surveys per season. No surveys were done atGazos Camp in 2005, and no surveys were done at any of the other sites in 2012 and 2013.Observations were recorded live into tape or digital recorders and later transcribed ontostandard forest survey forms. After many years of problem-free survey data collection, thisyear had several equipment/observer problems arise. On July 1 at Pescadero Creek CountyPark, coverage accidentally ended 19 minutes before the official end survey time. On July 15 atPortola, 10 minutes of data was lost in the middle of the survey and probably about 20 (more orless) detections. On July 22 at Gazos Mountain Camp, data collection started 10 minutes late.The maximum number of Common Ravens detected simultaneously and the maximum numberof Steller’s Jays detected simultaneously were also recorded. It should be noted that corviddetections can’t be collected in the same manner as murrelet detections. This is because asingle raven or jay, unlike a murrelet, can perch on a branch nearby and make intermittent callsSW SingerMurrelets in the Santa Cruz Mtns.-2016Page 2 of 23
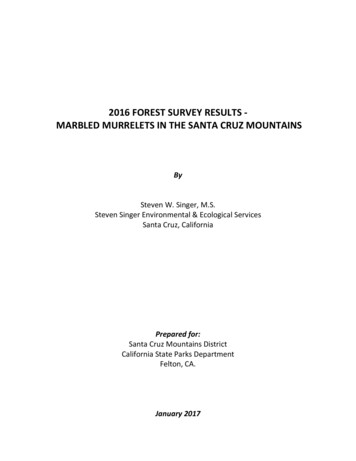
all morning long. Corvid sampling was more comprehensive in 2011 and prior years, and thosefindings can be found in Shaw (2011). In 2016, as in 2014 and 2015, the maximum number ofmurrelets seen in the sky at the same time was also recorded.Statistical Review MethodsA statistical review of the data was performed separately by Emily Comfort (Comfort 2016).She used analysis of variance (ANOVA) to test for differences in the mean number of eachdetection type among four stations (Big Basin, Butano, Gazos Camp, and Portola) over thecourse of the three years. Tukey’s Honest Significant Difference Test (Tukey’s HSD) was used tocompare means across the four stations. Year-to-year variation of all stations combined wasanalyzed using a linear mixed effects model.The data analyzed included a number of different detection types. However only totaldetections, below-one-canopy detections, SSBBC detections, and heard-only detections will bediscussed here.All analyses were performed using R Statistical software (R Core Team 2016) and RStudio(RStudio Team 2016). More details about the methods used and software sourcing can befound in Comfort (2016). Key findings of this statistical review are reported in the Results andDiscussion section.RESULTS AND DISCUSSIONTotal DetectionsTotal Detection values are presented in Tables 1, 2, and 4, graphs 1 and 2, and Boxplots B-1 andB-2.Because murrelet A-V surveys at different sites have been done simultaneously since 2014, wecan get a good sense of the year-to-year changes by looking at the combined values of the fourstations surveyed each year since then. In 2016, they had a sum of 1100 detections, comparedto 853 in the previous year. Daily totals for the combined stations ranging from 162 to 291(Table 1) compared to last year’s range of 108 to 263. The daily mean of the 20 surveysconducted at the four long-term stations in 2016 was 55 (Table 2). The range of totaldetections at Pescadero Creek County Park was 15 to 92, with the mean being 46.8. Thehighest number of detections in a single day was 109 (recorded at Butano on July 21), but thiswould probably have been exceeded by single day detections at Portola on July 15 when 101detections were recorded, but ten minutes of prime activity time was lost. The fewestdetections on any one day, excluding Pescadero Creek County Park, occurred at Butano withonly 25 detections on both July 14 and July 15. Pescadero Creek County Park had one day withfewer total detections – 15 on July 22.There was a decrease in the number of detections at Butano and an increase at Portola and BigBasin. In 2016, only about 50% of all detections came from the combination of Butano andSW SingerMurrelets in the Santa Cruz Mtns.-2016Page 3 of 23
Gazos, compared to 73% in 2015 and 76% in 2014. Graph 1 compares means of Totaldetections in 2016 with values from 2015, 2014, and 2011. Graph 3 compares values back to1995, 1998, 2003, or 2009, depending on the station, using data from Shaw (2011), Singer(2013), and Singer (2010).With the assistance of Jules Evans of Avocet Research Associates and the San Francisco PublicUtilities District, they adjusted their survey dates at Upper Pilarcitos Canyon to comply withours to the extent feasible. Three of their surveys were conducted on the same days as ours.Their total detection numbers from those surveys and the dates: 67 (July 1), 8 (July 14), and 5(July 21). For those same three days, their below-one-canopy detections were 16, 3, and 3.Historically, their detection levels have been lower than ours.Below-one-canopy DetectionsBelow-one-canopy detections are shown in Tables 1 and 2, Graph 3, and Boxplots B-3 and B-4.The four stations surveyed in 2015 had, in 2016, a sum of 186 below-one-canopy detections,compared to 250 last year (Table 1). Daily totals for the combined stations ranging from 20 to51 compared to last year’s range of 25 to 77. The daily mean for the four combined sites was37.2 compared to last year’s 42.7. All four stations combined yielded a sum of 186 below-onecanopy detections, which number represented 17% of all detections made at the four stations.This number is lower than the 29% experienced last year. The highest station total numbers ofbelow-one-canopy detections were made at Gazos Camp (111) and Butano (36), with last year’srespective values at these two stations being 102 and 108 (Table 1). These two stations in 2016comprised 79% of all below-one-canopy detections at the four long-term stations. Thecorresponding value in 2015 was 90%. The total below-one-canopy detections at Portola andBig Basin were 21 and 18, respectively. The total below-one-canopy detections at PescaderoCreek County Park in 2016 were 20.Graph 2 compares means of below-one-canopy detections in 2015 with those from 2014 andwith occupied behavior values from 2011, since below-one-canopy data is not available prior to2014. Graph 4 compares the related metric of occupied behavior back to 1995, 1998, 2003, or2009, depending on the station using data from Shaw (2011) and Singer (2010). Numbers ofbelow-one-canopy detections are usually only slightly less than occupied behavior detections.The only station with a statistically-significant difference from year to year was Butano, with adecline in numbers from 2014 to 2016. However the year-to-year changes were not significant.SSBBC and Wing Sound Detections, and Other Evidence of NestingCertain murrelet behaviors and physical artifacts are believed to be indicative of an active or inactivenest site nearby. In order of decreasing strength of prediction, these are (1) grounded fledgling found,(2) eggshell fragments found, (3) branch landing heard or seen on a potentially suitable nest tree, (4) Jetplane sound heard, (5) SSBBC detections early during the survey period, (6) wing sounds, (7) OtherSSBBC detections, and (8) below-one-canopy and other occupied behaviors (Evans et al 2003, Nelsonand Peck 1995, and Singer et al 1995). It should be noted that only the first two finds are proof certain.A branch landing might be a nest or it might just be a bird practicing tree landings. Information notwidely publicized but made available in Plissner (2015) disclosed the fact that below-one-canopy flightsSW SingerMurrelets in the Santa Cruz Mtns.-2016Page 4 of 23
may be made by a nesting pair at a site throughout the breeding season even when the nest is no longeractive.SSBBC and wing sound detections are presented in Tables 2 and 3, and in Boxplot B-5.In 2016, all of our stations had at least some SSBBC detections and all but Pescadero Creek County Parkhad some wing sound detections (Table 3). The number of SSBBC detections increased at Big Basin,decreased at Butano, and remained nearly the same at Gazos Camp and Portola. The number of wingsounds decreased dramatically at Butano, increased at Gazos Camp and remained nearly the same at BigBasin and Portola. For the four stations with previous year data combined, the total number of wingsounds on all surveys was quite reduced from 2015 – 78 SSBBC detections then versus 27 detections thisyear. There was no station that had wing sounds heard on every survey-day, but Butano and Portolahad wing sounds heard on four of the five days.Heard-only DetectionsHeard-only detections are shown in Graph 5 and Boxplots B-6 and B-7.Heard-only detections are detections in which the bird or birds are heard, but not seen. All ofour survey stations have reasonably good visibility (see Singer, 2015 for Effective Visibilityvalues for each station), so these detections are often distant or very distant birds that maynever approach the survey station. To the extent that this is true, they can be considered to bea different group of birds.Heard-only detections spiked upward at Portola this year, totaling 278 compared to last years107. Consequently, Portola led all stations in this type of detection, with Butano being secondat 165. The percentage of total detections at each station that were heard-only detections was84% at Pescadero Creek County Park, 75% at Portola, 75% at Big Basin, 69% at Butano, and 44%at Gazos Camp. The low value of heard-only detections at Gazos Camp are likely the result ofthe high degree of nesting activities that have been, and continue to be, associated with thissite.The only station with a statistically significant difference from year to year was Big Basin with asignificant increase in heard-only detections from 2014 to 2016.Activity at Individual Survey StationsBig Basin – Total detections, occupied behavior detections, and below-one-canopy detectionswere higher this year than in 2015. From 2014 to 2016 there has been an upward trend intotal detection numbers, but this trend was not found to be statistically significant at the alphalevel of 0.05. In 2016, total detection numbers (daily mean of 36.4) were the highest since2003.SW SingerMurrelets in the Santa Cruz Mtns.-2016Page 5 of 23
From 2014 to 2016, the mean number of heard-only detections went from 6.33 to 15.4, andthen to 27.2. If one extreme value from the 2015 database is removed, heard-only detectionsare statistically greater in in 2016 than in 2015 or 2014 with an adjusted p-value of 0.001 .Unlike last year, there were no instances of tree landings or birds seen carrying fish at Big Basin,or at any of the survey stations.Butano -- Detection numbers at Butano moved in the reverse direction from those at BigBasin. Total detections, occupied behavior detections, and below-one-canopy detections havedecreased over the last two years at Butano. However, the 2016 values are still above the lowsthat occurred from 2006 – 2008. The 2014 – 2016 decline in below-one-canopy detections wasstatistically significant (Boxplot B-8), but the decrease in total detections was not.Also of interest was a large drop in wing sound detections – dropping from 52 in 2015 to 17 in2016.Gazos Camp – Gazos had the second highest number of total detections in 2016, and by far,the highest number of below-one-canopy detections. Gazos had a daily mean of 22.2 belowone-canopy detections and the closest other station to that was Butano which had only 7.2mean daily detections. Gazos also led all other stations in the number of single silent birdsbelow-one-canopy detections with a daily mean of 8.6 compared to 2.2 at Butano and Portola,2.0 at Big Basin, and 0.6 at Pescadero Creek County Park (Boxplot B-9). These results suggestthat more nesting activity was associated with Gazos Camp in 2016 than with any other station.Pescadero Creek County Park – Surveys were conducted in Pescadero Creek County Park onthe Old Haul Road at the crossing of Dark Gulch. Visibility is reported to be reasonably good(Arechiga, pers. comm.). This spot is approximately 4 km. downstream of the Portola surveystation and is on the same murrelet flyway. It is about 3 km. upstream of the old Memorialsurvey station where detection numbers were always lower. The difference may be due tostream noise interference – this location has none whereas Memorial was right on the creek.The daily mean for total detections here was 46.8 which is higher than Big Basin but lower thanGazos Camp and Portola. Few of these detections were of below-one-canopy birds with thedaily mean value being 4.00 which is only 8.5% of the total detections. Heard-only detectionswere 39.2 which represented about 84% of the total detections.Portola - In 2016 Portola had more total detections than any other station, a daily mean of74.2. Last year Portola had only 27.8 total detections. But for a technical glitch, Portola wouldhave had the highest one day value of total detections. On July 15, Portola recorded 101detections, but 10 minutes of data were loss during the prime activity period, and likely 20 or soadditional detections. If these detections would have been recorded, the number would havebeaten the next-highest single day value of 109 at Butano on July 21.SW SingerMurrelets in the Santa Cruz Mtns.-2016Page 6 of 23
This year’s increase in total detections at Portola was the largest single year increase ever notedfor Portola. Most of those detections (75%) were heard-only detections.Even though the mean value of most detection types was the same or larger from year to yearin the 2014 – 2016 period, the increases were not statistically significant.Statistical Review of Year-to-Year Changes at the Same StationHeard-only detections increased significantly at Big Basin from 2014 – 2016 (with the removalof one extreme value in 2015 from the data set). The Butano station had a statisticallysignificant decline in below-one-canopy detections overall from 2014 to 2016, however theyear-to-year changes were not statistically significant (Boxplot B-8).For the other detection types, and all other stations, there were no statistically significanttrends over the three year period – either increasing or decreasing over all three years.Statistical Review of Differences Between Stations, 2014 – 2016The statistical review found that: (1) Butano and Gazos Camp have similar detection levels (highlevels), (2) Portola and Big Basin have similar detection levels (low levels), and (3) there is asignificant difference between the high-level stations and the low-level stations. This is true fortotal detections, below-one-canopy detections, and SSBBC detections (Boxplots B-1, B-3, and B5). The only detection type that does not fit this characterization is heard-only detections(Boxplot B-6). Portola had more heard-only detections, on average, than Gazos, but there wasnot a statistically significant difference. There is no statistical evidence for a difference inheard-only detections among the four stations.Detection values from Pescadero Creek County Park were not used in this analysis, because itwas only surveyed this year.Statistical Review of Differences Between Stations, 2016 onlyIn 2016, Gazos Camp had significantly greater below-one-canopy detections and SSBBCdetections than all other stations, including Pescadero Creek County Park (Boxplots B-4 and B9). There were no significant differences between the other stations. No station had asignificant difference with the others when looking at total detections (Boxplot B-2) and heardonly detections (Boxplot B-7).Common Raven and Steller’s Jay Numbers in 2016Although individual raven or jay detections were not recorded, the maximum number of ravensand jays detected at any one moment (seen and/or heard) was recorded. The greatestSW SingerMurrelets in the Santa Cruz Mtns.-2016Page 7 of 23
simultaneous number of ravens was 9, which were detected at Pescadero Creek County Park onJuly 15. Ravens were detected on all five days at Big Basin and Pescadero Creek County Parks,on 3 days at Portola, and on 2 days at Gazos Camp. No ravens were detected on any of the 5surveys at Butano this year.The maximum number of jays detected simultaneously was 9 which was detected on one day atPortola. All stations had at least one jay present each day with the exception of PescaderoCreek County Park where jays were absent on two days.RECOMMENDATIONS1. If not all stations can be monitored in 2017, it is recommended that priority be givento monitoring Big Basin, Gazos Camp, and Pescadero Creek County Park.2. Continue to do surveys at different sites simultaneously. This provides a clearerestimate of the relative levels of murrelet activity at each site.3. Consider implementation of long-term, season-long accoustic monitoring effort atGazos Mountain Camp, to co-exist with the A-V survey program there and not to replaceit. The additional accoustic detection data would be helpful in the interpretation of theA-V survey results and vice-versa.4. Park managers should continue to manage all survey sites in such a manner as tomaintain the relatively high levels of murrelet activity therein.ACKNOWLEDGEMENTSThanks to Bill Webb, Mark Morrissette, Bryan Mori, Sean McAllister, Michelle Laskowski, PortiaHalbert, and Ramona Arechiga for conducting A-V surveys. Much gratitude is expressed toEmily Comfort for doing the statistical analysis. Special thanks to the San Mateo County ParksDepartment for conducting the surveys at Pescadero Creek County Park at their own expense.Thanks also to the San Francisco Public Utilities District and Avocet Research Associates forcoordinating their survey dates with this study.This work was supported financially by the California State Parks Department. Thanks toCalifornia State Parks Department staff for their assistance and especially to Portia Halbert,Joanne Kerbavaz, Stanley Kopacz, Terry Kiser, and Emily Bertram.LITERATURE CITEDComfort, E. 2016. Statistical Analysis of 2014-2016 Marbled Murrelet Surveys in theSanta Cruz Mountains. Unpublished report prepared for Steven Singer Environmentaland Ecological Services.SW SingerMurrelets in the Santa Cruz Mtns.-2016Page 8 of 23
Evans, M.D., W. Ritchie, S. Nelson, E. Kuo-Harrison, P. Harrison, and T. Hamer 2003.Methods for Surveying Marbled Murrelets in Forests: A Revised Protocol for LandManagement and Research. Pacific Seabird Group Technical Publication #2.Nelson, S.K., and R.W. Peck. 1995. Behavior of Marbled Murrelets at Nine Nest Sites inOregon. Northwest Naturalist 76: 43 – 53.Plissner, J.H., B.A. Cooper, R.H. Day, P.M. Sanzenbacher, A.E. Burger, and M.G. Raphael.2015.A Review of Marbled Murrelet Research Related to Nesting Habitat Use and NestSuccess.Unpublished report prepared for the Oregon Department of Forestry by ABR, Inc.,Forest Grove, Oregon.R Core Team. 2015. R: A Language and Environment for Statistical Computing. RFoundation for Statistical Computing, Vienna, Austria.R Studio Team. 2015. RStudio: Integrated Development for R. RStudio, Inc., BostonMA.Shaw, B. 2011. Summary of 2011 Marbled Murrelet Monitoring Surveys in the SantaCruz Mountains (Draft). Unpublished report prepared for the Santa Cruz District ofCalifornia State Parks Department. Klamath Wildlife Resources, Redding, CA.Singer, S.W. 2015. 2015 Forest Survey Results – Marbled Murrelets in the Santa CruzMountains. Unpublished report prepared for the Santa Cruz District of the CaliforniaState Parks Department. Steven Singer Environmental & Ecological Services, Santa Cruz,CA.Singer, S.W. 2014. 2014 Forest Survey Results – Marbled Murrelets in the Santa CruzMountains. Unpublished report prepared for the Santa Cruz District of the CaliforniaState Parks Department. Steven Singer Environmental & Ecological Services, Santa Cruz,CA.Singer, S.W. 2013. Results of 2013 Marbled Murrelet Surveys at Gazos Mountain Campand Other Sites. Unpublished report. Steven Singer Environmental & EcologicalServices, Santa Cruz, CA.Singer, S.W. 2010. Final Report – Part II, Results of Marbled Murrelet Audio-VisualSurveys at Gazos Mountain Camp 1998 – 2010. Unpublished report prepared for theSW SingerMurrelets in the Santa Cruz Mtns.-2016Page 9 of 23
Apex Houston Trustee Council and the California Department of Fish and Wildlife.Steven Singer Environmental & Ecological Services, Santa Cruz, CA.Singer, S.W., D.L. Suddjian, and S.A. Singer. 1995. Fledging Behavior, Flight Patterns, andForest Characteristics at Marbled Murrelet Tree Nests in California. NorthwestNaturalist 76: 54 – 62.SW SingerMurrelets in the Santa Cruz Mtns.-2016Page 10 of 23
APPENDIX I – Tables, Graphs, and BoxplotsTable 1. 2016 Total Detections and (Below-one-canopy Detections)Table 3 provides the number of total detections and below-one-canopy detections (shown inparentheses) on every 2016 survey at all sites and provides the Standard Deviation (STDEV) andCoefficient of Variation (CV) for each site. CV values were high for all sites except for Total Detectionsat Gazos Camp and the 4 Sites Combined. 2015 values are included on bottom line for comparison.DateBig BasinButanoJuly 1July 14July 15July 21July 222016TOTALMEAN31 (6)52 (5)30 (1)30 (1)39 (5)STDEVCV2015TOTAL48 (2)25 (4)25 (3)109 (23)34 (4)GazosCamp58 (5)61 (25)56 (20)70 (25)61 (36)182 (18)36.4(3.6)9.50(2.41)0.26(0.27)241 (36)48.2(7.20)35.27(8.87)0.73(1.23)90 (12)313 (108)Portola89 (7)71 (1)101 (10)82 (2)28 (1)PescaderoCreek Co Pk39 (1)27 (2)92 (14)61 (3)15 (0)4 SitesCombined*226 (20)209 (35)212 (34)291 (51)162 (46)311 (111)61.2(22.2)5.36(11.26)0.09(0.51)371 (21)74.20(4.20)28.03(4.09)0.38(0.97)234 (20)46.80(4.00)30.45(5.70)0.65(1.43)1100 (186)220.00(37.2)46.44(12.0)0.21(0.32)311 (102)139 (28)853 (250)* Excludes values from Pescadero Creek County Park.SW SingerMurrelets in the Santa Cruz Mtns.-2016Page 11 of 23
Table 2. Frequency of Detection Types in 2016, 2015, and 2014– Four Stations Combined*Type of DetectionTotal 2016 Combined Daily Mean(of 20 survey-days)Total 2015Combined DailyMean(of 20 survey-days)Total 2014Combined DailyMean(of 12 survey-days)5542.737.8Total Visual Detections19.514.916.7Below 1 CanopyDetectionsSingle Silent BirdsBelow 1-Canopy9.39.88.63.64.73.3Total DetectionsNotes: * Excludes values from Pescadero Creek County Park and Memorial County Park.Table 3. 2016 Single Silent Birds Below-one-canopy (SSBBC) and Wing Sound(W) Detections. Wing sound detections are shown in parentheses. C.V. stands forCoefficient of Variation. Note that SSBBC excludes vocalizing birds but includes single birdsmaking a wing sound, but not a pair of birds making a wing sound. SSBBC and W detections arebelieved to have a strong predictive value of an active or inactive nest site nearby, especiallywhen detected on multiple days. 2015 total included at bottom for comparison.DateBig BasinButanoJuly 1July 14July 15July 21July 222016TOTALMEAN4 (4)2 (0)1 (0)0 (0)3 (3)10(7)2.00(1.4)1.58(1.95)0.79(1.39)4(8)2 (3)0 (2)7 (3)1 (1)1 V2015TOTALGazosCamp1 (0)12 (0)14 (0)8 (4)8 (0)43(4)8.6(0.8)4.98(1.79)0.58(2.24)42(9)Portola2 (3)0 (2)7 (3)1 (1)1 roCreek Co Pk0 (0)0 (0)1 (0)2 (0)0 (0)3(0)0.60(0)0.89(0)1.49(0)--4 SitesCombined*9 (10)14 (2)29 (6)12 (6)13 (3)77(27)15.4(5.4)7.83(3.13)0.58(0.58)89(78)Note: * Excludes Pescadero Creek Co. Pk.SW SingerMurrelets in the Santa Cruz Mtns.-2016Page 12 of 23
Table 4. Comparison of Murrelet Activity Levels at Each Park for All Data Years.Values from 2011 and prior years are from Shaw (2011) or Singer (2013, 2010). The multiplepark monitoring program began in 2003, but two stations had earlier data that is included here.Note that only since 2014 were different station surveys conducted on the same day.StationYearNAverageAverageTotal Detections Occupied Beh.DetectionsBig Basin – Redwood 536.46.4Portola – Peters Creek 011555.016.7““2014327.72.3“ “ – near Peters Creek Bridge2015527.85.6“ “ – near Peters Creek Bridge2016574.213.4Butano – Little Butano Creek““““““SW Singer20032004200520063333Murrelets in the Santa Cruz Mtns.-201634.068.326.748.06.022.04.04.3Page 13 of 23
StationYearNAverageTotal DetectionsAverageOccupied Beh.DetectionsButano – Little Butano 48.25.73.02.06.727.721.610.6Memorial – 0.00.30.00.00.01.00.37.7Gazos Camp – Gazos Mtn. 13.320.430.0Pescadero Creek County Park2016546.86.6SW SingerMurrelets in the Santa Cruz Mtns.-2016Page 14 of 23
SW SingerMurrelets in the Santa Cruz Mtns.-2016Page 15 of 23
SW SingerMurrelets in the Santa Cr
analyzed using a linear mixed effects model. The data analyzed included a number of different detection types. However only total detections, below-one-canopy detections, SSBBC detections, and heard- only detections will be discussed here. All analyses were performed using R Statistical software (R Core Team 2016) and RStudio (RStudio Team 2016).