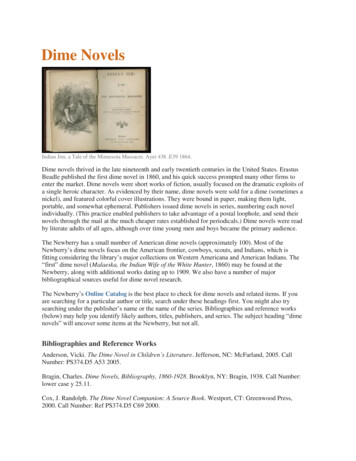
Transcription
Drug and Alcohol Dependence 90S (2007) S27–S39How much for a dime bag? An exploration of youth drug marketsLana D. Harrison a, , Patricia G. Erickson b,1 , Dirk J. Korf c,2 ,Serge Brochu d,3 , Annemieke Benschop c,2a Center for Drug and Alcohol Studies, University of Delaware, 77 E. Main St., Newark, DE 19715, USASocial, Prevention and Policy Research Department, Centre for Addiction and Mental Health, T-418, 33 Russell Street, Toronto, Ontario, Canada M5S 2S1c Criminologisch Instituut Bonger, Universiteit van Amsterdam, Oudemanhuispoort 4-6, P.O. Box 1030, 1000 BA Amsterdam, Netherlandsd Centre International de Criminologie Comparee (CICC), Universite de Montreal, C.P. 6128, Succursale Centre-ville, Montreal, Quebec, Canada H3C 3J7bReceived 16 March 2006; received in revised form 11 September 2006; accepted 18 September 2006AbstractRelatively little is known about how youth obtain marijuana and other drugs. The Drugs, Alcohol and Violence International (DAVI) study exploredyouthful drug markets among samples of school students, detained youth, and school dropouts (ages 14–17 years) in the greater metropolitan areasof Philadelphia, Toronto, Montreal, and Amsterdam. Students frequently reported sharing drugs, either getting them from others or giving them toothers for free. Sharing was less common among the more drug-involved detainees and dropouts. Marijuana was typically obtained either outdoorsor in a house or apartment. Few youth reported getting marijuana at school. In Amsterdam, where marijuana can be purchased in small quantitiesin coffeeshops, this was the most common place to get marijuana, even though 18 is the legal age for purchase. Alcohol was also most likely to beobtained in stores or restaurants across all the sites, even though none were of legal age except those in Amsterdam age 16 or older. Youth mostoften reported purchasing marijuana in nickel, dime or other small bags, which are not standardized units. The exception again was Amsterdam,where youth most often reported quantities in grams or joints, which is how it is sold in coffeeshops. The lack of standardization of units makeseconomic cost estimates suspect. Even standardized units such as alcohol present problems since youth report a wide range of ‘typical purchases.’Survey data can, however, more aptly describe drug market characteristics such as general location of purchase, and relationship with the seller. 2006 Elsevier Ireland Ltd. All rights reserved.Keywords: Drug market; Youth drug use; Marijuana markets; Drug prices1. IntroductionIn the U.S., since the early days of Harry Anslingers’ talesof ‘drug peddlers’ getting kids hooked on drugs, Americanshave been concerned about youth’s access to drugs (Anslingerand Cooper, 1937). Yet, relatively little is known about drugacquisition patterns among youth. If we are to understand illicitdrug use, it is also necessary to understand the dynamics of howillicit drugs are obtained. Although epidemiological surveys arerich with information on prevalence rates and the characteris- Corresponding author. Tel.: 1 302 831 6107; fax: 1 302 831 3307.E-mail addresses: lharriso@udel.edu (L.D. Harrison),pat erickson@camh.net (P.G. Erickson), D.J.Korf@uva.nl (D.J. Korf),Serge.Brochu@UMontreal.ca (S. Brochu),W.J.Benschop@uva.nl (A. Benschop).1 Tel.: 1 416 595 8501; fax: 1 416 595 6899.2 Tel.: 31 20 525 3930; fax: 31 20 525 3943.3 Tel.: 1 514 343 7065; fax: 1 514 343 2269.0376-8716/ – see front matter 2006 Elsevier Ireland Ltd. All rights reserved.doi:10.1016/j.drugalcdep.2006.09.009tics of those who use, they provide little information on drugmarkets—or how illicit drugs are obtained.The goal of this paper is to advance knowledge about drugmarkets among youth by providing descriptive information ondrug market acquisition in four sites in three countries. Thispaper examines the type of location in which youth typicallyacquire marijuana and alcohol, and to a lesser extent crackcocaine, whether they obtain these drugs in social friendshipnetworks or from drug dealers, and the costs of the drugs theytypically purchase. The data are derived from the Drugs, Alcohol and Violence International (DAVI) study that includes acomprehensive cross-section of youth ages 14–17 years, withrepresentative samples of school students and detained youth,and a diverse sample of school dropouts in Philadelphia, Amsterdam, Toronto and Montreal. (The Amsterdam site did notconduct a school survey.) Therefore, the DAVI study providesinsights on drug acquisition from more normative (students) aswell as more deviant youth (dropouts and detainees). As well, theinternational cities included in the study, differ on drug control
S28L.D. Harrison et al. / Drug and Alcohol Dependence 90S (2007) S27–S39polices including age of majority to access alcohol, and accessto marijuana.Detainees and dropouts may operate in different worlds whenit comes to drugs compared with the more normative populationof students. Therefore, it is important to examine the full rangeof youth. Of course, even among students there are outliers,and those who may move between the populations of studentto those of detainee or dropout. The school setting may alsoprovide access to drugs for students, but perhaps not as much fordetainees or dropouts, who are rarely or no longer in attendance.1.1. Drug markets and availabilityRelatively little is known about the social and interpersonalcontext of how individuals obtain illicit drugs. Epidemiological survey data on the prevalence of drug use among youthand adults in the U.S. and Canada have been available formany years, and have become increasingly available in Europeancountries over the past decade. Youth, and students in particular, have often been the focus of these surveys. Nevertheless,information on the dynamics of how illicit drugs are obtained ismeager.The U.S. national epidemiological surveys of drugs generally ask ‘availability’ questions that are basically ‘how difficultdo you think it would be for you to get drug [x], if you wantedsome’ with responses ranging from very easy to probably impossible. Interestingly, data from the U.S. national student survey– the Monitoring the Future (MTF) study – show that nearly90% of high school seniors have reported marijuana is ‘fairlyeasy’ or ‘very easy’ to get since the study began in 1975. Manywould argue this measure of availability is not very sensitive.Further, availability has not varied with the trends in marijuanause among seniors (while perceived risk of using the drug has)(Bachman et al., 1988; Johnston et al. 2006). However, analysesby economists have challenged these findings, suggesting thatindeed, the price of marijuana has trended with usage (Caulkins,1999; Pacula, 1998), and that marijuana use is more prevalentamong U.S. students in the 10 states that decriminalized marijuana in the mid to late 1970s (Saffer and Chaloupka, 1998).These analysts suggest that previous analyses have focused onshort-term changes when long-term changes are key. The MTFsurvey trend data show the pattern of cocaine availability hasfluctuated a bit more than marijuana, but availability peakedabout 5 years after cocaine use peaked (Bachman et al., 1990).While this would suggest there is not necessarily a linear relationship between availability and use, not surprisingly, the illicitdrugs reported easily available by the highest percentage of students are the ones most frequently used–primarily marijuana,and of course, alcohol. Alcohol availability is generally notreported by MTF, although patterns of use and heavy use (5or more drinks in a row in a setting in the past 2 weeks) are.About 80% or more of 12th grade high school seniors reportalcohol use in their lifetime, even though the legal age for purchase in the U.S. is 21. High school seniors are generally age 18.About two-third of 10th graders and more than 40 percent of 8thgraders report lifetime alcohol use (Johnston et al., 2006). It isgenerally known that alcohol is purchased by older friends andrelatives, or by youth themselves, often with fake identification(ID). Many European countries allow youth to legally drink beerat age 16, and spirits at age 18.Recent school surveys among student’s ages 15–16 in 30European countries (Hibell et al., 2004) examined patterns ofillicit drug availability and acquisition among youth. Like theirU.S. counterparts, the illicit drug most likely to be used by students was marijuana. Most students who had used an illicit drughad only used marijuana. The European School Survey Projecton Alcohol and Other Drugs (ESPAD) study asked youth aboutthe situation in which they first used an illicit drug. Youth generally initiated drug use with a small group of friends, an olderfriend, or an older brother or sister. Rarely did youth report purchasing drugs from a friend or someone else. Over half of thestudents (55%) reported knowing one or more places to purchasecannabis (marijuana or hashish) easily. Discotheques, bars, etc.,were mentioned most often (27%), followed by public placessuch as streets and parks (23%), then houses of dealers (21%),schools (16%) and ‘other’ (13%).The general population survey on drug use in the Netherlands asks youth where they acquire cannabis. The most frequentresponse was from friends and relatives (47%). However, asurprisingly large percentage of 12–17 year olds reported ‘coffeeshops (37%)’ (Abraham et al., 2002). Coffeeshops in theNetherlands sell small quantities of cannabis, up to a limit of5 g, in small bags or pre-rolled ‘joints.’ However, the age to purchase cannabis is 18. Of course, these youth could have intendedthis answer even when an older friend or relative purchased thedrug, which is suggested by a recent survey of youth cannabisusers (Korf et al., 2005). As is common with alcohol, they couldalso have used a ‘fake ID,’ identifying themselves as older. TheNetherlands National School Survey (ages 12–18 years) alsoincludes questions on where cannabis users buy or get theircannabis. Most reported from friends (67%), followed by coffeeshops (35%), and then a ‘dealer’ (12%) (Monshouwer et al.,2004).In the U.S., there are some comparable data on drug markets.In 1992, questions were first added to the U.S. National Household Survey on Drug Abuse (NHSDA) to assess how peopleobtained marijuana and cocaine. A series of specific questionsasked detailed questions about use as well as acquisition patterns. At the time, the study was representative of the populationof the coterminous U.S., ages 12 and older. Those who reportedpast month marijuana use (5.2%) were asked separate questionsabout how they obtained any of the marijuana they used in thepast month. Most (3.1%) reported others shared it, 2.4% reportedthey bought it from friends or acquaintances, 1.8% said it wasgiven to them, and 1.2% said they bought it from a dealer. Nearlyhalf those who used (46%), reported they spent no money for it.The results suggest people most often share or are given marijuana. However, the low prevalence on these questions did notinspire a lot of confidence in the data. The questions were subsequently dropped in 1994.More recently, the successor to the NHSDA, the NationalSurvey on Drug Use and Health (NSDUH), has been asking anationally representative sample of the U.S. population aboutmarijuana purchases. The questions are directed to past year
L.D. Harrison et al. / Drug and Alcohol Dependence 90S (2007) S27–S39users. Data from 2002 show that 19% responded to the questionsabout how they got the marijuana they used the last time, with10.6% reporting getting it for free or sharing it with others, and6.9% reporting buying it. Among those who ‘bought’ marijuana,the majority indicated they last purchased it in an apartmentor home. When asked the quantity of marijuana purchased, ascant 3.1% reported purchasing marijuana in ounces (parts ofounces or pounds), 0.5% reported their most recent purchasewas in grams, and 0.4% reported they last purchased marijuanain joints. In order to gain precision in measurement, questionson the various quantities were offered, but there are missing dataon the questions about purchases, even allowing for those whoreported their last use was free or shared. It appears that pricequestions may be especially sensitive. That it, respondents maybe willing to report use, but less willing to report finer detailsabout use—especially as it relates to black market purchases.However, the lack of standardization of units is also of concern.Illicit drugs are often marketed in weight/cost bags—so a nickelbag for US 5, and a dime bag for US 10. How would those whopurchased nickels or dimes respond to the prior questions—didthey purchase in grams, parts of ounces or joints (perhaps bluntsin the case of marijuana)?The drug markets for marijuana may be much different thanthe markets for cocaine and crack, just as they differ from alcoholdue to its legality for adults. The raw products for cocaine andheroin – coca bushes and opium poppies – are not grown easilyin the U.S., Canada, or northern European countries. These products are largely imported from countries with warmer climates.With respect to marijuana however, there appears to have beena different trajectory. Marijuana was imported to the U.S. andCanada primarily from Mexico in the 1960s, 1970s, and 1980s,but increased surveillance and the bulk of the drug increasedthe costs to traffickers. It appears that as pressure was placedon Mexico, Colombia became a major marijuana exporter. But,Colombian traffickers switched to cocaine that is worth morein weight than marijuana. It further appears the dearth in themarijuana market led to increased indoor and outdoor growingoperations in the U.S. Marijuana consistently ranks in the top 10cash crops (among corn, soybeans, and hay), and is easily valuedin excess of 10 billion annually in the U.S. (National Associationfor the Reform of Marijuana Laws, 2006). Domestic marijuanaproduction appears to be increasing and in 2000 it was estimatedthat 1.047 metric tonnes were consumed, and 1.24 million kilograms were seized (ONDCP, 2004). The United Nations DrugControl Program (UNODC, 2005) estimates that 1.224 millionkilograms of marijuana were seized in the U.S. in 2003, about21% of the world’s seizures. According to UNDCP, 10 kg ofmarijuana were seized in Canada in 2003. The Royal CanadianMounted Police (RCMP, 2002) seized an estimated 1.4 millionplants in 2001, a six-fold increase since 1993. The CanadianGendarmerie royale du Canada (2002) estimated cannabis production at about 800 tonnes. In the Netherlands, cannabis hasbeen available in small-scale purchases for more than 25 years.However, imported hashish was traditionally the most commoncannabis product, but domestically indoor cultivated marijuanahas taken over in recent years. Over 1.1 million marijuana plantswere seized in 2003 (NDM, 2004).S29The available information across a number of surveys suggestmarijuana is much more likely to be sold indoors, and that transactions are made between friends and acquaintances (Caulkinsand Pacula, 2006). Rarely do reports suggest marijuana isobtained through street markets or stereotypical drug dealers.However, some recent survey data from the U.S. Departmentof Justice shows adult arrestees often report buying marijuanaoutdoors (ADAM, 2003). Data from a pilot study in six majorU.S. cities conducted under the auspices of the Arrestee DrugAbuse Monitoring study (ADAM), found arrestees reported theymost often purchased crack cocaine in outdoor markets in theirown neighborhoods (Riley, 1997). The study also concludedthat crack users increased their likelihood of arrest because thetransactions were more frequent and more likely to take placeoutdoors. Nevertheless, more than 85% of crack and 88% ofheroin purchasers made indoor purchases in residences. Additionally, crack users were less likely to buy from a main sourceand had more extensive networks of dealers, thereby introducingadditional risks for arrest.The ADAM study began asking questions about drugpurchases in all 39 sites in 2000. Those who reported usingdrugs in the past 30 days were asked how they got them. Thestudy confirmed that a substantial portion of the street leveldrug trade consists of combinations of goods and services beingexchanged, in addition to or in place of cash (Taylor et al.,2001; Golub and Johnson, 2004). At many sites, marijuana wasthe drug for which cash-only transactions were proportionatelylower than cocaine or crack. Among males who reportedpaying cash for the drug in the past 30 days, a median of 29%reported they had purchased marijuana outdoors, comparedwith 50% of crack and 55% of cocaine purchasers. There wassubstantial variation across the sites, with outdoor marijuanapurchases reported by about 75% of adult male arrestees inthree sites (including New York and Philadelphia, and NewOrleans). Outdoor purchasing dominated the market for crackand cocaine in these sites too (Taylor et al., 2001).Of course, since so little is known about youthful ‘drugmarkets,’ there is little source of comparison with adult markets.Youthful drug markets or drug acquisition patterns may resemble those in adult drug markets, or they may assume their owncontours and dimensions. With the exception of the ADAMstudy, even adult drug markets are largely unexplored territoryin the U.S. Most available data is from a few ethnographicstudies, which largely focus on heroin or crack in New York orother large U.S. cities. The ADAM data is limited in well in thatit only included recent arrestees, who are certainly an importantpopulation, but may differ in their drug market participationpractices from more general populations. The contribution ofthis paper is to describe drug acquisition patterns and drugmarkets among a comprehensive cross-section of youth, and in4 sites in 3 countries.1.2. Drug pricesAnother area ripe for increased research is information onthe price consumer’s pay for drugs in the illicit drug market(Anthony, 2005). In the U.S., two systems under the auspices
S30L.D. Harrison et al. / Drug and Alcohol Dependence 90S (2007) S27–S39of the Department of Justice examine prices (along with otheraspects of the drug market), but both are fraught with limitations. The System to Retrieve Information from Drug Evidence(STRIDE) includes data on the price and purity of drugs purchased by undercover agents. Drug buys negotiated by undercover DEA agents in the streets of major metropolitan areasare analyzed and records kept on the quantity, price, purity, andpurchase location. These tend to be wholesale sales, and thereis less coverage of marijuana—the most prevalent illicit drugin the U.S. (and other industrialized nations). This file is, however, available to the public, and widely used by economistsin conducting analyses on the price elasticity of drugs. TheSTRIDE information is currently the best available indicatorof the wholesale price of various drugs in the U.S. Anothermonitoring system, under management of the Bureau of JusticeAssistance, is the Regional Information Sharing System (RISS).Emphasis is on drug trafficking and not drug users per se. RISSdata are not available to the public.Relatively little data are available from survey research onprices. The previously referenced 1992 U.S. National Household Survey on Drug Abuse (NHSDA) included questions toassess the money respondents spent on marijuana and cocainein the past month. Of the 4.8% who responded to this question,46% reported they spent no money for it. Of the less than 1% whoreported past month cocaine use, 38% spent no money. The 2004NSDUH found 56% reported their most recent acquisition wasfree. Sharing was also commonly reported among male arrestess in the ADAM study. This adds a huge wrinkle in trying toestimate costs, when so much of the consumption appears tobe ‘free’ or shared. The ADAM study also included questionson cash expenditures for drugs. Of those who reported purchasing drugs, the most common units reported for marijuana,crack and heroin was the bag. Few users reported quantitiesin grams or ounces, with many respondents specifying nickel,and dime bags. Quantity (even ignoring purity) is not standardized, so precision would be lacking in estimates of price pergram. Nevertheless, a considerable body of literature has developed from economists in the U.S. generating estimates on theprice-elasticity of demand for drugs using the STRIDE data. Theargument (see Caulkins, 2007) is that with proper methods, datacan be extracted from STRIDE, and “it is typically better to havesome information than none”.The National Academy of Sciences recently convened a panel(Committee on Data and Research for Policy on Illegal Drugs)at the request of the Office of National Drug Control Policy(ONDCP) to examine existing research studies and statisticaltools available to help inform policy decisions. The genesis ofthe committee resulted from articles published using economiccost modeling that arrived at different conclusions regarding theeffectiveness of U.S. drug interdiction efforts—one by members of the armed services indicating it was cost-effective andthe other by members of the RAND Drug Policy Center indicating interdiction was not (Manski et al., 2001). Most of thequestions regarding the quality of current policy studies stemfrom the limitations of data on illicit drugs. Economic analysisuses various models and other tools to compensate for the limitations of the existing data by integrating information from avariety of sources to produce an overall picture. But, the capacity of even sophisticated analytical techniques to compensate forthe limitations of the existing data has been questioned by manyin the research and policy communities (Manski et al., 2001).Golub and Johnson (2004) demonstrate the effects of using different assumptions about the ADAM data to generate drug costsor expenditures for male arrestees. This paper explores illicitdrugs costs reported among a comprehensive cross-section ofyouth in the DAVI study, to reflect on the nuances, adequacy,and ability of the data to produce prices estimates.2. Methods2.1. The DAVI studyThe DAVI study employed uniform methodological procedures that weredeveloped initially in Philadelphia and Toronto, and then applied across all siteswith minimal adaptation for cultural and systemic variation. The same definitionsof target populations, interview modes and survey techniques were used, as wellas standardized questionnaires. These were translated into Dutch and French, asrequired, from the original English version. Fieldwork began in 2000 and wascompleted in 2003.The geographical capture area of the four DAVI sites is larger than thecity their names suggest. In the U.S. and Canada, Census Metropolitan Areas(CMAs) are defined by the statistical agencies of each country. The CMA istypically a very large urban area (urban core) together with adjacent urban andrural areas (urban and rural fringes) that have a high degree of social and economic integration. For example, the Philadelphia CMA includes 14 counties, ofwhich Philadelphia county represents approximately a quarter of the population.The Amsterdam site included three provinces (Noord-Holland, Flevoland andUtrecht), an area that we call the Amsterdam TPA (Three Provinces Area). (SeeAdlaf et al., 2006, for more information on the DAVI study.)In Philadelphia, Toronto, and Montreal, the student sample was drawn fromhigh school classrooms in grades 9–12 in randomly selected schools in the CMA.Both school and student participation was acceptable. In Toronto, 8 schools and72.8% of students participated, in Montreal, 8 schools and 84.3% of studentsparticipated, and in Philadelphia, 7 schools and 84.4% of students participated.Existing socio-demographic differences in the 3 sites are well represented in thesamples. Although gender and age differ significantly across sites, the differences are generally nominal. As Table 1 illustrates, among students, there areapproximately equal proportions of males and females in each site, although theToronto site contains somewhat more females than Philadelphia and Montreal.As well, although there are fewer youth aged 16–17 in Montreal, the mean agedoes not differ much across sites. More dominant sample differences are evident from race, language, and SES variables. Although each sample shows racialvariation, compared to other samples, the Philadelphia sample contains proportionally more Blacks, the Toronto sample contains proportionally more Asians,and the Montreal sample contains proportionally more Whites. Although eachsite contained low SES schools by design, the weighted percentage of studentsattending low SES schools was 29% in Philadelphia, 37% in Toronto and 38% inMontreal. The total sample of students was 2503 (Philadelphia N 712; TorontoN 824; Montreal N 967), and has been weighted in the analysis to reflect thestudent sample overall in these sites (Table 1).The detainees were recruited from secure institutions serving the Metropolitan areas of each site where youth who had been sentenced or were awaiting trialwere held in custody. Youth were not selected in relation to any known history ofdrug use, and the researchers did not know the offense(s) for which youth weredetained. In Philadelphia, where detention services are generally organized at acounty level, a representative sample of 5 detention centers was drawn from thecensus of 12 institutions in the CMA. The goal was to interview 20 males and 20females at each of the five institutions in the Metropolitan area, resulting in anoversampling of females. The sample was then weighted for sample selectioncharacteristics to represent the population of detained youth in the PhiladelphiaCMA (based on the annual number of youth detained, but not controlling forgender differences). In Canada, detention services are organized at the provincial
L.D. Harrison et al. / Drug and Alcohol Dependence 90S (2007) S27–S39S31Table 1Sample demographic characteristicsPhiladelphiaNMale (%)White (%)Black (%)Asian (%)Other (%)16–17 ��––40.018960.8––––59.3level, and in the Netherlands, they are organized at a national level. Since somefacilities housed youth from outside the target Metropolitan area, it was necessary to have staff assist with the initial eligibility criteria (i.e., residence andage) before permission was sought from individual youth. All those eligible whoagreed to participate were interviewed privately in a one-to-one situation. Therewas very little refusal, and a small monetary stipend was offered to respondents.Detention centers were visited repeatedly until samples were complete. It tookmany more visits to secure the sample of females compared with males. TheToronto site had the fewest detained girls across the sites, but the 18.5% of girlscompares to 9% of girls in custody overall—so still an oversample. Anotherimportant sample dimension is that in Toronto and Montreal, researchers wereallowed access only to sentenced youth, whereas in Philadelphia and Amsterdam, detained youth awaiting disposition were also included.The samples in Toronto, Montreal, and Amsterdam reflect a census of eligibleyouth in all local institutions housing detained youth from these cities duringthe time period of the fieldwork. Their demographic characteristics were morediverse than those of the student samples. Males comprised 82% of the Torontodetainees, 68% of the Montreal detainees, 66% of the Amsterdam detainees, and56% of the Philadelphia sample of detainees. While 56% of Toronto detaineeswere White and 25% Black, this was reversed in Philadelphia where 34% wereWhite and 54% Black; “other” race was a smaller proportion in both thesecities. In Montreal, the majority of the sample was White (74.3%). Race wasnot recorded in Amsterdam as a matter of national practice. The age split fordetainees was about the same in Philadelphia and Toronto, with 36–40% under16 years; however 60% were under 16 in Amsterdam, and in Montreal, 23%were under 16, reflecting the provincial policy discouraging incarceration ofyounger youth. One of the limitations of the study is the unevenness across sitesin sample composition by gender, race, and age. However, since this is intendedas merely a descriptive paper, these differences are ignored.The dropout samples numbered 181 in Philadelphia, 200 in Toronto, 139in Montreal, and 189 in Amsterdam. A dropout was defined as a 14–17 yearold youth who had left school for at least 30 consecutive days during the past12 months. Most youth in the sample were located in agencies that providededucational, social or outreach services to youth, and the others were located onthe ‘street’ or contacted through snowball sampling. Agencies were contactedby project staff and asked for permission to either allow researchers to makecontact with youth on their premises or to have advertisements posted at theirsite. To ensure sample heterogeneity, in Amsterdam and Philadelphia, youthwere contacted in various agencies across the CMA, or TPA. In Toronto andMontreal, due to the lack of field services located outside the core cities, themajority of dropouts were recruited in agencies in the city center. Althoughtheir residences spanned both the inside and outside city strata, the majority wasfrom the core with lesser representation outside the city. The smaller number inMontreal is due to the fact that the Montreal team joined the DAVI study while inprogress, and had an abbreviated field period to recruit dropouts. The percentageof males was 56% in Philadelphi
Drug and Alcohol Dependence 90S (2007) S27-S39 How much for a dime bag? An exploration of youth drug markets Lana D. Harrisona, , Patricia G. Ericksonb,1, Dirk J. Korfc,2, Serge Brochud,3, Annemieke Benschopc,2 a Center for Drug and Alcohol Studies, University of Delaware, 77 E. Main St., Newark, DE 19715, USA b Social, Prevention and Policy Research Department, Centre for Addiction and .

