Transcription
K-12 Online LearningA Survey of U.S. School District AdministratorsHunter College - CUNYAnthony G. Picciano and Jeff Seaman
K–12 ONLINE LEARNING: A SURVEY OF U.S.SCHOOL DISTRICT ADMINISTRATORSAnthony G. PiccianoProfessor, School of Education,Hunter College and Graduate Center of theCity University of New Yorke-mail – anthony.picciano@hunter.cuny.eduJeff Seaman, Ph.D.Chief Information Officer, Survey DirectorThe Sloan ConsortiumOlin and Babson CollegesCo-Director, Babson Survey Research GroupBabson CollegeNeither this report nor any part maybe reproduced or transmitted in any form or by any means, electronicor mechanical, including photocopying, microfilming, and recording, or by any information storage orretrieval system, without prior permission in writing from the publisher.The consent of the Sloan Consortium (Sloan-C) does not extend to copying for general distribution, forpromotion, for creating new works, or for resale. Specific permission must be obtained in writing fromSloan-C for such copying. Direct all inquiries to Sloan-C, at Olin Way, Needham, MA 02492-1200, or topublisher@sloan-c.org.Copyright 2007 by Sloan-C All rights reserved. Published 2007Printed in the United States of America987654321
ABSTRACTThe research literature on online learning has grown significantly in the past decade. Many studies havebeen published that examine the extent, nature, policies, learning outcomes, and other issues associatedwith online instruction. While much of this literature focuses specifically on postsecondary educationwith approximately three million students presently enrolled in fully online courses [1], not as much hasbeen published about students enrolled in fully online and blended courses in primary and secondaryschools. This is one of the first studies to collect data on and to compare fully online and blendedlearning in K-12 schools. The purpose of this study was to explore the nature of online learning in K–12schools and to establish base data for more extensive future studies. Issues related to planning,operational difficulties, and online learning providers were also examined. This study does notnecessarily answer all of the issues raised but hopefully will promote further discussion and study ofthem.KEYWORDSOnline Learning, Distance Learning, Blended Learning, Distance Education, Asynchronous Learning,Primary Education, Secondary Education, K–12I. INTRODUCTIONOn November 9, 2006, the Sloan Consortium issued its fourth annual report on the extent of online learningin American colleges and universities [1]. Based on a national survey, this report provided information onstudent enrollments, operational concerns, and planning issues as seen through the eyes of chief academicofficers. The report confidently estimates that 3 million students are registered for fully online courses incolleges and universities. An online course was defined “as 80 percent of the course is delivered online.”The chief academic officers to whom the survey was sent also reported that online learning was becoming a“critical” part of their long-term planning strategies. This was true especially for those in public collegesand universities where student access to an education is a critical part of their mission.Earlier in 2006, on March 17th, Penn State University hosted the Sloan K–12 Higher EducationCollaboration in Online Learning, a meeting that was held at the Corporation for Public Broadcasting inWashington, DC. Thirty-five individuals were invited to discuss issues related to collaboration in onlinelearning between K–12 schools and colleges and universities. All of the individuals invited had experienceor expertise in online learning and represented a wide spectrum of K–12 schools, colleges and onlinelearning providers. While the discussions during this meeting were rich in possibilities for collaboration, theneed for more data on online learning in K–12 schools became increasingly apparent. While estimates werediscussed, concerns were expressed that hard data were not readily available and that the last major nationalstudy done by the U.S. Department of Education that focused on generic distance education, was based ondata that were four years old.There are a number of underlying reasons why these data are not available. First, there are minimal if anyrequirements in many states to collect data on their online students. A number of states have not establishedany specific guidelines or data collection processes for online students, and those policies that do exist, areinconsistent. Watson, in a study of state policies on online learning in 2005, observed that many “statepolicymakers have moved slowly” [2, p. 10].Second, there is some confusion related to definitions of online learning and distance education. Distanceeducation is not equivalent to online learning. Other instructional modalities not directly related to theInternet, such as videoconferencing and televised courses, are still quite popular in many areas of thecountry. Furthermore, within the online environment, definitions and terms such as “fully online”, “blendedPage 1
courses”, “virtual courses”, “e-learning”, “hybrid courses”, “mixed-mode”, “asynchronous learning”,“distributed learning”, “Web-facilitated”, and “Web-enhanced learning” abound; contributing to confusionamong many educators. Problems of definition are not new especially when dealing with rapidly evolvinginstructional technologies.The Sloan-C study conducted by Allen & Seaman [1] distinguished and defined three types of onlinecourses:Online — Course where most or all of the content is delivered online. Defined as at least 80% ofseat time being replaced by online activity.Blended/Hybrid — Course that blends online and face-to-face delivery. Substantial proportion (30to 79%) of the content is delivered online.Web-Facilitated — Course that uses web-based technology (1 to 29% of the content is deliveredonline) to facilitate what is essentially a face-to-face course [1].These definitions meet the needs of the Sloan Consortium study well, where consistency of terminologyis absolutely essential to ensure the data collected reflect the same activities from year to year.For research and data collection in K–12 schools, similar definitions need to be discussed and established.Without clearly defined terms, activities that can be considered online learning can significantly overlapand might confuse serious study, rather than add to our knowledge. For example, a high school studentenrolled in a fully online Advanced Placement English course at a nearby college and another studentwho does a Webquest as a research assignment in a history course that meets face-to-face might both beengaged in online learning, yet their learning activities are significantly different. Using the definitionsestablished by Allen & Seaman, the former scenario qualifies as a fully online course with student andteacher physically separated and minimally, if ever, meeting face-to-face; the latter would be considered aWeb-enhanced course with student and teacher meeting in a regular classroom, as would any other faceto-face course. Unfortunately, generally accepted definitions have not been established.Third, some of the difficulty in data collection can also be attributed to the significant growth in thenumber of public, private and for-profit providers of online services, many of which operate outside of thetraditional school district structure. These include: Other school districts that provide online learning courses Charter schools within a district Charter schools outside of a district State supported virtual schools within a state State supported virtual schools outside of a state State technology service agencies Colleges and universities Consortial agencies Private, for-profit entities that offer selected courses Private, for-profit virtual schoolsWhile the growth in online learning providers is indicative of the popularity of online learning, itcomplicates the collection of accurate data by moving students partially or fully outside the school districtfor educational services. It also allows online learning providers to operate across state lines. In somecases, where the school district pays for the services, it is acutely aware of which students are enrolled. Inother cases, school districts have little if any knowledge of the number of students taking advantage ofonline learning from an outside provider. During a follow-up telephone discussion to the present study withone high school principal, he indicated that his school district administration has no mechanism in place forcollecting data on online students.Page 2
Fourth, the home schooling movement is alive, well and growing and operates almost as a “subculture” withminimum oversight other than meeting compulsory attendance regulations. [4] Many home schoolers useonline service providers for a portion of their course work without any need to report same to anyeducational agency or authority. The data on this population of online students is perhaps the least knownof any K–12 population.The purpose of this study was to explore the nature of online learning in K–12 schools and to establish basedata for more extensive future studies. Issues related to planning, operational difficulties, and onlinelearning providers were examined. This study will not necessarily resolve all of the issues raised but willhopefully promote further discussion of them.II. REVIEW OF THE LITERATUREBerge and Clark provide an appropriate starting point for examining issues related to online learning in K–12 schools [5]. Their book, Virtual Schools: Planning for Success, contains a number of important chaptersidentifying case studies, best practices, and important planning issues related to K–12 online learning.However, on page one, the authors referred to a study done in 2001 by one of the authors [6] that estimatedK–12 online learning at 40,000 to 50,000 students. In all likelihood, by 2005 when the Berge and Clarkbook was published, this enrollment estimate was too low but exemplified the paucity of research and theneed for more accurate and timely data. The authors recommended that a national survey be conducted ofK–12 schools. The authors also referred to a pending report by the U.S. Department of Education that mightshed more light on K–12 online learning.Watson, in a national study of state policies on K–12 online learning conducted in 2005 reported that anumber of states had not formally established policies on online learning. Furthermore, while there hadbeen explosive growth in online learning, “relatively little was known about the [K–12] programs thatconducted online learning.” [2, p. 10].In 2005, the U.S. Department of Education [7] issued the first comprehensive examination of distanceeducation in the K–12 schools, entitled Distance Education Courses for Public Elementary and SecondarySchool Students: 2002–03. This report, referred to by Berge and Clark above, was based on data collectedduring the 2002–2003 academic year and reported that one-third (36%) of public school districts and ninepercent of public schools had students enrolled in distance education courses in 2002–03. In this study,distance education referred to courses taken for credit and offered to elementary and secondary schoolstudents where the teacher and student are in different locations. It included any technology or modality fordelivering distance education to K–12 schools and did not concentrate exclusively on online learning.Questionnaires for the survey on which the report was based were mailed to a representative sample of2,305 public school districts in the 50 states and the District of Columbia. The findings in the report wereorganized under: distance education for public school students; technologies used for delivering distanceeducation courses; entities delivering distance education courses; reasons for having distance educationcourses; and future expansion of distance education courses. Key findings from the survey included: A greater proportion of large districts than medium or small districts had students enrolled indistance education courses (50% vs. 32% and 37%, respectively). In addition, a greaterproportion of districts located in rural areas than in suburban or urban areas indicated thatthey had students enrolled in distance education courses (46% compared with 28% and 23%,respectively). The percentage of schools with students enrolled in distance education courses variedsubstantially by the instructional level of the school. Overall, 38 percent of public highschools offered distance education courses, compared with 20 percent of combined orPage 3
ungraded schools, 4 percent of middle or junior high schools, and fewer than 1 percent ofelementary schools.In 2002–03, there were an estimated 328,000 enrollments in distance education coursesamong students regularly enrolled in public school districts. Students enrolled in multiplecourses were counted for each course taken. Thus, enrollments may include duplicatedcounts of students.Of the total enrollments in distance education courses, 68 percent were in high schools, 29percent were in combined or ungraded schools, 2 percent were in middle or junior highschools, and 1 percent were in elementary schools.There were an estimated 45,300 enrollments in Advanced Placement or college-level coursesoffered through distance education in 2002–03. This represents 14 percent of the totalenrollments in distance education.The proportion of all distance education enrollments that are in Advanced Placement orcollege-level distance education courses is greater in small districts compared to medium orlarge districts (24% vs. 10% and 7%, respectively).When asked which technology was used to deliver the greatest number of distance educationcourses, 49 percent of districts reported two-way interactive video, more than any othertechnology.Of those districts with students enrolled in distance education courses in 2002–03, about half(48%) had students enrolled in distance education courses delivered by a postsecondaryinstitution. Thirty-four percent of districts had students enrolled in distance educationcourses delivered by another local school district, or schools in other districts, within theirstate.Seventy-two percent of districts with students enrolled in distance education courses plannedto expand their distance education courses in the future.Thirty-six percent of districts that were planning to expand their distance education coursesselected course development and/or purchasing costs as a major factor preventing theirexpansion [7].Approximately 50 percent of the total distance education course enrollments of 328,000 or 164,000 wereInternet-based or online. However, because students might be taking courses in multiple or mixedmodalities, the actual estimates cannot be considered exact. Also because the data collected were based oncourse enrollments and not on students enrolled, it is likely that the number of students enrolled in K–12online courses was substantially lower. The rationale is that a student who takes a full academic programonline might be enrolled in multiple and as many as six courses in a semester. While accurate as a courseenrollment estimate, these data are not equivalent to the number of students enrolled in online learning.Based in part on the U.S. Department of Education data reported above as well as several other studies,Smith, Clark, and Blomeyer projected that K–12 online enrollments would be as high as 600,000 students in2005 [8]. They indicated that this number was an estimate based on other studies and not on primary datathat they had collected. Compared to the 164,000 online course enrollments reported by the U.S.Department of Education for 2002–2003 [7], this estimate seems high but it is not necessarily inaccurate.Another report in Education Week in 2006 estimated the number of online enrollments at more than onemillion students based on reports from The Peak Group and WestEd [9]. This estimate also seems high ascompared to the U.S. Department of Education data for 2002–2003. Smith, Clark, & Blomeyer aptlyconcluded that there were significant barriers to research on K–12 online learning, the first of which waslimited access to accurate and timely data [8].Page 4
While student outcomes are not the specific foci of this study, one major study by Cavanaugh, Gillan,Kromey, Hess, & Blomeyer [10] is worth mentioning. They completed a meta-analysis of fourteen studiesfocusing specifically on student outcomes. Their conclusion was:Students can experience similar levels of academic success while learning usingtelecommunications and learning in classroom settings. While distance learning as itis practiced in today’s virtual schools uses technology that is less than ten years oldand advances rapidly, the literature has shown that a student’s education online can beas effective as it is in a classroom, The result shows variation in the degree of success students have experienced, and aneed for more information if firm conclusions are to be drawn. [10, p. 21–22].The findings in Cavanaugh et al. were similar to other studies conducted on online learning in both K–12and higher education in which “no significant difference” was found in student learning in online coursesversus face-to-face courses. It would appear that a body of research is developing on student performancein individual, case study online courses while research on broader issues of the nature of online learningin the larger K–12 universe is less available.As a conclusion to this review of the literature, the present researchers believe that a study that looks atissues across a broad spectrum of K–12 education will be useful in understanding how online learning isbeing deployed and more importantly perceived by chief school administrators as a viable option fordelivering instruction.III. METHODOLOGYThis study of K–12 instruction used descriptive analysis relying extensively on a survey instrument (seeAppendix A) designed specifically for the project. The instrument was patterned after a similarinstrument used by The Sloan Consortium to conduct national surveys of chief academic officers inAmerican colleges and universities. Follow up telephone discussions were also conducted with selectedrespondents in an attempt to verify and gain further insights into what was reported on the survey. Thissurvey was conducted for the 2005–2006 academic year.The “universe of interest” for this study included all public school districts in the United States thatoperate schools (16,098). Information on these districts was taken from the Common Core of Data(CCD) from the U.S. Department of Education's National Center for Education Statistics(http://nces.ed.gov/ccd/ccddata.asp).The study used three outreach efforts:1. A postcard invitation to participate in the survey was sent to a random sample of7,700 school districts using the postal mailing addresses in the federal data. Eachpost card contained a brief description of the survey, a URL where they the surveycould be completed and a unique Survey ID number for the respondent to use toactivate their survey form.2. An email invitation was sent to randomly selected school districts using acommercial source for email addresses. The commercial source was able to provideemail addresses for approximately one-half of all the school districts. A reminderemail message was sent two weeks after the first message. Both the invitation andPage 5
the reminder message contained a unique URL that, when clicked, would open up thesurvey form in a web browser and pass the unique survey ID.3. Approximately 1,200 randomly-selected school districts were sent a paper copy of aletter of invitation along with a paper copy of the survey form and a business replyenvelope. These respondents were also presented with a web-based option torespond. Both the paper and web-based version of the survey contained a uniquesurvey identification number.All potential respondents were informed of the funding source for the study (the Alfred P. SloanFoundation), who was conducting it (“researchers at Hunter and Babson Colleges”) and that “Allresponses will be held in strictest confidence and at no time will districts or respondents be identified byname.” The survey form was composed of two portions, one that applied to all respondents and a secondsection to be completed only by those districts with online or blended course offerings. The invitationletter and the survey form itself were carefully worded to encourage responses from all school districtrepresentatives, regardless of whether they were involved with online learning or not.All data collected were entered into an online database, either directly by the respondent or, in the case ofpaper-based responses, by the researchers. Each entry included the unique survey ID number that wasused to link the response to the description data of that school district contained in the Education'sNational Center for Education Statistics Common Core of Data. The data linked from this sourceincluded location information (city, town, state, urban/rural), the grade range in the district, the number ofstudents in the district, and the number of teachers in the district.All data were investigated for missing or out of range values. All missing data were coded as eitherstructural missing (the question did not apply to the respondent) or as non-response missing (the questiondid apply, but the respondent did not provide any data). After the survey data were merged with the CCDdata, cleaned, and all missing value codes added, they were input into the SPSS statistical package foranalysis.The analysis data set contains 366 records (N 366), representing 2 percent of all school districts ofinterest. Responses were received from school districts in forty-four states.The major research questions that guided this study were:1. What is the nature and extent of online and blended learning in K–12 schools in theUnited States?2. What is the perceived importance of online and blended learning for K–12 schoolprograms?3. What are the issues and barriers that impede the development of online and blendedlearning in K–12 schools?4. Who are the major providers of online and blended learning courses to K–12schools?In conducting this survey, it was determined that there needed to be a separation of online from blendedlearning courses. In the absence of any standard definitions for online and blended learning, thedefinitions used by Allen & Seaman for the Sloan Consortium studies of American higher education wereadopted, namely:Page 6
Online — courses where most or all of the content is delivered online. Defined as at least80% of seat time being replaced by online activity.Blended/Hybrid — courses that blends online and face-to-face delivery where asubstantial proportion (30 to 79%) of the content is delivered online.The separation of online and blended courses is important and distinguishes this study from the researchpreviously cited that focused specifically on generic distance education or fully online learning.IV. FINDINGSA. Respondent CharacteristicsThe population that participated in this survey represents a cross section of American K–12 education.Three hundred and sixty-six (N 366) out of a total universe of 16,000 school districts in the United Statesresponded to this survey. The school districts responding represent approximately 3,632 schools, 2 millionstudents, and 67,000 FTE teachers from every region (New England, Middle Atlantic, Southeast, Midwest,North Central, Southwest, Mountain, and West Coast) of the country. The locale of these school districts ispresented in Table 1. Definitions of these locales are based on the U.S. Department of Education NationalCenter of Education Statistics (NCES) codes (see Appendix B for definitions).FrequencyLarge CityPercent51.4Mid-Size City184.9Urban Fringe of a Large City7721.0Urban Fringe of a Mid-Size City5615.3Large Town3.8Small Town4211.510428.46116.7366100.0Rural, outside CBSARural, inside CBSATotalTable 1. Locales of Respondents (NCES code used for locale;CBSA Core-Based Statistical Area)B. Nature and Extent of Online and Blended LearningTable 2A shows that 57.9 percent of the school districts reporting had at least one student who had taken anonline course in 2005–2006. It also shows that an additional 24.5 percent of those which did not have anystudents enrolled in an online class planned to have at least one student take an online course within the nextthree years. Table 2B indicates that 32.4 percent of the school districts reporting had at least one studenttake a blended course. It also indicates that an additional 27.1 percent of those which did not have anystudents enrolled in a blended course planned to have at least one student take a blended course within thenext three years. Nearly two thirds of all districts (63.1%) currently have students taking either online orblended courses with another 20.7 percent planning to introduce them over the next three years. These dataclearly reflect that the majority of American school districts are providing some form of online learning fortheir students and many more plan to do so within the next three years.Page 7
otal363100.0Missing3Total366Table 2A. Responses to: Are students at the [school district name] taking any fully online coursesduring the 2005–2006 (12 month) school 632.4Total358100.0Missing8Total366Table 2B. Responses to: Are students at the [school district name] taking any blended/hybrid coursesduring the 2005–2006 (12 month) school year?As a follow-up question to the above, respondents in school districts already enrolling students in online orblended courses were asked if they anticipated growth in enrollments over the next two years. A majority ofthe respondents anticipated growth (60.1% of districts expect growth in their fully online course enrollmentsand 66.0% expect growth in their blended enrollments). Districts predict that the number of students takingonline courses will grow by 18.6 percent and those taking blended courses will grow by 22.9 percent overthe next two years.Table 3 shows the grade levels of the students taking online courses as categorized by fully online andblended/hybrid courses. Not surprisingly, the data show that much higher percentages of students areenrolled in online courses in the upper levels with the majority at the high school level.Fully OnlineGrades rades 6–8179310%398036%577320%Grades tal17349100%11093100%28442100%Table 3. Online Enrollment by Grade LevelAn important goal of this study was to estimate the number of K–12 students enrolled in online learning andPage 8
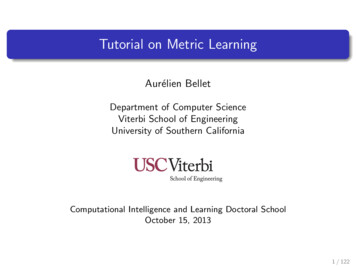
to help establish baseline data through comparisons with other research. The respondents in this studyreported that the total number of students enrolled in fully online courses was 17,349 and the total numberof students enrolled in blended courses was 11,093 for a grand total of 28,442 students. An extrapolation ofthese figures estimates that approximately 700,000 students for the entire population of 48,000,000 publicschool students were enrolled in online and blended learning courses. This figure is close to the projected600,000 students enrolled in online courses for 2005 made by Smith, Clark, and Blomeyer [8]. Based on thedata collected in this study for 2005–2006 and the Smith, Clark, and Blomeyer study for 2005, an estimated600,000 to 700,000 K–12 public school students were enrolled in online learning for 2005–2006. It is likelythat the higher figure is more accurate given that the data in this study is more current and extends into2006, a year longer than Smith, Clark, and Blomeyer. A caution needs to be mentioned regarding thisestimate. This estimate is based on data collected from public schools only. Approximately six millionprivate school students and one million home-schooled students were not included in the sample. Thiswould indicate that the number may be higher but determining to what extant is beyond the scope of thisstudy.C. Perceived Importance of Online and Blended LearningThe answers to question number 3 provide insight into the main reasons why online and blended courses areperceived as important by the respondents. For purposes of presentation, the seven-point Likert scale usedto provide options in the survey was recoded into a three point scale with 1 Not Important, 2 Neutral,and 3 Important. The mean responses are provided in Table 4. These results indicate that the perceivedimportance of online learning related mostly to the following:1. Offering courses not otherwise available at the school2. Meeting the needs of specific groups of students3. Offering Advanced Placement or college-level courses4. Reducing scheduling conflicts for students5. Permitting students who failed a course to take it againNot ImportantNeutralImportantOffering courses not otherwise available at the schoolMeeting the needs of specific groups of studentsOffering Advanced Placement or college-level coursesReducing scheduling conflicts for studentsPermitting students who failed a course to take it again.Certified teachers are not available for traditional face-to-face instructionAddressing growing populations and limited spaceOnline and blended offerings are financially beneficialOnline and blended offerings are pedagogically more beneficialStudents prefer online course activities0102030405060708090100Table 4. Percentage Summary of Responses to: How important do you believe the following reasons are for a schooldistrict to offer fully online or blended learning courses?Page 9
The respondents were predominantly neut
City University of New York e-mail - anthony.picciano@hunter.cuny.edu Jeff Seaman, Ph.D. Chief Information Officer, Survey Director The Sloan Consortium . promotion, for creating new works, or for resale. Specific permission must be obtained in writing from Sloan-C for such copying. Direct all inquiries to Sloan-C, at Olin Way, Needham, MA .