Transcription
Moving forward togetherScorecards II14th January 2021
ContentsPageContent3Understanding performance in essential service sectors4Working together6The impact of Covid-197Performance across our sectors10Cross sector metrics – UKCSI11Performance scorecard – Energy17Performance scorecard – Telecoms21Performance scorecard – Water & Sewerage27Performance scorecard – Banking & Building Societies2
Understanding performance in essentialservice sectorsUnderstanding and monitoring the performance of the sectors we regulate is an importanttool for improving consumer outcomes.This document provides insight into how effectively companies in water, energy, telecoms and essential financial services aredelivering for their consumers. Working with Ofgem, Ofcom, Ofwat, CCW and the FCA, the UK Regulators Network (UKRN)have brought together key consumer metrics covering service quality, price differentials and satisfaction levels. In January2020, we published the first iteration of the performance scorecards Moving forward togetherThese metrics draw on the extensive research and data collected within each of these sectors, providing a high level view aswell as a signposting users to those more detailed metrics. More information from each of the regulators and CCW on themetrics that they collect in their sector can be found by clicking on their logos below.We intend that these performance scorecards will: Help regulators and regulated companies determine where to focus action; Increase the incentives for suppliers to improve performance Provide regulators and policymakers with indicators that will help identify and address any common challenges acrosssectors3
Working togetherCollaboration has remained at the heart of this project, with regulators and UKRN workingtogether to build a picture of the consumer experience across the sectors they regulate.Collaboration has continued to play an important role in understanding the performance of and consumer experience in oursectors.Consumer Minister, Paul Scully, said “I am very grateful to the UK Regulators Network and the regulators for compiling thissecond edition of performance scorecards.Using performance scorecards, consumers can find out which providers are likely to give them the services they need. Thisenables companies to compete on aspects of service that really matter to their customers.I will continue to work with the UK Regulators Network to support them in this work, and I will encourage the furtherdevelopment of making this information available to consumers. I look forward to this and future editions being a valuableaid to consumer decision-making, and to driving healthy competition.”Rachel Fletcher, CEO of UKRN, said “Understanding the experience of consumers across our sectors, especially during thismost challenging of years, remains an important aspect of improving consumer outcomes. I am very pleased at the way inwhich our members have continued to work together, building on their extensive sectoral knowledge to create this sharedinsight. To be able to share this cross sector information, in one place, for the second year, is testimony to the regulatorsefforts in recognising the important role they can play. I hope this project is helpful to consumer groups and other interestedparties in recognising where consumer needs can be best served.”4
Philippa Pickford, Director of Retail at Ofgem, said “During COVID-19 we have worked closely with otherregulators via the UKRN to share knowledge on the impacts on consumers in different sectors and the actionswe took to address Covid-19 challenges. We will continue this knowledge sharing and take joint action where thisis possible and there are clear consumer benefits. We continue to work closely with other regulators throughthe UKRN to further improve collaboration.”Lindsey Fussell, Networks and Communications Group Director from Ofcom, said “Ensuring people have access to clearinformation about the price and quality of communications services is really important. These scorecards help people toeasily compare how different providers perform, so they can choose the right service for them.”John Russell, Senior Director of Strategy and Planning from Ofwat, said “Having access to up to date information on theperformance of regulated companies can help customers and stakeholders build their understanding of our sectors. Havingupdated the scorecards with the latest available data, I hope they will provide an accessible summary of the wide variety ofperformance information held across our sectors.”Emma Clancy, Chief Executive of CCW, said “The scorecards continue to provide an invaluable snapshot of the experiences ofconsumers across multiple utilities and where we need to focus our efforts in improving services for households. Itunderlines the enormous value of regulators and consumer bodies like CCW working together, particularly as we face downthe immediate and long-term challenges presented by COVID-19.”Sheldon Mills, Executive Director, Consumers and Competition from the FCA, said “I am pleased the FCA continues towork closely with the other UKRN regulators and has contributed to this update to the scorecards. The data presented herewill help consumers to make informed decisions when choosing a service provider. It should also provide an incentive forfirms to compete, and improve their offering to deliver the best possible outcome for their customers.”5
The impact of COVID-19Since the first UKRN performance scorecards were published in January 2020, the COVID-19pandemic has had a huge impact on the way that households and individuals consume the serviceswe regulate. It has also changed the way many regulated companies have delivered their services.Here we set out the extent to which these developments may have impacted the data in our scorecards, for each of our sectors:The information in the scorecard was collected in Q3 2020 and Q4 2020, between the COVID-19 lockdowns.Compared to the same time in 2019, the total volume of complaints received by suppliers decreased. Nationallyoverall satisfaction scores are consistent year on year while net promoter score has improved.Ofcom’s scorecard includes metrics (satisfaction, NPS and value for money*) that are based on fieldwork that tookplace from 2 January to 11 February 2020, prior to the Covid-19 pandemic. Face to face interviews were carriedout and followed up with a selection of online interviews. See here for detailed methodology.*Value for money is only reported for mobile providers.In water, fieldwork was completed between 2 September 2019 and 30 March 2020, before the effects of theCOVID-19 lockdown would have been fully felt by households and therefore reflects ‘business as usual’ views.Complaints data was recorded between April 2019 and March 2020, also before the effects of the COVID-19lockdown would have been fully felt by customers.FCA complaints data covers the first half (H1) of 2020 (1 January to 30 June 2020). Given the impact of coronavirus(COVID-19), FCA allowed firms flexibility in the submission deadlines of this data.6
Performance across our sectorsWithin the performance scorecards we have included a range of metrics we believe willbe of interest and that will help to identify where consumers are being well-served andwhere performance need to improve.We have summarised some of the key takeaways here around satisfaction, service quality, value for money and complaints.However, it is important to note that the metrics all use different methodology and cannot therefore be directly comparedacross sectors. These slides also include other metrics that may help stakeholders, including net promoter score (NPS) andprice differentials in the energy sector.Satisfaction/service qualityThe level of customer satisfaction is generally high, there are gaps in all sectors between the stronger performers and thosein need of further improvement. For example, customer satisfaction levels in telecoms vary from 97% for the topperforming provider in the mobile sector, to a 77% satisfaction level for the lowest performer, a landline provider. In energy,customer satisfaction levels with suppliers range between 75-80%, with an average score of 76%.When looking at Overall Service Quality in water and sewerage, an average of 44% of customers say they would be verylikely to recommend their supplier (represented by a score of 9 or 10 on a 1-10 scale). When we look at the top performingcompany in this sector this increases to 71% of customers.7
For personal current accounts, survey results published in August 2020 show that that the proportion ofcustomers who are either very or extremely likely to recommend their personal current account provider tofriends and family varies considerably, from 86% for the highest performing provider to 44% for the lowest.In Online and Mobile Banking, it is 89% for the highest performing provider and 59% for the lowest.Net Promoter ScoreWe have also included the NPS in the water, energy and telecom sectors. NPS is calculated as the proportion of consumerswho are promoters of their supplier/provider minus those who are detractors. Consumers are asked: On a scale of 0 to 10,how likely are you to recommended your supplier/provider to a friend, family member or colleague? Responses are groupedas follows: Promoters (score 9-10); Passives (score 7-8); Detractors (score 0-6). The score can range from a low of-100 (if every customer is a Detractor) to a high of 100 (if every customer is a Promoter). Based on the global NPS standards,any score above 0 is considered “good”, a score of 50 and above is considered “excellent”.In water 16 of the 21 companies (76%) received a positive NPS, with scores ranging from an NPS of -9 to 62 (16 average NPS).In energy the average NPS is 4, meaning there are more brand advocates than detractors. Medium suppliers achieved thehighest score (11), followed by small suppliers (6) and large suppliers (3). In telecoms, of the suppliers listed the range in NPSis -5 to 52. The supplier with an NPS of 62 in water is the highest NPS seen across the 3 sectors.SectorAverage ineTelecomsBroadbandTelecoms121225Mobile8
Value for moneyThe scorecards also capture some metrics on perceptions of value for money. These include perceptions of thevalue for money among mobile customers, where between 84% and 97% of customers are satisfied with thevalue for money they receive from their supplier. For water, the range is between 65% and 85% of customers whobelieve they get good value for money, and for sewerage it is between 66% and 84%.ComplaintsComplaints are not comparable across sectors because of the different ways complaints processes are structured andinformation is collected and reported to the regulators.In energy, the complaints are reported by suppliers for large and medium size (per 100,000 accounts) and smaller suppliers (per10,000 accounts). The number of complaints varies between 2.297% to 0.147% for large and medium suppliers to 2.29% to0.06% for the smaller suppliers.In water, written complaints are reported per 10,000 properties and the average percentage of complaints is less than 1%(0.22%) across the 21 water companies in the scorecard, with the highest figure being 0.58%.In telecoms, people typically raise their complaint with their provider in the first instance, and to an Alternative DisputeResolution (ADR) scheme if these aren’t resolved. Some consumers choose to complain to Ofcom and Ofcom report on thesecomplaints. To compare the performance of providers all complaint volumes are displayed per 100,000 customers. The figuresacross mobile, landline and broadband are also all below 1%, with the highest figure being 0.115%.In banking, firms report to the regulator complaints opened per 1000 accounts. In the latest figures reported, the highestcomplaints recorded the total was 1.3%.9
Cross-sector metrics - UKCSIIn addition to the detailed metrics from each individual sector, we have also included thesector scores from the UKCSI survey published by The Institute of Customer Service.UKCSI is a national benchmark of customer satisfaction, published twice a year. The sector scores provide a high level view ofhow each sector performs based on five dimensions: experiences with the organisations; complaint handling; and perceptionsof an organisation’s customer ethos, emotional connection and ethical behaviour.UKCSI scores are expressed as an index score out of 100. UKCSI covers 13 sectors and is based on 45,000 responses. 259 namedorganisations received a UKCSI rating in the July 2020 survey. Each UKCSI incorporates two sets of data to create a rollingmeasure of customer satisfaction. The July 2020 UKCSI includes responses from surveys conducted between 10 September to 7October 2019 and 16 March to 13 April 2020. Further information about The Institute of Customer Service can be found onalConnection76.279.180.56278.278.277.1Telecoms & 9.569.2Water7475.259.873.273.272.1UKCSI scoreExperienceUKCSI (13 sectors) average77Banks & Building SocietiesSectorEthics75.210
Performance scorecardEnergyv11
Changes in the retail energy market in 2020Change in definitionsIn Q3 2020 Ofgem revised its definition of small, medium and large energy suppliers. Definitions are now based on marketshare rather than historic footprint . The category ‘large’ refers to those suppliers whose market share exceeds 5% in at leastone fuel, ‘medium’ is for those exceeding 1% in at least one fuel, but remaining below 5% in both fuels and ‘small’ forsuppliers with market share below 1% in both fuels.Consolidation of suppliersIn 2020 the number of energy suppliers operating in the energy market in Great Britain fell due to market exits and brandacquisitions. This means that the brand list in the current scorecard is different from that shown in the previous one.Default tariff price capThe level of the default tariff price gap in October 2020 is lower compared to this time a year ago.v12
Customer satisfaction andlikelihood to recommend1. % Satisfied with their supplier overall is the proportion of domestic energy consumers who are satisfied or very satisfied with their energy supplier overall. This data comes from the quarterly‘Consumer Perceptions of the Energy Market Survey’ commissioned by Ofgem in conjunction with Citizens Advice. Data was collected in Q3 2020.2. Net Promoter Score is calculated as the proportion of domestic energy consumers who are promoters of their energy supplier minus those who are detractors. Consumers are asked: On a scale of 0 to10, how likely are you to recommended your energy company to a friend of colleague? Responses are grouped as follows: Promoters (score 9-10); Passives (score 7-8); Detractors (score 0-6). Datacomes from the quarterly ‘Consumer Perceptions of the Energy Market Survey, commissioned by Ofgem in conjunction with Citizens Advice. Data was collected in Q4 2020.How are suppliers grouped?As at June 2020, 56 licensed domestic suppliers were active in the retail energy market. Ofgem groups them as follows: Large suppliers: Bulb, British Gas, E.ON, EDF Energy, npower, Octopus. Scottish Power, SSE/ Ovo Medium suppliers: Avro Energy, Green Network Energy, Shell Energy, Utility Warehouse, Utilita Small suppliers: all other suppliersAs of Q2 2020 the large suppliers together accounted for around 83% of the market, the medium suppliers together accounted for 10% of the market and small suppliers accounted for 7% of the electricitymarket. You can access supplier market share data on the Ofgem data portalv13
Energy prices September 2020For a typical dual fuel customer paying by direct debit.The relevant default tariff cap during this period was 1127. Visit Ofgem’s website to learn more about the default tariff price cap.The cheapest in market was 790Large andmediumsuppliers3. A Standard Variable Tariff (SVT) is a supply contract with an indefinite length that does not have a fixed-term applying to the terms and conditions. It’s an energy supplier’s basic offer. If a customer does notchoose a specific energy plan, for example after their fixed tariff ends, they are moved to an SVT until they choose a new one. A customer can also make an active choice to select an SVT.Tariffs are calculated for a typical dual fuel customer paying by direct debit. This is a customer who takes gas and electricity from the same supplier and consumes 12,000kWh/year for gas and 2,900kWh/year forelectricity.4. Ofgem uses weekly prices across the relevant quarter to calculate the average SVT price and the average cheapest tariff price for each supplier, as well as the average market cheapest tariff price. When calculatingthe cheapest tariff at both individual supplier and market level, Ofgem excludes tariffs restricted to certain regions. This is to give a representative picture of tariffs generally available to all customers across GreatBritain. When calculating the cheapest tariff at individual supplier level, tariffs only available to existing customers (also known as ‘retention' tariffs) are included. Tariffs only available to new customers (also known as‘acquisition’ tariffs) are excluded.This information is available and regularly updated on Ofgem's data portal.v14
Customer complaints Q3 2020Large andmediumsuppliersComplaints data refers to complaints directly received by suppliers. This information is available and regularly updated on Ofgem's data portal.v15
Customer complaints Q3 2020Selectionof smallsuppliersEnergy providerNumber of complaints received per10K gas and electricity accountsEnergy providerNumber of complaints received per10K gas and electricity accountsEnergy providerNumber of complaints received per10K gas and electricity accountsEnergy providerNumber of complaints received per10K gas and electricity accountsAffect EnergyBristol EnergyDaligasEESB EnergyEcotricityEntice Energy6516327873111433EnstrogaEnergyFoxgloveGood EnergyGreen.Green EnergyUKGoTo EnergyGulf Gas &Power15417971261940Igloo EnergyNabuh EnergyOrbit EnergyPFPPure PlanetSimplicityEnergySo Energy3037322937802430Social EnergyTogetherEnergyUtility PointYorkshireEnergyZog EnergyZebra Power18419529112117* Note as many small suppliers have fewer than 100,000 (one hundred thousand) customers, complaints data is reported as number of complaints per 10,000 (ten thousand) customers.Complaints data refers to complaints directly received by suppliers. This information is available and regularly updated on Ofgem's data portal.v16
Performance scorecardTelecomsvv17
Mobile 93%90%significantly higher or lower thanprevious year at the 99% confidencelevel for market research results25N/A1752N/A30N/A44102627X%Complaints to Ofcomper 100k subscribers213217N/A109113152726significantly higher or lower than theoverall sector average at the 95%confidence level for market researchresultsSatisfaction with valuefor ntly higher or lower than theoverall sector average at the 95%confidence level for market researchresultsSatisfaction1NPS11. Source: Ofcom Customer Satisfaction Tracker 20202. Source: Ofcom CCT data. Notes: All figures are rounded to the nearest whole number; the overall average relates only to the providers included in the analysis. Annualised for 2019. Visit Ofcom’s website to seethe latest quarterly telecoms complaints data.3. Source: Ofcom Customer Satisfaction Tracker 2020 . Notes: the industry average relates only to the providers included in the analysis. Satisfaction with value for money data only asked among those with astandalone service, so does not include those who purchase their mobile service as part of a bundle. No data for satisfaction with value for money for BT and Virgin Mobile due to insufficient base size.vv18
Broadband N/ANPS1121217N/A15N/A9-519N/AComplaints to Ofcomper 100k gnificantly higher or lower thanprevious year at the 99% confidencelevel for market research resultsLandline providersSatisfaction1NPS1Complaints to Ofcomper 100k A27N/A1095N/A383117N/A783418694965X%significantly higher or lower than theoverall sector average at the 95%confidence level for market researchresultsX%significantly higher or lower than theoverall sector average at the 95%confidence level for market researchresults1.Source: Ofcom Customer Satisfaction Tracker 2020. Note: the overall average relates only to the providers included in the analysis (inclusion criteria: providers with a 4% more market share). No data for KCOM orPost Office due to not meeting the inclusion criteria for this study.2. Source: Ofcom CCT data. Notes: All figures are rounded to the nearest whole number; the overall average relates only to the providers included in the analysis. Annualised for 2019. Visit Ofcom’s website to see thelatest quarterly telecoms complaints data. Note: Satisfaction with value for money data is not available for landline and broadband because the question was only asked among those with a standalone service.vv19
Monitoring headline customer outcomesNotes: Based on September 2019 pricing information. Ofcom monitors and reports separately on the extent to which broadband providers differentiate their prices for different groups of customers. The latest broadbandpricing data we have can be found at:Pricing trends in communication services: 2019 , Helping consumers get better deals: A review of pricing practices in fixed broadband and Affordability of communications services: A summary of initial findings.vv20
Performance scorecardWater and sewagevv21
Likelihood to RecommendCustomers were asked how likely they would be to recommend their water company? (0-10 scale)Percentage who scored their provider with 9 or 10 rating’ shownLatest Results - August 2020AnglianBournemouthBristolCambridgeDwr CymruEssex olNorthumbrianPortsmouthSevern TrentSouth EastSouthStaffordshire44%71%56%50%45%33%48%South WestSouthernSutton & 9%34%25%44%51%50%Water Company Affinity WaterLikelihood to RecommendWater CompanyLikelihood to RecommendWater CompanyLikelihood to Recommendvv22
Satisfaction: Water (W) & Sewerage (S)Customers were asked ‘when thinking about satisfaction with water services and satisfaction with sewerage services,how satisfied or dissatisfied are with your service?’ (0-5 scale) -Percentage who scored their provider with a 4 or 5 rating’ geDwr CymruEssex &SuffolkSatisfaction with Service: Water90%88%94%94%96%94%91%Satisfaction with Service: NorthumbrianPortsmouthSevern TrentSouth EastSouthStaffordshireSatisfaction with Service: Water92%93%93%96%94%86%93%Satisfaction with Service: Sewage89%89%91%80%91%80%90%South WestSouthernSutton &East tion with Service: Water93%89%95%87%93%93%94%Satisfaction with Service: Sewage85%83%82%79%87%93%90%Water CompanyWater CompanyWater Companyvv23
Net Promoter Score (NPS)Respondents are grouped as follows:-Promoters (score 9-10) are loyal enthusiasts. -Passives (score 7-8) aresatisfied but unenthusiastic customers. -Detractors (score 0-6) are unhappy customersLatest Results - August 2020AnglianBournemouthBristolCambridgeDwr CymruEssex humbrianPortsmouthSevern TrentSouth EastSouthStaffordshire37622235-6-124South WestSouthernSutton & 721333323Water Company Affinity WaterNet Promoter ScoreWater CompanyNet Promoter ScoreWater CompanyNet Promoter ScoreThe NPS is calculated by subtracting the % of Detractors from the % of Promotersvv24
Value For Money (VFM): Water (W) & Sewerage (S)Customers were asked ‘when thinking about value for money, how satisfied or dissatisfied are you with the VFM of your service?’(0-5 scale) - Percentage who scored their provider with a 4 or 5 rating’ shownAffinity WaterAnglianBournemouthBristolCambridgeDwr CymruEssex &SuffolkValue For Money: Water77%74%85%80%78%77%76%Value For Money: NorthumbrianPortsmouthSevern TrentSouth EastSouthStaffordshireValue For Money: Water77%82%79%77%78%70%76%Value For Money: Sewage81%84%84%65%80%69%75%South WestSouthernSutton & e For Money: Water65%67%75%75%76%79%79%Value For Money: Sewage66%74%76%75%79%83%80%Water CompanyWater CompanyWater Companyvv25
Complaints – Written, per 10,000 PropertiesLatest Results - September 2020AnglianBournemouthBristolCambridgeDwr CymruEssex artlepoolNorthumbrianPortsmouthSevern TrentSouth uth WestSouthernSutton & .811.358.318.211.817.6Water Company Affinity WaterComplaints – Writtenper 10,000 PropertiesWater CompanyComplaints – Writtenper 10,000 PropertiesWater CompanyComplaints – Writtenper 10,000 Propertiesvv26
Performance scorecardPersonal Current Accountsv27
Current Account Service QualityBased on the 19 largest personal current account providers in Great BritainOverall Service QualityCustomers were asked how likely they would be to recommend their provider to friends and family1.Latest results published in August 2020Bank/BuildingSocietyMonzoStarling BankFirst DirectMetro BankNationwideBarclaysHalifaxOverall cietySantanderLloyds BankVirgin MoneyHSBCNatWestBank ofScotlandOverall tyThe Cooperative BankYorkshire BankTSBClydesdale BankRoyal Bank ofScotlandTesco BankOverall ServiceQuality57%56%51%51%46%44%These results show the proportion of customers of each provider who said they were ‘extremely likely’ or ‘very likely’ to recommend each service1Access to the full Ipsos Mori Banking metrics surveys published every six months is available herev28
Current Account Service QualityBased on the 19 largest personal current account providers in Great BritainOnline and Mobile Banking ServicesCustomers were asked how likely they would be to recommend their provider’s online and mobile banking services to friends andfamily1.Latest results published in August 2020Bank/BuildingSocietyMonzoStarling BankMetro BankFirst DirectNationwideBarclaysHalifaxOverall cietyLloyds BankBank ofScotlandSantanderNatWestVirgin MoneyHSBCOverall tyYorkshire BankRoyal Bank ofScotlandThe Cooperative BankClydesdale BankTSBTesco BankOverall ServiceQuality71%71%67%66%65%59%These results show the proportion of customers of each provider who said they were ‘extremely likely’ or ‘very likely’ to recommend each service1Access to the full Ipsos Mori Banking metrics surveys published every six months is available herev29
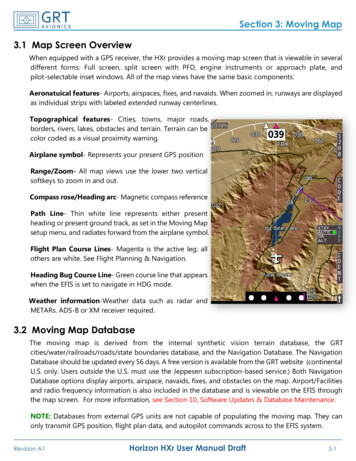
Current Account Service QualityBased on the 10 firms offering personal current accounts with most complaints in H1 2020*Firms offering personal current accounts with most Banking and credit card complaints (per 1,000 accounts) H1 2020*The data we collect includes complaints on credit cards, current accounts, packaged accounts, savings, unregulated loans and overdrafts and otherbanking. For the purpose of accurately displaying data more specific to personal current accounts, firms who do not offer personal current accounts havebeen excluded.1412Complaints1086420Al Rayan Bank PLCCynergy BankLimitedBarclays Bank PlcBank of Ireland(UK) PlcHSBC UK Bank Plc Monzo Bank Ltd Investec Bank PLC Secure Trust Bank Marks & SpencerPlcFinancial ServicesPlcFirmsNumber of complaints on banking and credit cards per 1,000 accountsA link to the latest FCA complaints data published on 15 December 2020 can be found hereThe figures are complaint numbers opened during the period January 1st 2020 - June 30th 2020 (H1)vAverage complaints per 1,000 banking and credit card accounts all firmsTesco PersonalFinance PLC
Moving forward together Scorecards II 14th January 2021. Contents. . enables companies to compete on aspects of service that really matter to their customers. I will continue to work with the UK Regulators Network to support them in this work, and I will encourage the further . aid to consumer decision -making, and to driving healthy .