Transcription
Fast-Moving, Slow-Moving and Non-MovingInventory (FSN technique)Fast-moving, Slow-moving and Non-moving inventory (FSN technique)IntroductionWhat is Fast - Moving, Slow - Moving and Non - Moving Inventory Management TechniqueHow to Identify the FSN Inventory - FSN AnalysisWhy You Should Use FSN Analysis Technique - AdvantagesDisadvantagesConclusion
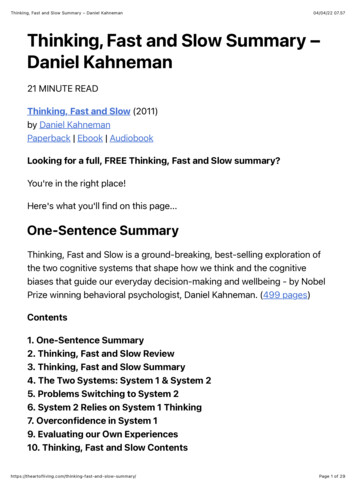
IntroductionBlack Champion U. Miller has explained the term ‘Inventory’ as “expandable physicalarticles held for resale, for use in manufacturing a product or for consumption incarrying on business activity”Industries in the modern world are facing extreme pressure as the trends and likings ofconsumers change even before they are able to predict it. Inventory and warehousemanagers need to respond proactively as the trends change in fact they are needed to bea step ahead of the consumer.Although it is a bitter truth, it’s true that the industry with good demand forecasting andinventory management techniques can any day overtake a company with better qualityproducts but having flawed demand forecasting abilities.Inventory management’s goal is to increase profits and performance of the entire supplychain and order fulfillment process by articulately forecasting demand, reducinginventory carrying cost, managing quality, and increasing the value of the inventory.Moreover, they should ensure that the products inside are the ones that would generateprofits.Online or offline retailers will never invest money in holding an inventory that doesn’tbring in revenues frequently. And therefore, you need to analyze the movements andfunctioning of products through the supply chain and order fulfillment process.In this write-up, I will be discussing one such inventory analysis technique called theFSN technique that helps you identify the fast-moving, slow-moving, and non-movingproducts. So if you want to know how to do, FSN analysis read on-What is Fast - Moving, Slow - Moving and Non Moving Inventory Management TechniqueAlso known as the FSN analysis, Fast moving, the slow-moving and non-movinginventory method is about segregating products based on their consumption rate,quantity, and the rate at which the inventory is used.
Fast-moving inventory, as the name suggests, comprises the stock that moves quicklyand needs to be replenished very often. Generally, the stock that lies in this category hasan inventory turnover ratio of more than 3 and constitutes around 10-15% of the totalinventory.Slow-moving inventory is the inventory that crawls slowly through the supply chain andhas an inventory turnover ratio between 1-3. It is generally 30-35% of the total stock.The inventory that rarely moves with the inventory turnover ratio below 1 and makes60-65% of the total stock is called the Non-moving inventory.
How to Identify the FSN Inventory - FSN AnalysisInventory can be classified based on different parameters like consumption rate,average stay, annual demand percentage, reorder frequency, and how repeatedly theproducts are used or moved from their location.To figure out which product falls under which category you need to calculate theparameters mentioned above, like average stay and consumption rate during a period.The formula for the average stay and consumption rate is -
Average stay cumulative no. of inventory holding days [or unit of time] (totalquantity of items received opening balance)Consumption rate Total issue quantity Total period durationAfter the calculation of the average stay and consumption rate is done, then thecalculation of cumulative average stay and cumulative consumption rate is carried out,followed by deriving the percentages of both. And then, with the help of thesepercentages, we can identify and segregate the products into FS & N.Cumulative average stay average stay of item average stays of all items that staylonger in inventory than itselfCumulative consumption rate consumption rate of item consumption rate of allitems consumed faster than itselfPercentage average stay (cumulative average stay of item cumulative averagestay of all items) x 100Percentage consumption rate (cumulative consumption rate of item cumulativeconsumption rate of all items) x 100According to cumulative average stays - Fast-moving products are 10% or less of the average cumulative stay. Slow-moving stocks are 20% of the average cumulative stay. Non- moving items constitute around 70% of the average cumulative stay.This means that the fast-moving products stay only 10% or less of the average stay of theinventory and hence travels quickly through the supply chain.According to consumption rates the FSN can be categorized as Fast-moving inventory is 70% of the average consumption rate Slow-moving inventory is 20% of the average consumption rate Non-moving inventory is 10% or less of the average consumption rate.
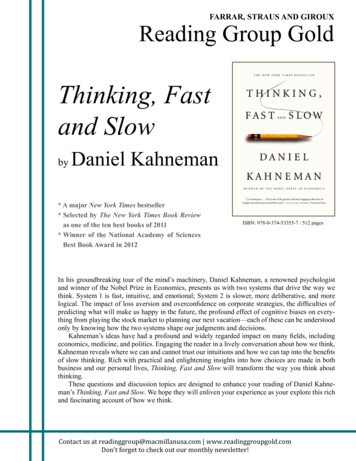
The consumption rate of the F products will always be high because of the apparentreason that they are sold quickly and have a higher inventory turnover ratio.To make sure that FSN analysis is accurate, you need to take both averages stays ininventory and consumption rate of the products into account. This determines the finalFSN status of the stock based on which you make decisions for your inventorymanagement and inventory forecasting.Let’s take an example to understand how the calculation is done.Let’s carry out the analysis for ten materials, and the time duration to be for 10 days.Below is the calculation of the item with SKU01.Opening balance - justment 000 671596Total8565056
Now,The average stay of the material cumulative no. of inventory holding days [or unit oftime] (total quantity of items received opening balance)So, the Average stay of the material is 596/125 4.76 daysWe also have to calculate the consumption rate whichConsumption rate of the material Total issue quantity Total period duration 65/10 6.5 Nos/ dayThe next step would be listing down of all the 10 materials with their average stays andconsumption ratesItem codeAverage StayConsumption 0712.452.5086.765.64099.63.39105.147.86
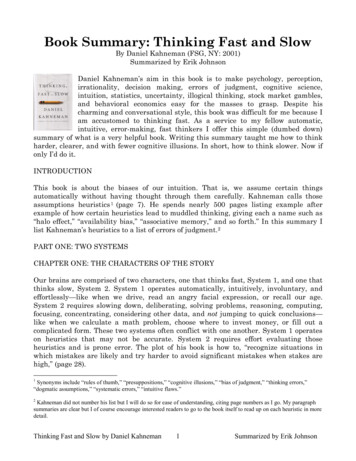
Now classifying the products on the basis of cumulative average stay percentage byarranging them in descending order with the highest number of average stay on the top.F 10% or lessS 20%N 70%Item CodeAverage StayCumulative avg % average 74S014.7670.995.12F043.6374.53100F
*This graph is for demonstration purposes only, generally in average stay ,the F 10%, S 20%, N 70%Similarly, the subsequent step is to classify the inventory concerning the consumptionrate.Item .23F024.236.4378.25F
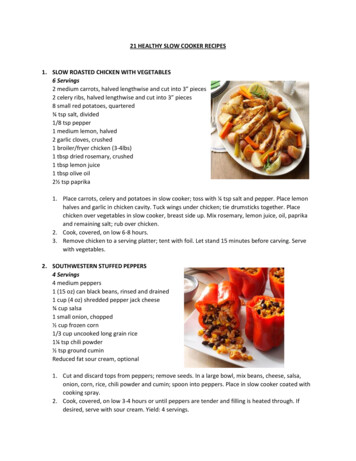
.2346.55100N*This graph is for demonstration purposes only, generally in consumption rate ,the F 70%, S 20%, N 10%The final classification is conducted by combining both of the results of segregationachieved above.Item CodeFSN (consumptionrate)FSN (Average stay)Final FSNclassification01FFF02FSF
03SNS04FFF05FNS06NNN07NNN08FSS09SNN10FSF*This graph is for demonstration purposes only.Why You Should Use FSN Analysis Technique AdvantagesAs you saw in the above example, you can calculate the average time spent by a productin the warehouse and the consumption rate, and this data can help you a lot in
managing your inventory efficiently. Below is the list of reasons explaining theimportance of the FSN technique. An easy way to find dead stock and reduce its accumulation in the inventory An effective way to categorize inventory in a way that the categories in which theproducts are kept say a lot about the behavior of the product in a supply chain The technique also empowers the retailers to decide on the future of the businessof each product, whether to increase the purchase of a particular product or tonot A fantastic technique to find the active products in the inventory and also if youcarry the analysis regularly you can see the trends shifting from one product toanother This information about changing patterns can help you in handling thoseproducts and keeping the inventory updated The products that don’t need to spend money on are easily spotted Getting rid of the non-moving products at the correct time to avoid the inventorycarrying cost, and replace those products with the products that bring in theprofits also becomes uncomplicated as you know the products that aren’t doingwell This also enables you to keep fast-moving products at the location in thewarehouse that is more accessibleDisadvantagesThe major disadvantage of this technique is that it is a calculation that is based onformulas and information provided by you, so the issue is the information, or even asingle human error can flaw the calculations.This can lead to wrong analysis, and you are managing your inventory based on thatfaulty outcome. You could consider a slow-moving product as a fast-moving product andtell your supplier to send more of it. However, then you realize there isn’t much demandfor that product. So, there is a loophole in this technique.Also, sudden changing trends in the inventory are very tough to figure out with thistechnique alone as you have to calculate again and again.To know about FNS analysis through a video watch the below-given youtubevideo
https://www.youtube.com/watch?v tUa4FgeC7u8ConclusionIf you want to segregate the inventory and figure out the demand or movement ofproducts, this is one of the best techniques; however, the companies use a combinationof ABC analysis, FSN analysis, and VED to classify their products depending on theirneeds.I hope you can learn the FNS analysis technique from the above-given information.There are many advantages of this method, like a better understanding of the product’smotion and conduct so that you can forecast your inventory effectively and decreaseinventory carrying costs and increase the bottom line.Properly using this method can take you ahead of your competitors in a whisker.However, don’t forget the disadvantages as a small error can lead to a misunderstandingthat can cost you money and time both. Also, going out of stock can lead to consumersgetting diverted to your competitors.And at last, here’s a tip that I want to give you. Use an inventory management softwarethat can spare you from the efforts of classifying the inventory and keeping track of itmanually. Take a 15 day free trial of an automated inventory management software tosee if you like it or not.“Non moving inventory is like a mole in a business that does nothing yet does a job ofincreasing your inventory carrying cost, decreasing your bottom line and devaluingyour invested money”Essential Resources FID fsn-analysis.html
Slow-moving inventory is the inventory that crawls slowly through the supply chain and has an inventory turnover ratio between 1-3. It is generally 30-35% of the total stock. The inventory that rarely moves with the inventory turnover ratio below 1 and makes 60-65% of the total stock is called the Non-moving inventory.