Transcription
Copyright O 1993 Cambridge University PressB. J . Pol. S. 2 3 , 4 0 9 4 5 1Printed in Great BritainWhy Are American Presidential Election CampaignPolls So Variable When Votes Are So Predictable?ANDREW GELMANANDG A R Y KING*As most political scientists know, the outcome of the American presidential election can bepredicted within a few percentage points (in the popular vote), based on information availablemonths before the election. Thus, the general campaign for president seems irrelevant to theoutcome (except in very close elections), despite all the media coverage of campaign strategy.However, it is also well known that the pre-election opinion polls can vary wildly over thecampaign, and this variation is generally attributed to events in the campaign. How can campaign events affect people's opinions on whom they plan to vote for, and yet not affect theoutcome of the election? For that matter, why do voters consistently increase their rupportfor a candidate during his nominating convention, even though the conventions are almostentirely predictable events whose effects can be rationally forecast?In this exploratory study, we consider several intuitively appealing, but ultimately wrong.resolutions to this puzzle and discuss our current understanding of what causes opinion pollsto fluctuate while reaching a predictable outcome. Our evidence is based on graphical presentation and analysis of over 67,000 individual-level responses from forty-nine commercial pollsduring the 1988 campaign and many other aggregate poll results from the 1952-92campaigns.We show that responses to pollsters during the campaign are not generally informed oreven, in a sense we describe, 'rational'. In contrast, voters decide, based on their enlightenedpreferences, as formed by the information they have learned during the campaign, as wel!as basic political cues such as ideology and party identification, which candidate to supporteventually. We cannot prove this conclusion, but we do show that it is consistent with theaggregate forecasts and individual-level opinion poll responses. Based on the enlightened preferences hypothesis, we conclude that the news media have an important effect on the outcomeof presidential elections - not through misleading advertisements. sound bites, or spin doctors,but rather by conveying candidates' positions on important issues.Something is amiss in the scholarly study of American presidential elections.For some time now, political scientists have forecast the outcome of presidentialelections accurately using only information available before the start of thegeneral election campaign. However, the numerous 'trial heat' public opinionsurveys (polls about whether likely voters plan to cast their ballots for theDemocratic or Republican candidate for president) conducted during thecampaign vary enormously in support for the Democratic and Republican* Gelman, Department of Statistics, University of California, Berkeley; King. Department ofGovernment, Harvard University. We thank Eric Oliver and Maggie Trevor for research assistance,and Larry Bartels, Neal Beck, Tom Belin. M o Fiorina, John Kessel, Mik Laver, Eileen McDonaugh,Phil Paolino, Keith Poole, Doug Price, Phillip Price. Sid Verba and D. Stephen Voss for helpfulcomments, and the National Science Foundation for a research grant. All graphs were madeusing the S system. This is a revised version of a paper which received the Pi Sigma Alpha awardfor the best paper at the annual meeting of the Midwest Political Science Association, Chicago.1992.
candidates. At one point during the 1988 general election campaign, surveyrespondents favoured Dukakis over Bush by 17 percentage points, and yetany reasonable application of the political science literature would have madeGeorge Bush almost certain to win the November election.In addition to being interesting in its own right, the puzzle stated in thetitle of this article is important for three related reasons. First, given our profession's heavy reliance on public opinion surveys for studying presidentialelections and numerous other phenomena, the puzzle represents a large voidin our substantive understanding and possibly also a very serious methodological problem for much existing research outside this area. The existence of thepuzzle means that we cannot rely on answers to at least some survey questions.What political science obviously needs is a very clear broader theory of thesurvey response, so that we can decide which questions contain directly usefulinformation. Although there has been much interesting work on the subject,we certainly have no fully satisfactory theory yet.' This is not a problemwe solve in this article, but any resolution of the more general problem mustalso account for our puzzle.A second reason for studying this subject is its potential contribution towhat political philosophers have called 'the epistemological problem of interests: how we can know what they are.'' Dahl defines 'interests' by appealingto the concept of enlightened understanding: 'A person's interest or good iswhatever that person would choose with fullest attainable understanding ofthe experience resulting from that choice and its most relevant alternatives.'He and others have asked, 'What processes or institutions can best be countedon to protect these interests?' We have no final answer to this question, butthe issues we address and evidence we provide may help to focus the questionmore precisely.Finally, the puzzle has a practical consequence, since mainstream journalistsrespond to it largely by ignoring the lessons of political science and insteadinterpreting each short-term change in the public opinion polls as a seriouschange in the likely fortunes of the candidates. This focus is in part responsiblefor the relatively issue-free, or 'horse race', aspect of presidential campaignmedia coverage, which at its most extreme finds journalists interpreting therace by deconstructing the claims of competing 'spin doctors'. Conversely,' Christopher Achen, 'Mass Political Attitudes and the Survey Response', American PoliticalScience Review, 69 (1975), 1218-23; Stanley Feldman, 'What Do Survey Questions Really Measure?'Political Methodologist, 4 (1991), 8-12; T. Piazza, Paul Sniderman and Phillip Tetlock, 'Analysisof the Dynamics of Political Reasoning: A General-Purpose Computer Assisted Methodology',Political Analysis, 1 (1989), 99-120.' Robert Dahl, Democracy and Its Critics (New Haven, Conn.: Yale University Press, 1989),p. 181.
Why Are Presidental Election Polls So Variable?41 1some political observers, noting the success of forecasters in predicting electionsmonths ahead of time, hold that the general election campaign has no effecton the outcome of the presidential election. Neither of these extreme positionsfully captures the truth; at the end of this article, we return to a discussionof the roie of the media in election campaigns.As far as we know, the arguments and evidence in this paper apply onlyto the general election campaign for the American President (see Section 2.2).Sorting out where it applies, and why, is an important topic for future research.In Section 1, we review the evidence regarding political scientists' forecastsand the variability of poll results. Underlying our ability to forecast is theprofession's distinctive model of voter decision making. Section 2 discussesthis model, as well as the alternative model implicitly followed by most accountsof the election in the news media. We work our way through several plausible,but flawed, explanations for this puzzle in Section 3. We are far from a finalanswer to our puzzle, but we do have one tentative explanation, which is consistent with all our existing evidence. We outline this hypothesis in Section 4and present the evidence for it in Section 5. We conclude in Section 6 witha discussion of the implications for the role of the media in presidential electioncampaigns.Our intended contribution in this article is to raise the question in our titleand provide evidence sufficient to dismiss many apparently reasonable and'obvious' hypotheses (including our own prior beliefs). Because of the largelyexploratory nature of relevant existing theories, we make extensive use of graphical techniques. This enables us to evaluate a series of specific hypotheseswhile still not obscuring features of the data that might suggest novel approachesor new hypotheses.1.FORECASTING EVIDENCE A N D DATA SUMMARIESRosenstone's forecasting model is one of the most developed and successfulof the recent contributions to the literature, and it is the empirical results ofthis model on which we focus.' His model is based on measurable economicand political variables that were discovered and analysed by numerousresearchers over many decades, and not on trial heat polls. Even if one wereto disagree with the particulars of Rosenstone's model, it would be hard toSteven J. Rosenstone, Forecasting Presidential Elections (New Haven, Conn.: Yale UniversityPress, 1983).
412GELMAN A N D KINGdeny that past presidential elections have been forecast fairly accurately usingthese method . 1.1. Political Science Forecasts up to 1988Rosenstone summarizes his considerable success at forecasting presidential elections through 1980. Perhaps even stronger evidence is that his model has continued to forecast very well in the two elections since the publication of hisbook, as recounted by osenstone.'In both 1984 and 1988, Rosenstone's forecasts fell within 1 per cent of the nationwide popular vote and predicted onlya few states incorrectly, an excellent performance, considering that the forecastswere made months before the election. Table 1 summarizes the performanceof Rosenstone's model, along with our forecasts for 1992 (see below), by comparing forecasts made at the start of the general election campaign with thosefrom the national polls, media prognoses and judgements by political strategiststaken at the same time.Rosenstone also presents what he calls 'perfect information forecasts', basedon information theoretically, but not actually, available before the election,such as late changes in real disposable income. (This would be actually availableif the government released this information earlier.) These perfect informationforecasts are generally significant improvements. They are obviously of lessuse for actual forecasting, but they confirm the most important general pointfrom our perspective: the outcomes of recent elections can be predicted withina few percentage points in the popular vote, based on events that have occurredbefore Labor Day (the first Monday in September).Other forecasting models, also based on economic and political variablesmeasured before the start of the campaign, have performed well, and oftenMichael S. Lewis-Beck, 'Election Forecasts in 1984: How Accurate Were They?' PS, 18 (1985),53-62, and Michael S. Lewis-Beck and Tom W. Rice, Forecasting Elections (Washington, DC:Congressional Quarterly Press, 1992) review many other statistical forecasting models. Allan J.Lichtman and Ken DeCell, The Thirteen Keys to the Presidency (Lanham, NY: Madison Books,1990) and Robert Forsythe, Forrest Nelson, George Neumann and Jack Wright, 'The Iowa Presidential Stock Market: A Field Experiment', Research in Experimental Economics, 4 (1991), 1113,present some non-statistical approaches to forecasting presidential elections. Social scientists havebeen explaining and forecasting Individual votes and aggregate election outcomes almost sincethe start of the discipline. The first quantitative article published in a political science journal(about political science) was on voting behaviour (William Ogburn and Inez Goltra, 'How WomenVote: A Study of an Election in Portland, Oregon', Political Science Quarterly, 34 (1919), 413-33),and voting, particularly in presidential elections, has almost always remained a lively area ofresearch.' Steven J. Rosenstone, 'Predicting Elections' (Ann Arbor: University of Michigan, unpublishedmanuscript, 1990). In Forecasting Presidential Elections, p. 122, Rosenstone also reports sendingletters on 14 October 1980 to twenty scholars with his forecasts of the November 1980 election.
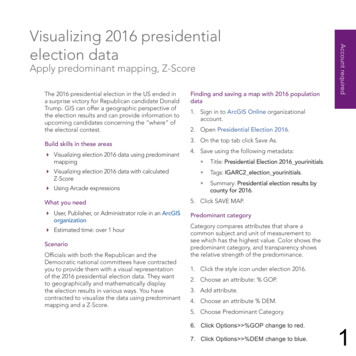
Why Are Presidental Election Polls So Variable?TABLE141 3Presidential Election Forecasting ErrorsForecastsErrors1984National Popular VoteRosenstoneNational polls (average miss)0.3 percent5.3 percentNational Electoral VoteRosenstoneMedia prognoses (average miss)Political strategists (average miss)1988National Popular VoteRosenstoneNational polls (average miss)National Electoral VoteRosenstoneMedia prognoses (average miss)1992National Popular VoteGelman and KingNational polls, early September (average miss)National polls, mid-October (average miss)National Electoral VoteGelman and KingState polls, September48 electoral votes129 electoral votes115 electoral votes0.2 percent2.8 percent82 electoral votes131 electoral votes0.3 percent2.8 percent5.4 percent5.6 electoral votes59 electoral votesNore: All popular vote forecasts are expressed in terms of the Democratic candidate's share ofthe two-party vote. The 1984 forecasts were made in mid-July; the 1988 forecasts were madein early September; the 1992 forecasts were performed in early-October, but only used informationavailable in early September. When the media declared states as 'toss-ups', the electoral voteswere divided evenly between the two major parties and states were counted as half a miss.Sourcefor 1984 and 1988forecasts: Rosenstone. 'Predicting Elections'. Tables 1 and 2.better, in recent years6 By contrast, public opinion polls at this time gaverelatively useless forecasts of the election outcome. The predictions of mediaexperts and political strategists were not much better.?See, for example, Ian Budge and Dennis Farlie, Voting and Parry Comperition (New York:Wiley, 1977); Edward R . Tufte, Political Conrrol ofrhe Economy (Princeton, N J : Princeton University Press, 1978); Ray C. Fair, 'The Effect of Economic Events on Votes for President', Reviewof Economics and Sratistics, 60 (1978), 159-73: and 'The Effect of Economic Events on Votesfor President: 1980 Update'. Review ofEconomics and Srarisrics, 64 (1982), 322-5; and 'The Effectof Economic Events on Votes for President: 1984 Update'. Polirical Behavior, 10 (1988), 168-79;James E. Campbell, 'Forecasting the Presidential Vote in the States', American Journal of PoliricalScience, 36 (1992). 386407; Lewis-Beck and Rice, Forecasring Elecrions.' See Lewis-Beck and Rice, Forecasring Elecrions, chap. 1 .
1.2.Our Forecastfor 1992In updating our paper to include the 1992 election and poll results, we wantedonce again to compare Rosenstone's forecasts to those of the pundits andpollsters. Unfortunately, as the November election approached, we could nottrack down any official Rosenstone forecasts, so we decided to make our own.Our purpose was not to perform the most accurate forecasts or optimally toselect variables for prediction, but rather to combine the elements of existingforecasting methods in the political science literature and accurately to assessthe uncertainty in our forecast. We briefly outline our methodology here.'Campbell's forecast. We started with what we viewed as the best currentlyavailable forecasting model, that of Campbell,9 which predicts the Democraticshare of the two-party vote for president in each state. Campbell fits a linearregression of the statewide vote proportions in the eleven elections since 1948- 531 observations in all - on a set of nationwide, statewide and regionalpredictor variables. (The District of Columbia is ignored in the model, sinceit has reliably voted Democratic in every election.) The nationwide variables- which are constant in each election year - are the Democratic candidate'sshare of the trial heat polls two months before the election, incumbency (0,1, or - 1, depending on the party), and the change in Gross National Product(GNP) in the preceding year (counted positively or negatively, depending onwhether the Democrats or the Republicans are the incumbent party). Thestatewide variables are the state's vote in the last two presidential elections(relative to the nationwide vote in each case), a presidential and vice-presidentialhome-state advantage (0, 1, or - l), the change in the state's economic growthin the past year (counted positively or negatively depending on the incumbentparty), the partisanship of the state (measured by the proportion of Democratsin the state legislature) and the state's ideology (as measured by the averageof its congressional representatives' ADA-ACA interest-group rating scoresin 1988). The regional variables - meant to capture various regional effects,mostly from past elections - are dummy variables for the South in electionsin which one of the candidates was a Southerner, for the South in 1964, forthe deep South in 1964, for New England in 1964, the West in 1976, andfor the North Central region in 1980. Except for the Southern effect (whichcounted for Clinton), the regional variables had no effect in the 1992 elections;their only role was to remove anomalies in past elections and thus allow moreaccurate estimation of the systematic effects. Because of the data structure,the division into national, state and regional variables is more than a convenience. With 531 observations, a large number of state variables can reasonablyDetails appear in Andrew Gelman and Gary King, 'Forecasting the 1992 US PresidentialElection', manuscript, in progress.Campbell, 'Forecasting the Presidential Vote in the States'.
Why Are Presidental Election Polls So Variable?41 5be fitted to the election data set. National variables, however, must be morerestricted, since they are essentially being fitted to only eleven data oints.''After estimating the regression coefficients, Campbell predicts the state-bystate results for 1992 based on the national and state-by-state explanatory variables for that year, which could be obtained by early September. (Earlier,Campbell had made rough predictions based on preliminary estimates of theGNP change.) Each state was counted in the Democratic or Republican columndepending on whether its forecast Democratic vote proportion was greateror less than 0.5. In addition, the nationwide popular vote was estimated bymultiplying each state's forecast vote proportions by an estimate of turnout.We were easily able to replicate Campbell's exact numerical results.For the purposes of forecasting the 1992 election - a task we undertookin early October 1992, but only using information available in early September- we altered Campbell's model in three ways.Choosing explanatory variables. One problem with Campbell's forecastingmodel is that it is based on a single regression specification that has beenchosen because of its close fit to previous electoral data. As is well knownin econometrics and statistics, a prediction method optimized in this way willoften pick up the idiosyncratic, rather than systematic and persistent, featuresof these data and will therefore forecast poorly. For election forecasting, thismeans that (1) Campbell's standard errors are probably too low, and (2) itmay be possible to generate better forecasts by choosing a fit by more substantivecriteria.Rather than just selecting the one regression model that best fitted past data,we considered all models in which the chosen subset of explanatory variableswere plausible from a substantive standpoint and had low residual variancewhen fitted to the state election results from 1948 to 1988. Even together,these criteria are not sufficient to narrow the search to a single set of explanatoryvariables. Indeed, several subsets of the available variables met these criteria,including Campbell's, and we considered them together to represent the uncertainty in our forecasts due to the choice of predictor variables. These gave'O The 1992 presidential election campaign drew an unusually large number of political scientiststo make forecasts. The quality of these forecasts were quite uneven, as was their success. Modelswhich ignored features of voter decision making that the political science literature has demonstrated to be important - especially candidate ideology and presidential approval - seemed todo especially poorly. (For summaries, see Nathaniel Beck, 'Forecasting the 1992 Presidential Election: The Message is in the Conference Interval', Public Perspective, 3, No. 6 (1992), 32-3; PoliticalMethodologist, April 1993; Jay P. Greene, 'Forewarned Before Forecast: Presidential ElectionForecasting Models and the 1992 Election', PS, 26 (1993), 17-21.) It is easy to be too hard onall the forecasters of 1992, however, since this was a year without precedent: no president sinceTruman in 1948 has ever run for re-election with such low public approval. Fortunately, extremeobservations such as occurred in 1992 should help substantially in making future forecasts. Ofcourse, one should be especially wary of forecasting 'models' that are not precise enough to bereplicable. For example, one co-authored method was applied by each co-author in different television interviews: according to one, the method picked Clinton as the likely winner; accordingto the other, it picked Bush.
varying forecasts of Clinton's votes, from about 50 per cent to 56 per cent.(Campbell's choice happened to favour Bush more than most of these). Thestandard deviation of the estimates across models was about 1.5 per cent, whichwe considered to be the level of 'specification uncertainty' ignored by Campbell's(or any other reasonable) single linear model used to forecast. For the purposeof our estimation, we added the square of 1.5 per cent to the estimated predictivevariance, thus producing more realistic estimates of the uncertainty of ourforecasts. For our point estimate, we chose a model near the middle of therange of forecasts, which differed from Campbell's by including the followingvariables: (1) the president's approval rating, included as an interaction withthe national presidential incumbency variable; (2) the absolute differencebetween state and candidate ideologies, as used by osenstone;"and (3) anadditional regional variable for 1960 indicating the percentage of the state'spopulation that was Catholic in that year. Our method is therefore equivalentto including all available explanatory variables, with appropriate prior weights.Modeling dependence among states. Campbell's model ignores the year-by-yearstructure of the data, treating them as 531 independent observations, ratherthan eleven sets of roughly fifty related observations each. Substantively, thefeature of these data that Campbell's model misses is that partisan supportacross the states varies together: the Democratic candidate for president almostalways does better in Massachusetts than Utah, but both states give relativelymore to the Democrat when the Democratic candidate does better nationwide.Statistically, acknowledging this data grouping or dependence across stateswithin an election year can be accounted for by fitting an extra term in theregression model: a nationwide average forecasting error in addition to Campbell's state error term. As we show elsewhere,12 it is clear from the historicaldata that Campbell's single error term underestimates the variance of nationwide aggregate presidential vote share forecasts. Fitting a two-error modeldoes not change the point estimates of Democratic vote proportion in thestates, but allows a more realistic assessment of forecasting uncertainty.Calculating the forecast. Campbell calculates the expected number of electoralcollege delegates for each candidate by allocating all the delegates in a stateto the candidate forecast to get more than half the vote, and then adds overall the states. We use a slightly more sophisticated procedure to account forthe uncertainty in the forecast. For each state, our model yields an estimateof the proportion of the two-party vote that the Democrat will win. Fromthis estimate, along with the standard deviation of the forecast vote, we computed the probability that Clinton would win the state, based on the normaldistribution used in the regression. Clinton's expected electoral vote count isjust the sum of the electoral vote in each state, multiplied by the probability"l2Rosenstone, Forecasting Presidential Elections.Gelman and King, 'Forecasting the 1992 US Presidential Election'.
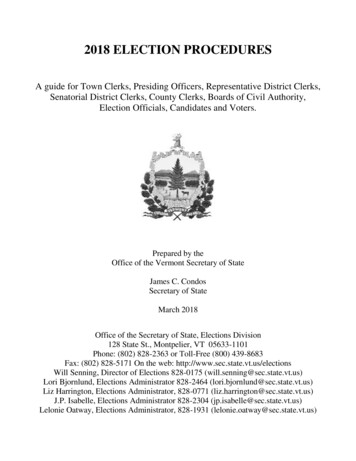
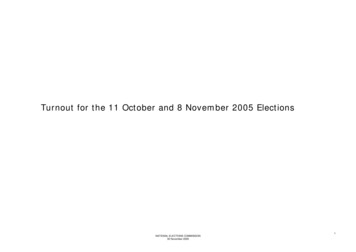
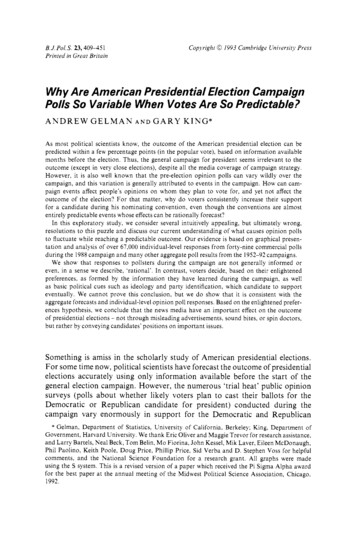
Why Are Presidental Election Polls So Variable?417that he wins the state. According to our calculation, Clinton had a 0.85 probability of winning the election, with an expected total of 53.1 per cent of thetwo-party popular vote and 368 (of 535) electoral votes.13For comparison, we also provide a more detailed presentation of aggregatepublic opinion poll results over the last eleven presidential election campaigns.Our data for this inquiry, and for the rest of this article, include the Republicanproportion of two-party support reported in surveys over these eleven elections.The data before 1988 are from Gallup; 1988 and 1992 also include all otherpolling organizations for which we could obtain relevant information.14 Ourdata include the aggregate information reported in Figure 1 and individual-levelsurvey data from forty-nine cross-sectional polls during the 1988 campaign.15In total, the 1988 data include surveys of 67,492 people, 69 per cent of whomwere willing to state their candidate preference. The appendix describes thesedata in more detail.16Figure 1 summarizes these data for each election since 1952. The triangleon the right-hand side of each graph reports the actual election outcome, andthe line traces out the changes in the Republican proportion of the two-partycandidate support figures over the campaign.''The graphs in Figure 1 show that, in most years, early public opinion pollsgive fairly miserable forecasts of the actual election outcome. The situationis somewhat better after the second party convention, but through almost theentire campaign it would not be wise to use polls to forecast the election outcome. Additionally, in virtually every presidential election in the last fortyl 3 We presented these forecasts several weeks before the election in public lectures at HarvardUniversity and the University of California, Berkeley, as well as in communications with severalothers.' I Our extensive analyses, some of which are reported below, indicate that one can safely mergethe data from the different polling organizations in order to study trends in candidate supportbut not the percentage undecided or not responding."e'chose the 1988 election because it was the most recent when we began our analyses.We completed all but the final draft of this article before the 1992 election.These polls are a vast and relatively untapped data source for election studies. As the Appendixdescribes most of the surveys also include a number of useful explanatory variables. Althougheach poll does not always include the exact question we would prefer, these data do containa considerable amount of data - considerably more interviews from 1988 alone than the sumtotal of all the interviews from every presidential National Election Survey since 1952. See HerbertAsher, Polling and the Public: What Every Citizen Should Know (Washington, DC: CongressionalQuarterly Press, 1988), for a general review of polls and the public.I' The survey question asked most often was, 'If the 1988 Presidential election were being heldtoday, would you vote for George Bush for President and Dan Quayle for Vice President, theRepublican candidates, or for Michael Dukakis for President and Lloyd Bentsen for Vice President,the Democratic candidates?' Analogous questions were asked in the other years. We confrontpotential problems of question wording below.
0.6;;;r]l.&l.0)50.42u5 0.2-200 -150 -100 -504-.-2-Days before election0-200 -1 50 -100 -50Days before election0Days before election10.2- 1-200-150 -100 -500Days before electionDays before election5Days before electionr1964PP19600.6. -.60.4mc 0.2Days before electionCT.-52-200 -150 -100 -500Days before election-200 -150 -100 -500Days before electionL0L1956-200 -150 -100-500Days before electionu0.2-200 -150 -100 -500Days before electionFig. I . Presidential trial heatsNotes: The solid line in each plot is the proportion of the survey respondents who would votefor the Republican candidate for president, among those who report a preference for the Democraticor Republican candidates. The 1992 and 1988 graphs include data from all available nationwidepolls; plots for the other years are from the Gallup Report. The upward arrow marks the timeof Republican convention and the downward arrow marks the time of the Democratic convention.years, the polls converge to a point near the actual election outcome shortlybefore election day.
Why Are Presidental Election Polls So Variable?2.419MODELS OF VOTER DECISION MAKING AND THEIR IMPLICATIONS2.1. Political Science ModelsMost existing political science forecasting models are based on state-level ornational-level aggregates, derived from the same ideas and underlying variablesas the models of individual voter choice favoured by political scientists. Beingaggregate results, though, these election predictions cannot truly confirm theindividual-level models. To understand individual-level behaviour, politicalscientists have turned to numerous studies based on public opinion data.Political scientists have developed numerous models of voter decision making,mostly in the context of studies of presidential campaigns. In the broadestterms, we have the sociological models dominated by the Columbia School,the social-psychological models connected with the Michigan School and therational choice models developed by the Rochester School. These models, theirdescendants and numerous oth
(about political science) was on voting behaviour (William Ogburn and Inez Goltra, 'How Women Vote: A Study of an Election in Portland, Oregon', Political Science Quarterly, 34 (1919), 413-33), and voting, particularly in presidential elections, has almost always remained a lively area of research. ' Steven J. Rosenstone, 'Predicting Elections .