Transcription
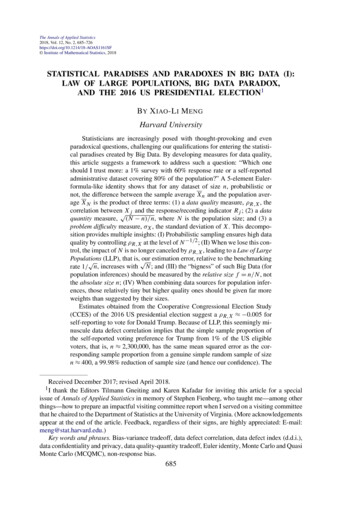
The Annals of Applied Statistics2018, Vol. 12, No. 2, 685–726https://doi.org/10.1214/18-AOAS1161SF Institute of Mathematical Statistics, 2018STATISTICAL PARADISES AND PARADOXES IN BIG DATA (I):LAW OF LARGE POPULATIONS, BIG DATA PARADOX,AND THE 2016 US PRESIDENTIAL ELECTION1B Y X IAO -L I M ENGHarvard UniversityStatisticians are increasingly posed with thought-provoking and evenparadoxical questions, challenging our qualifications for entering the statistical paradises created by Big Data. By developing measures for data quality,this article suggests a framework to address such a question: “Which oneshould I trust more: a 1% survey with 60% response rate or a self-reportedadministrative dataset covering 80% of the population?” A 5-element Eulerformula-like identity shows that for any dataset of size n, probabilistic ornot, the difference between the sample average Xn and the population average XN is the product of three terms: (1) a data quality measure, ρR,X , thecorrelation between Xj and the response/recording indicator Rj ; (2) a dataquantity measure, (N n)/n, where N is the population size; and (3) aproblem difficulty measure, σX , the standard deviation of X. This decomposition provides multiple insights: (I) Probabilistic sampling ensures high dataquality by controlling ρR,X at the level of N 1/2 ; (II) When we lose this control, the impact of N is no longer canceled by ρR,X , leading to a Law of LargePopulationsour estimation error, relative to the benchmarking (LLP), that is, rate 1/ n, increases with N; and (III) the “bigness” of such Big Data (forpopulation inferences) should be measured by the relative size f n/N , notthe absolute size n; (IV) When combining data sources for population inferences, those relatively tiny but higher quality ones should be given far moreweights than suggested by their sizes.Estimates obtained from the Cooperative Congressional Election Study(CCES) of the 2016 US presidential election suggest a ρR,X 0.005 forself-reporting to vote for Donald Trump. Because of LLP, this seemingly minuscule data defect correlation implies that the simple sample proportion ofthe self-reported voting preference for Trump from 1% of the US eligiblevoters, that is, n 2,300,000, has the same mean squared error as the corresponding sample proportion from a genuine simple random sample of sizen 400, a 99.98% reduction of sample size (and hence our confidence). TheReceived December 2017; revised April 2018.1 I thank the Editors Tilmann Gneiting and Karen Kafadar for inviting this article for a specialissue of Annals of Applied Statistics in memory of Stephen Fienberg, who taught me—among otherthings—how to prepare an impactful visiting committee report when I served on a visiting committeethat he chaired to the Department of Statistics at the University of Virginia. (More acknowledgementsappear at the end of the article. Feedback, regardless of their signs, are highly appreciated: E-mail:meng@stat.harvard.edu.)Key words and phrases. Bias-variance tradeoff, data defect correlation, data defect index (d.d.i.),data confidentiality and privacy, data quality-quantity tradeoff, Euler identity, Monte Carlo and QuasiMonte Carlo (MCQMC), non-response bias.685
686X.-L. MENGCCES data demonstrate LLP vividly: on average, the larger the state’s voterpopulations, the further away the actual Trump vote shares from the usual95% confidence intervals based on the sample proportions. This should remind us that, without taking data quality into account, population inferenceswith Big Data are subject to a Big Data Paradox: the more the data, the surerwe fool ourselves.1. Prologue: Paradise gained or lost? Big Data, however the term is definedor (un)appreciated, has posed a paradoxical situation for Statistics and statisticians, in both external perceptions and internal reflections. Almost since the dawnof statistics, the dominating mathematical tool for justifying statistical methodshas been large-sample asymptotics. Neither the Law of Large Numbers nor theCentral Limit Theorem, two pillars of the vast statistical palace, could be established without such asymptotics. Surely then we statisticians must be thrilled bythe explosive growth of data size, justifying all the large-sample asymptotic resultsout there. A statistical paradise would seem to have arrived.The reality appears to be the opposite. The size of our data greatly exceeds thevolume that can be comfortably handled by our laptops or software, and the varietyof the data challenges the most sophisticated models or tools at our disposal. Manyproblems demand the type of velocity that would make our head spin for both dataprocessing and analysis. But the worst of all, it appears that the more we lamenthow our nutritious recipes are increasingly being ignored, the more fast food isbeing produced, consumed and even celebrated as the cuisine of a coming age.Indeed, some of our most seasoned chefs are working tirelessly to preserve ourtime-honored culinary skills, while others are preparing themselves for the gameof speed cooking. Yet others need a daily nightcap to ease the nightmare of theforever lost statistical paradise, even before it actually arrives.Am I too pessimistic or cynical? I’ll let you be the judge, as you know bestto which group you belong. As for my group membership, I share the concern ofparadise lost if too many of us are capable of only reminiscing about our (not too)good old days. But I see a paradise, or even paradises, gained if there is a sufficientnumber of us who can engage in what we have advertised to be the hallmark of ourdiscipline, that is, principled thinking and methodology development for dealingwith uncertainty. Fast food will always exist because of the demand—how manyof us have repeatedly had those quick bites that our doctors have repeatedly toldus stay away from? But this is the very reason that we need more people to workon understanding and warning about the ingredients that make fast food (methods)harmful; to study how to reduce the harm without unduly affecting their appeal;and to supply healthier and tastier meals (more principled and efficient methods)that are affordable (applicable) by the general public (users).This is how I see paradises arising. Big Data have given us many fascinatingand challenging research problems, for which we statisticians have multiple—yetunique—roles to play. To solve them well, typically a team is needed, consisting
STATISTICAL PARADISES AND PARADOXES IN BIG DATA (I)687of computer scientists, domain experts, (applied) mathematicians, statisticians, etc.Our century-long contemplation of principled assessments of uncertainty should,at the very least, help the team to greatly reduce unnecessary trials and errorsby avoiding statistical fallacies, unrealistic expectations, misguided intuitions, andmisleading evaluations. Re-inventing the wheel is a well-known phenomenon inalmost any field and it is a common source of unhappiness in academia. But froma practical and societal point of view, the real damage occurs when the re-inventedwheels are inferior, increasing the frequency of serious or even fatal accidents.Quality control is thus an important role for statisticians to carry out, as well as aforce for innovation because real advances occur more from the desire to improvequality than quantity.Indeed, the current project started when I was asked to help with statisticalquality control by an agency. Among the first questions was “Which one shouldwe trust more, a 5% survey sample or an 80% administrative dataset?”, which ledto the development of the data defect index, a main subject of this paper. Hencethis paper focuses on population inferences from Big Data. The harder problemof individualized predictions with Big Data will be treated in the sequel, Meng(2018). For population inferences, a key “policy proposal” of the current paper isto shift from our traditional focus on assessing probabilistic uncertainty (e.g., in asample mean) in the familiar form ofσStandard Error nto the practice of ascertaining systematic error in non-probabilistic Big Data captured by Relative Bias ρ N.Here “Relative Bias” is the bias in the sample mean relative to a benchmarkingstandard error, σ and n are standard deviation and sample size, and N is the longforgotten population size. The unfamiliar term ρ is a data defect correlation, defined in this paper. We demonstrate via theoretical and empirical evidence that thisshift is necessary if we want our error assessments—and our roles as experts on uncertainty quantifications—to remain relevant for Big-Data population inferences.Specifically, Section 2 introduces a fundamental identity that quantifies thetradeoff between data quantity and data quality for using sample averages to estimate population averages, and correspondingly the concept of data defect index.Section 3 uses insights generated by the identity to reveal troubling phenomenaarising from low-quality Big Data, especially a Law of Large Populations and aBig Data Paradox. Section 4 then applies these concepts and results to binaryoutcomes and to the 2016 US presidential election, which reveals a plausible explanation for our collective pre-election over-confidence (and hence post-electionsurprise). Section 5 makes a pedagogical link to the well-known Euler identity inmathematics, and discusses the use of the fundamental identity for Monte Carloand Quasi Monte Carlo integrations, as well as for improving data confidentiality.
688X.-L. MENG2. A fundamental identity for data quality-quantity tradeoff.2.1. Motivating questions. “Which one should I trust more: a 1% survey with60% response rate or a non-probabilistic dataset covering 80% of the population?”Such a question was posed, for example, by Professor Thomas Louis in his presentation of Keiding and Louis (2016) at the Joint Statistical Meetings (JSM) 2015in Seattle. Raised prior to the arrival of the era of Big Data, this question wouldlikely be treated as an academic curiosity—how often can we get a hold of 80% ofa population? Isn’t the whole idea of survey sampling to learn about a populationwithout having to record a large chunk of it?Indeed, learning reliably about a population via probabilistic sampling asoupçon of it was a revolutionary idea at the turn of the 19th century, an idea thattook essentially half a century to be (almost) universally accepted; see Bethlehem(2009) and Fuller (2011), the latter of which is also a rich source of theory andmethods in sampling surveys. A good way to explain this seemingly magical poweris to analogize it to the tasting of soup—as long as the soup is stirred sufficientlyuniformly, a spoonful is all it takes to ascertain the flavor of the soup regardlessof the size of its container. A tiny high quality sample can provide as much information as many large ones with low quality, and here the quality is measuredby the representativeness, achieved via “uniform stirring.” For most human (andother) populations, “uniform stirring” is not feasible, but probabilistic samplingdoes essentially the same trick.Therefore, the question raised above is about the tradeoff between data quantityand quality. This tradeoff is even clearer in a question raised in another presentationsix years earlier: “Integrated and Synthetic Data: Part of Future Statistics?” by Dr.Jeremy Wu, then the Director of the LED (Local Employment Dynamics) projectat the US Census Bureau. After reviewing the long history of surveys and how thestudy of statistics gained its vitality by showing “A 5% random sample is ‘better’than 5% non-random sample in measurable terms”, Dr. Wu asked, “Is an 80%non-random sample ‘better’ than a 5% random sample in measurable terms? 90%?95%? 99%?”The qualitative answer clearly is “it depends”, on how non-random the largersample is. We would imagine that a small departure from being random should notoverwhelm the large gain in sample size. But how small must it be? And indeedhow to quantify “better” or being “non-random”? The question raised by ProfessorLouis is even harder, because the quality of the probabilistic survey itself has beendegraded by the non-response mechanism, typically a non-probabilistic process initself, creating the well-known problem of a non-ignorable missing-data mechanism [Heitjan and Rubin (1990), Rubin (1976)]. Therefore a key question is howto compare two datasets with different quantities and different qualities?Such questions become increasingly relevant as we venture deeper into the BigData era, a signature of which is the availability of many datasets covering largepercentages of their respective populations, yet they were never intended to be
STATISTICAL PARADISES AND PARADOXES IN BIG DATA (I)689probabilistic samples. For example, the LED project used unemployment insurance wage records, which cover more than 90% of the US workforce, and therecords were kept because of law (but not the law of large numbers), and it isknown to exclude all federal employers. It clearly would be foolish to ignore suchbig datasets because they are not probabilistic or representative. But in order touse them, we minimally need to know how much they can help or whether theycan actually do more harm than help. The following development was built uponan earlier idea in Meng (2014), where an approximate identity was obtained because of the use of the propensity instead of the actual data recording indicator, asdefined below.2.2. An identity linking data quantity, data quality and problem difficulty. Letus start by considering a finite population, as in virtually all real-life problems,with individuals (not necessarily human) indexed by j 1, . . . , N . Suppose the individual attributes of interests are coded into a (multi-dimensional) variable X. Asis well known, many population quantities of interest can be expressed as the population average of {Gj G(Xj ), j 1, . . . , N}, denoted by GN , by choosing anappropriate function G, such as polynomial functions for moments and indicatorfunctions for distributions or quantiles; for simplicity of notation, we will assumeG maps X to the real line. Therefore, when we have a sample, say {Xj , j In },where In is a size n subset of {1, . . . , N}, the most routinely adopted estimator ofGN is the sample average [for good reasons as it is often both design consistentand model-based consistent; see Firth and Bennett (1998)], (2.1)N1 j 1 Rj GjGn Gj N,n j IRjj 1nwhere Rj 1 for j In and Rj 0 otherwise. Here the letter “R”, which leadsto the R-mechanism, is used to remind ourselves of many possible ways that asample arrived at our desk or disk, most of which are not of a probabilistic sampling nature. For Random sampling, R {R1 , . . . , RN } has a well-specified joint distribution, conditioning on the sample size Nj 1 Rj n. This is the case whenwe conduct probabilistic sampling and we are able to record all the intended data,typically unachievable in practice, other than with Monte Carlo simulations (seeSection 5.3).For many Big Data out there, however, they are either self-Reported or administratively Recorded, with no consideration for probabilistic sampling whatsoever.Even in cases where the data collector started with a probabilistic sampling design, as in many social science studies or governmental data projects, in the endwe have only observations from those who choose to Respond, a process whichagain is outside of the probabilistic sampling framework. These “R-mechanisms”therefore are crucial in determining the accuracy of Gn as an estimator of GN ; for
690X.-L. MENGsimplicity, hereafter the phrase “recorded” or “recording” will be used to representall such R-mechanisms.It is thus entirely possible that nothing in (2.1) is probabilistic. The Xj ’s andhence Gj ’s are fixed, as usual with a finite-population framework [see for example Royall (1968)]. The Rj ’s can be fixed as well, that is, no matter how often werepeat the process (as a thought experiment), each individual will either alwayschoose to report or never report. This, however, does not render our beloved probabilistic approach obsolete. Far from it, a simple probabilistic argument provides adeep insight into how to quantify the recording mechanism, and how it affects theaccuracy of Gn .The key here is to express the actual error Gn GN in statistical terms that cangenerate insights. The standard tool of expressing a sample average as an expectation with respect to an empirical distribution comes in handy for this purpose.Specifically, for any set of numbers {A1 , . . . , AN }, we can view it as the supportof a random variable AJ induced by the randomindex J defined on {1, . . . , N}. NWhen J is uniformly distributed, EJ (AJ ) j 1 Aj /N AN , the usual average.Consequently, the difference between Gn and GN can be written asGn GN (2.2)EJ (RJ GJ )EJ (RJ GJ ) EJ (RJ )EJ (GJ ) EJ (GJ ) EJ (RJ )EJ (RJ ) CovJ (RJ , GJ ),EJ (RJ )where EJ and CovJ are all taken with respect to the uniform distribution on J {1, . . . , N}. This is a trivial variation of the key identity for bounding the bias ofratio estimators [see Hartley and Ross (1954), Meng (1993)]. Yet it holds criticalinsights we need in order to quantify our estimation error with both probabilisticand non-probabilistic samples, that is, with any R-mechanism.To see this, we first let ρR,G CorrJ (RJ , GJ ) be the (population) correlationbetween RJ and GJ , f EJ (RJ ) n/N be the sampling rate, and σG be thestandard deviation of GJ , all defined according to the uniform distribution of J .Then, using the fact that the variance of the binary RJ is VJ (RJ ) f (1 f ), wehave from (2.2) that (2.3)Gn GN ρR,G Data Quality 1 f f σG .Problem DifficultyData QuantityThis identity tells us that there are three—and only three—factors that determineour estimation error. The obvious factor of data quantity is captured by (1 f )/fin the second term on the right-hand side of (2.3), which renders precisely zeroerror when we record (accurately) the entire population (f 1) and infinite errorwhen we record no data (f 0). Another obvious factor is the problem difficulty
STATISTICAL PARADISES AND PARADOXES IN BIG DATA (I)691captured by σG or equivalently by σG2 . If GJ is a constant (i.e., σG2 0), then itis the easiest estimation problem, because n 1 is sufficient to render zero error.The more variation among Gj ’s, that is, the larger the σG , the more difficult toestimate GN accurately.As we shall demonstrate via theoretical and empirical evidence throughout thispaper, the most critical—yet most challenging to assess—among the three is dataquality. Identity (2.3) establishes that for sample averages, the data quality is captured by the data defect correlation ρR,G because it precisely measures both thesign and degree of selection bias caused by the R-mechanism. Intuitively, in theabsence of any selection bias, such as under a genuine probabilistic sampling, thechance that a particular value of G is recorded/reported or not should not dependon the value itself. Consequently, ρR,G should be zero on average (over the potential randomness in R). On the other hand, if larger values of G have higher/lowerchances to be recorded, then Gn overestimates/underestimates GN . Such tendencyis indicated by the sign of ρR,G , and the degree of the bias is captured by themagnitude of ρR,G (for given data quantity and problem difficulty).It is important to emphasize that the identity (2.3) is exact and truly free of anymathematical or probabilistic assumption because the right-hand side of (2.3) ismerely an algebraic re-expression of its left-hand side. Statistically, (2.3) is applicable whenever the recorded values of G can be trusted; for example, if a responseis to vote for Clinton, it means that the respondent is sufficiently inclined to votefor Clinton at the time of response, not anything else. Otherwise we will be dealing with a much harder problem of response bias, which would require strongsubstantive knowledge and model assumptions [see, e.g., Liu et al. (2013)]. SeeShirani-Mehr et al. (2018) for a discussion of other types of response bias thatcontribute to the so-called Total Error of survey estimates.Under the assumption of no such response bias, (2.3) allows us to express themean-squared error (MSE) of Gn , MSER (Gn ) ER [Gn GN ]2 , over any Rmechanism,2 as(2.4)2 MSER (Gn ) ER ρR,G1 ff σG2 DI DO DU ,where ER denotes the expectation withrespect to any chosen distribution of R Nbut conditioning on the sample size j 1 Rj n, as is typical with finite sample calculations. Here the notation of Ds—with subscripts “I O U” for easymemorization—is adopted both for simplicity and for potential generalizabilitygoing beyond estimating population means. For notation simplicity, we have suppressed, but do not forget, the dependence of DI and DU on G. Identity (2.4)reinforces the three ways of reducing the MSE:2 This includes the trivial case where R is deterministic, by using a singleton-mass probabilitydistribution.
692X.-L. MENG2 ], a data Defect In(I) Increase the data quality by reducing DI ER [ρR,Gdex3 —this is the aim of all probabilistic sampling designs, as we shall discuss inSection 3.1;(II) Increase the data quantity by reducing the Dropout Odds:DO (1 f )/f —Big Data promises this, but unfortunately it is far less effectivethan reducing DI —see Section 3.2;(III) Reduce the difficulty of the estimation problem by reducing the Degree ofUncertainty DU σG2 —this is typically actionable only with additional information; see Section 5.1.It is of critical importance to recognize explicitly that the concept of data qualitymust be a relative one, and more precisely it should be termed as data quality fora particular study. This is because any meaningful quantification of data quality,such as the data defect index (d.d.i.) DI we just defined, must depend on (1) thepurposes of the analysis—a dataset can be of very high quality for one purposebut useless for another (e.g., the choice of the G function4 ); (2) the method ofanalysis (e.g., the choice of sample average instead of sample median); and (3)the actual data the analyst includes in the analysis, which is an integrated part ofthe R-mechanism. As a demonstration, Section 3.4 will provide an identity thatgeneralizes (2.3)–(2.4) to weighted estimators, which illustrates how data qualityis affected by the weights.We also emphasize that assessing the d.d.i. DI is relevant even if we cannotdetermine whether the defects are mostly due to data collection or due to dataanalysis. This is because either way it can help inform future studies where a similar integrated process of data collection and analysis is repeated. Section 4.2 willillustrate this point in the context of the 2016 US general election, with the aim ofgaining a 2020 vision for the next US presidential election. In the context of nonresponse or more generally missing data, d.d.i. can also be used as a measure of thedegree of “nonignorability”, in the same spirit of index of sensitivity to nonignorability (ISNI) proposed in Troxel, Ma and Heitjan (2004). The main difference isthat DI is defined with respect to sample mean and hence it requires no likelihoodspecification, whereas ISNI aims to measure the rate of change of the parametriclikelihood inference as one moves away from the assumption of ignorability.3 In Meng (2014), E ρR R,G was termed as “data defect index”. Whereas this earlier definition hasthe virtue of having zero defect for equal-probability sampling, it masks the impact of the population2resolves this problem, and it connects directly withsize N . The updated definition via ER ρR,GMSE.4 An excellent question raised by Dr. Alex Adamou during the 2016 Royal Statistical Society (RSS)conference is how to define d.d.i. when our estimand is population maximum or minimum. In general,defining appropriate d.d.i. for estimators and estimands other than sample and population averagesis currently an open problem.
STATISTICAL PARADISES AND PARADOXES IN BIG DATA (I)6932.3. Understanding d.d.i.: Data defect index. Among the three terms definedin (I)–(III), DO (1 f )/f and DU σG2 are functions of traditionally familiar measures, and their magnitudes are well understood: both can vary freely on[0, ) with no mathematical constraints between them in general. In comparison,2 ] is new. As such, readers may have (at least) three questhe d.d.i. DI ER [ρR,Gtions:(A) What are the likely magnitudes of DI , when we have probabilistic samples?(B) How do we calculate or estimate DI for non-probabilistic data?(C) Theoretically, can DI take any value in [0, 1], for a given DO and DU ?To address question (A), let us consider the most basic building block in probabilistic sampling, the simple random sampling (SRS). Under SRS, Gn is unbiasedfor GN and its mean squared error (MSE) is the same as its variance:1 f 2N2SGσ2,with SG nN 1 Gwhere (1 f ) is known as the “finite sample correction” [e.g., Kish (1965)]. Substituting (2.5) to the left-hand side of (2.4) immediately reveals that the d.d.i. forany SRS is given by(2.5)(2.6)VSRS (Gn ) 2 DI ESRS ρR,G1.N 1In Section 3, we will show that this DI N 1 phenomenon holds for probabilisticsampling in general, and hence DI will be vanishingly small for large populations.It is this finding, which will be fully explored in later sections, that provides thecritical insight to most troubles for dealing with non-probabilistic Big Data setswhen their DI ’s do not vanish with N 1 .The question (B) has a short answer: we cannot estimate DI from the sampleitself. By definition, everyone in the sample has RJ 1, and hence there is nodirect5 information in the sample for estimating ρR,G . Logically, this has to bethe case because if there were meaningful ways to estimate ρR,G from the samesample, identity (2.3) would then immediately permit us to estimate the actualerror Gn GN , which is impossible without any knowledge/assumption aboutthe R-mechanism. However, this observation also implies that when we are ableto ascertain the actual error, such as post-elections, we can ascertain ρR,G andhence DI , as demonstrated in Section 4.2 using a polling dataset from 2016 USpresidential election. The hope here is that because ρR,G and hence DI capturesindividual response behaviors, there are patterns and lessons to be learned thatcan help to generate more reliable prior information for future elections. More5 Indirect information can exist because of the mathematical constraints imposed by the knownsampling rate f and marginal information about G, as shall be discussed shortly.
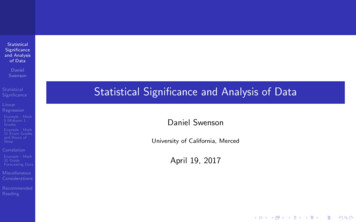
694X.-L. MENGgenerally, by borrowing information from similar datasets (e.g., from historical orneighboring studies), we may be able to construct a reasonable prior for ρR,G orDI , which minimally would permit us to conduct an informative sensitivity study.For example, the state-wise election data from the 2016 US presidential electionallow us to form histograms of ρR,G (see Section 4.2), which can be used as aplausible prior distribution of ρR,G for the 2020 US presidential election.For question (C), the answer is more involved, because ρR,G is determined bythe joint distribution of {RJ , GJ } induced by the uniform distribution over J , butDO and DU are characteristics of the marginal distributions of RJ and of GJ ,respectively. Although marginal means and variances (e.g., f, σG2 ) are not oftenperceived to affect correlations (e.g., ρR,G ), in general they do impose restrictionsbecause of the Hoeffding identity [Höffding (1940)](2.7)Cov(X, Y ) FX,Y (x, y) FX (x)FY (y) dx dyand the Fréchet bounds [Fréchet (1951)](2.8) max FX (x) FY (y) 1, 0 FX,Y (x, y) min FX (x), FY (y) ,where FX,Y is a joint cumulative distribution function (CDF) with FX and FY being its two marginal CDFs. The restriction can be particularly severe (mathematically) with discrete variables, especially binary ones. To see this, suppose Gj isalso binary, for example, Gj 1 if the j th person plans to support Donald Trumpand Gj 0 otherwise. Let pG PJ (GJ 1) and OG pG /(1 pG ), that is, theodds for voting for Trump. Then, as a special case of Hoeffding–Fréchet bounds,we have (2.9) min DOOG1, ρR,G min OG DO , ,OGDOOG DOwhere the upper bound is achieved by RJ GJ (e.g., a person responds to thesurvey if and only if the person plans to vote for Trump), and the lower bound byRJ 1 GJ (e.g., a person responds if and only if the person does not plan tovote for Trump). Figure 1 helps to visualize (2.9) in terms of the restrictions onρR,G as imposed by pG and f , where we see that the restrictions are more severewhen either f or pG becomes extreme, that is, very close to zero or one.As a numerical illustration, if we take OG 1, and DO 99 (e.g., 1% of thevoter population responded), then (2.9) yields ρR,G 0.1005. Whereas suchbounds might seem very restrictive, we will see shortly, both from theory (Section 3.1) and from the 2016 US election data (Section 4.2, especially Figure 8),that they are far looser than likely in practice, as otherwise our sample resultswould be essentially useless. Nevertheless, the existence of these bounds suggestscaution when we intuitively consider the “smallness” of ρR,G , or when we set values of DI for theoretical investigations. We must always check if our choices of
STATISTICAL PARADISES AND PARADOXES IN BIG DATA (I)695F IG . 1. The shadowed region in the 3D plot depicts the permissible values of {ρR,G , pG , f } asdetermined by (2.9). The restrictions become more severe for ρR,G as {f, pG } moves further awayfrom the line f pG for ρR,G 0 or from the line f 1 pG for ρR,G 0. The 2D plots showseveral slices, explicating further how {pG , f } restricts ρR,G .“I O U” correspond to impossible scenarios, or more i
arising from low-quality Big Data, especially a Law of Large Populations and a Big Data Paradox. Section 4 then applies these concepts and results to binary outcomes and to the 2016 US presidential election, which reveals a plausible ex-planation for our collective pre-election over-confidence (and hence post-election surprise).