Transcription
Voxengo SPAN User GuideVersion 3.14https://www.voxengo.com/product/span/
Voxengo SPAN User GuideContentsIntroduction 3Features 3Compatibility 3User Interface Elements 4Spectrum 4Statistics 4Metering 5Correlation Meter 5Credits 72
Voxengo SPAN User GuideIntroductionSPAN is a real-time “fast Fourier transform” audio spectrum analyzer plug-in forprofessional music and audio production applications.SPAN provides you with a very flexible “mode” system which you can use to setupyour spectrum analyzer preferences. You may specify Fourier block size in samples,FFT window overlap percentage, spectrum's visual slope. Beside that you can chooseto display secondary spectrum of a desired type (e.g., real-time maximum, all-timemaximum). Spectrum can be smoothed out visually for an easier examination.SPAN supports multi-channel analysis, and can be set to display spectrums from twodifferent channels or channel groups at the same time. Spectrum's color can bechosen to taste.SPAN also features output level metering with adjustable ballistics and integrationtime, EBU R128, K-system metering (including calibration K-system metering).SPAN displays level metering statistics, headroom estimation, and clipping detection.Correlation metering is available as well.Features Output signal power statisticsSpectrum smoothingUser interface window resizingTrue peak and clipping statisticsCorrelation meterEBU R128 LUFS/LU meteringK-system metering (unweighted)Stereo and multi-channel analysisMid/side analysisInternal channel routingChannel groupingPreset managerUndo/redo historyA/B comparisonsContextual hint messagesAll sample rates supportCompatibilityThis audio plug-in can be loaded into any audio host application that conforms to theAAX, AudioUnit, VST, or VST3 plug-in specification.This plug-in is compatible with Windows (32- and 64-bit Windows XP, Vista, 7, 8, 10and later versions, if not announced otherwise) and macOS (10.11 and later versions,if not announced otherwise, 64-bit Intel and Apple Silicon processor-based)computers (2.5 GHz dual-core or faster processor with at least 4 GB of system RAMrequired). A separate binary distribution file is available for each target computerplatform and audio plug-in specification.3
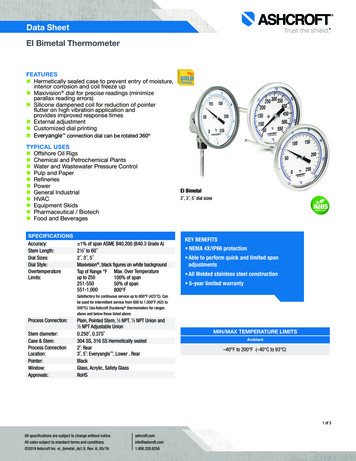
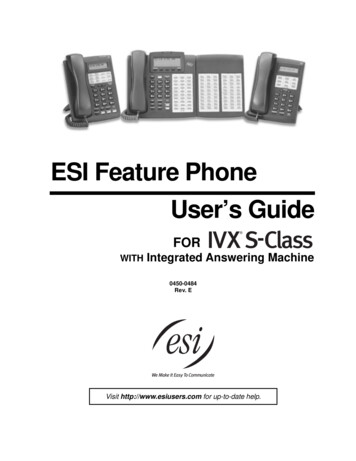
Voxengo SPAN User GuideUser Interface ElementsNote: All Voxengo plug-ins feature a highly consistent user interface. Most interfaceelements (buttons, labels) located at the top of the user interface are the same in allVoxengo plug-ins. For an in-depth description of these and other standard features,and user interface elements, please refer to the “Voxengo Primary User Guide”.SpectrumThis bigger panel displays the spectrum (in the specified color) of the current channelgroup. Note that the secondary spectrum is displayed in a darker color. You may usethe “narrow-band sweeping” mode by holding the “Ctrl” (“Command” on Mac OS X)key.The “Hold” switch allows you to hold spectrum updates temporarily for the purposeof visual comparison. Note that spectrum updates will be automatically resumedwhenever you switch between channel groups.The “Underlay” selector allows you to add an additional underlying spectrum (in aspecified color) from another channel group of the current plug-in instance. If youwould like to see spectrums of left and right channels together, please load the “DualMono” routing preset and set the “Underlay” selector to “Right”.You may right-click on the spectrum to copy the current frequency pointer value tothe clipboard (you may then paste it to an equalizer).Even though in some audio host applications (e.g., Ableton Live) SPAN in VST formatexposes 8 audio inputs, it does not mean it can display more than 2 spectrums at thesame time. Please consider using GlissEQ or SPAN Plus if you would like to performcross-track multi-spectrum analysis.The “Hide Meters and Stats” switch hides all meters and statistics panels and extendsthe spectrum analyzer panel.The “Mode” selector allows you to select and edit spectrum’s display mode. Pleaserefer to the “Voxengo Primary User Guide” (namely, the topic called “StandardControls – Spectrum Mode Editor”) for in-depth information about spectrum modesettings.Note that by default SPAN uses 4.5 dB per octave slope for the spectrum displaywhich makes it look considerably “elevated” towards the higher frequencies incomparison to most other spectrum analyzers available on the market. This settingcan be changed in the “Spectrum Mode Editor” window.StatisticsThis panel displays historic (since the last reset or playback start) statisticalinformation for each channel of the currently selected channel group.The “RMS”/“Integr” indicator displays integrated signal power estimation.The “Max Crest Factor” indicator shows maximum crest factor (difference) betweenthe RMS and peak RMS values reached. Peak RMS value is not displayed anywhereon the user interface. 50 ms time window is used to estimate the peak RMS value.4
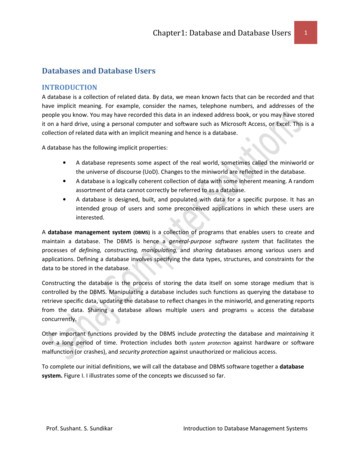
Voxengo SPAN User GuideYou may add the “RMS”/“Integr” and “Max Crest Factor” values together to obtain apeak RMS value. Note that when comparing the “Max Crest Factor” value in SPAN toplug-ins of other companies the peak RMS time windows should be matched in theplug-ins in comparison or otherwise the readings will be different, with shorter peakRMS time window (e.g. instant peak value) showing a greater “Max Crest Factor”value.The “True Peak”/“Peak” indicator displays 1-sample output true peak/sample peaklevel. Basically, this indicator detects samples that will be clipped if signal isconverted to a limited bit depth. The “TP” switch changes between “true peak” and“sample peak” level and clipping indication. The true peak clipping indication is alsouseful when using noise-shaping at low bit depth dithering settings since noisebecomes powerful enough to go over 0 dBFS.The “Reset” button can be used to reset counters and start statistical accumulationover.MeteringThe “Metering” selector allows you to choose the meter biasing mode. The “dBFS”,“dBFS.30” and “dBFS.15” modes apply no biasing. These three modes have adiffering level meter range. The “dBFS 3” mode adds 3 dB to level meter indicator,the “RMS”/“Integr” values (peak level indication is unchanged in comparison to the“dBFS” modes). This mode can be used in combination with the “Align 0 dB” and“Slope 0” spectrum display mode to match spectral power to the level meter.The “K-20”, “K-14” and “K-12” modes offer various K-system biasing modes originallyoffered by Bob Katz. The “K-20 C”, “K-14 C” and “K-12 C” implement levelcalibration modes. In these “K” modes level meter’s RMS integration and releasetime constants are fixed to 600 ms as per K-system specification, level meter’sintegration time is not affected by plug-in’s “Settings” window. Weighting is not usedin all these “K” metering modes.The “LUFS” and “LU” modes implement EBU-R128 K-weighted metering standard,by following ITU-R BS.1770-4 and Tech 3341-2016 notes (most elements of the “EBUMode” are offered, except EBU 18 scale; and no summary loudness level isdisplayed). The modes with the “ML” suffix display the momentary loudness on thelevel meter, with 0.4-second integration window, the “SL” modes reflect the shortterm loudness, with 3-second integration window. Both modes also displayintegrated loudness on the “Integr” statistics panel. In these modes, level meter’sintegration time is fixed and is not affected by plug-in’s “Settings” window.Integrated loudness level is updated only twice a second and only considers therecent 5 minutes of loudness measurements since reset/restart, due to real-time CPUrestrictions. The “Max Crest Factor” calculation in LUFS/LU modes uses the sametechnique as in other metering modes; it is, however, performed using RMSintegrated loudness level, not EBU-R128 loudness level, but it uses K-weighting.Correlation MeterThis panel contains meter that shows average real-time correlation between two firstinput channels.5
Voxengo SPAN User GuideThis panel also shows the average balance (in decibel) between two first inputchannels during the last 3 seconds. Negative values tell that the first (left) channel islouder by the specified amount in decibel.Please read the topic named the “Knowledge Bit – Correlation” in the “VoxengoPrimary User Guide” for a specific information on correlation values and theirpossible meaning.6
Voxengo SPAN User GuideCreditsDSP algorithms, internal signal routing code, user interface layout by Aleksey Vaneev.Graphics user interface code by Vladimir Stolypko. Graphics elements by VladimirStolypko and Scott Kane.This plug-in is implemented in multi-platform C code form and uses “zlib”compression library (written by Jean-loup Gailly and Mark Adler), “LZ4”compression library by Yann Collet, “base64” code by Jouni Malinen, FFT algorithmby Takuya Ooura, filter design equations by Magnus Jonsson and Robert BristowJohnson, VST plug-in technology by Steinberg, AudioUnit plug-in SDK by Apple,Inc., AAX plug-in SDK by Avid Technology, Inc., Intel IPP and run-time library byIntel Corporation (used under the corresponding licenses granted by these parties).Voxengo SPAN Copyright 2004-2022 Aleksey Vaneev.VST is a trademark and software of Steinberg Media Technologies GmbH.7
This plug-in is compatible with Windows (32- and 64-bit Windows XP, Vista, 7, 8, 10 and later versions, if not announced otherwise) and macOS (10.11 and later versions, if not announced otherwise, 64-bit Intel and Apple Silicon processor-based) computers (2.5 GHz dual-core or faster processor with at least 4 GB of system RAM required).