Transcription
THIS REPORT CONTAINS ASSESSMENTS OF COMMODITY AND TRADE ISSUES MADE BYUSDA STAFF AND NOT NECESSARILY STATEMENTS OF OFFICIAL U.S. GOVERNMENTPOLICYRequired Report - public distributionDate: 12/22/2017GAIN Report Number: CI 1735ChileFood Service - Hotel Restaurant InstitutionalExcellent Export Opportunities for U.S. Processed Foods andGourmet ProductsApproved By:Marcela Rondon, Agricultural AttachéPrepared By:Sergio Gonzalez, Agricultural SpecialistReport Highlights:Chile offers excellent opportunities for U.S. food exports. Chile’s economy is ranked as a highincome economy by the World Bank and is considered South America’s most stable and prosperousnation in Latin America and the Caribbean, and Lonely Planet Travel Guide selected Chile as the topworld destination you should visit in 2018. Hotels are expected to continue to thrive and this willprovide export opportunities for U.S. producers. Hotels, restaurants and institutions seek to reduceoperational costs by buying processed foods and ready-made meals which minimize labor costs.1
Post:SantiagoExecutive Summary: Chile is the top market for “consumer oriented products” in South America. This category ofproducts represented 67% of all U.S. agricultural and related exports to Chile in January –October 2017 reaching a value of 600 million and a 40.6% increase over 2016, the highest levelof exports recorded so far. Economically, Chile is the top performing country in the region of Latin America and theCaribbean Chile is expected to return to a 3% growth in 2018. Consumer spending is projected to have areal growth of 3.6% following 2018. Chile was selected the top world destination to travel in 2018 according to Lonely Planet TravelGuide. Hotels, currently the biggest investment sector of the HRI market, are expected to continue tothrive and this will provide export opportunities for U.S. producers. Hotels, restaurants and institutions seek to reduce operational costs by buying processed foodsand ready-made meals which minimize labor costs. Consumers’ healthy lifestyle trends have changed not only restaurant and hotel operators, butalso the institutional food services. A nutritional labeling law for food products was implemented in June 27, 2016. Manycompanies have responded to this law by modifying the recipes and ingredients of currentproducts, and by innovating and investing in new “healthy” products which do not requirelabels. Best prospects for sales in Chile that growth potential for U.S. agriculture and related productsare processed foods, ready-made meals, healthy and gourmet foods and beverages while U.S.pork, poultry and beef exports continue to grow and still have good sales potential.Contents2
Section I: Market Summary . 3A.Country Overview . 4B.Market Overview: Hotel Restaurant Institutional . 5C.Key demand drivers . 7D.Sales and Growth Rates. 9E.Advantages and Challenges to Entering the HRI Foodservice Market . 9F.Five Years Import Overview . 10G.Edible Fishery Products . 11Section II: Market Entry . 12A.Market Structure . 12B.Entry Strategy. 14C.Regulations and Requirements . 16D.Intermediaries . 17E.Sub-Sector Profiles . 19Section III: Competition . 26Section VI: Contact and Further Information (Tradeshows) . 34Section I: Market Summary3
A. Country OverviewChile, with a population of 17.6 million in 2017, is a centralized country both economically anddemographically. It is estimated that in and around the country’s capital, Santiago de Chile in themetropolitan region 46.5% of the GDP is produced and more than half of the population live.Population growth is slowing down (1.1% growth in 2016) and the population is aging.Economically, Chile is still the top performing country in the region of Latin America and theCaribbean, experiencing a slowdown in economic activity but with a recovery projected in 2018 and2019 thanks to improving private-sector prospects, rising copper prices and increasing consumerconfidence.Despite a slowdown in economic growth between 2011 and 2016 (from an annual real GDP growth of5.8% in 2011 to 1.6% in 2016), Chile is expected to return to a 3% growth in 2018. While this economicslowdown is particularly tied to the extractive sector, Chileans benefit from higher paying jobs in otherindustries, such that consumer spending remained steady in 2016 (2.4% real growth in spendingaccording to IMF). Consumer spending is projected to have a real growth of 3.6% following 2018.Chile has an abundance of natural resources, and although it is working towards the diversification of itseconomy, it still depends heavily on copper exports. Because of declining international copper prices,combined with an economic slowdown of Chile’s main export partner, China, Chile experienced aneconomic downfall in both 2014 and 2015. Moreover, government reforms, such as the tax reformpassed in 2014, lowered both investor and consumer confidence. Economic growth began to recover in2016 with the Central Bank of Chile recording a 1.6% increase in economic activity and a GDP of 225.0 billion. Furthermore, forecasts predict economic growth of 3% for 2018 and 3.4% up to 2021.Chileans elected Sebastian Piñera in December 2017 as their new president and his election is expectedto have a positive impact on the Chilean economic environment over the next four years. Piñera willtake office on March 11, 2018.Chile has an open economy and is very committed to trade liberalization. Currently, Chile has 26 tradeagreements with 66 economies - notably the U.S.-Chile Free Trade Agreement (FTA), which enteredinto force in 2004. As of 2015 all trade tariffs were successfully eliminated and 100% of all U.S.exports enter Chile duty-free. Chilean exports reach markets that represent 86.3% of the global GDPwith privileged tariff conditions.The Chilean Central Bank reported a net trade balance of 5.3 billion in 2016, a 51.7% increase over2015 (and a 101.5% increase over 2012). Exports fell 17% in 2015 and 3% in 2016, which can beattributed to a decrease of mining exports (by 19% in 2015 and 7% in 2016) and considering that copperaccounts for more than 90% of all Chilean mining exports. This drop is a result of a decline in demandfrom China, which led to a drop in copper prices ( 3.74 /pound in January 2013 to 2/pound in January2016). Imports decreased by 6% in 2016, reaching 58.8 billion CIF) and have decreased by 0.5% fromJanuary- October 2017 over the same period in 2016. Exports increased by 13% in Jan- Oct 2017 over2016 which can be attributed to the manufacture and mining sectors. Inflation has not affected Chile,and while it was 3.8% in 2016, it is expected to fall to 2.8% in 2017, and to stabilize around the target of3% by 2021.4
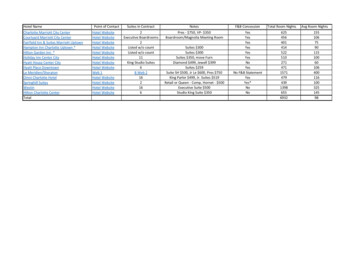
The general long-term consumer trends in Chile continue to prevail: between 2010 and 2016, GDP percapita in current prices grew by 7.2% and reached 13,793 in 2016 (World Bank). This is the highestlevel of income in the Latin American region and is one of the main drivers for consumer spending.Consumption is seen as a “reward”, demonstrated through increasing numbers of people spending theirfree time in shopping malls. Moreover, due to the openness of the economy, foreign products areavailable at competitive prices. However, as a result of the economic slowdown, Chilean consumers areincreasingly price sensitive. As such, Chileans are seeking discounted prices, purchasing less often orswitching to low priced products. Consumer spending per capita fell from 9,798 in 2013 to 8,470 in2015, but increased to 8,600 in 2016, and it is expected to rise to 9,712 up to 2021.According to Euromonitor, per capita consumer expenditure on food and beverages was 1,572 in 2011,decreasing to 1,531 in 2016 is predicted to rise to 1,668 by 2021. Since food and drink are essential,spending in this category is relatively constant and does not fluctuate as much as for non-essentialproducts.Table 1: Chile rankings by different sourcesRanking byRatingS&P 2017A (stable)Fitch 2016A (outlook negative)Moody’s 2017Aa3 (Stable)Global Competitiveness Index4.64 Score (Rank 33 out of 138)2016-2017Doing Business Rank 201757 out of 190B. Market Overview: Hotel Restaurant InstitutionalMarket OverviewThe HRI food service sector shows good potential for sales. The size of the middle class in Chile continuesto expand along with average income. New lifestyle trends, such as more women in the workplace andhealthier lifestyles are leading to rapid growth in consumer food service, a trend which is expected tocontinue over the next few years. Hotels, currently the biggest investment sector of the HRI market, areexpected to continue to thrive and this will provide export opportunities for U.S. producers. New chains andinternational restaurants open each year. Subcontracted food service operators in the institutional sector areconstantly growing, with providers developing products to suit each sub-sector.As Chilean consumers look for more varieties, they will turn towards foreign brands. U.S. products areregarded for their high quality, reliability, and innovation.Foodservice is expected to grow through the increase of travel, tourism and retail outlets/channels. Thegrowth of the foodservice sector was 3.6% in 2016 (value in constant prices). In 2017, a growth of4.6% is expected, and in the period from 2016 to 2022, an increase of 25.3% is forecasted.5
In 2016, the growth of food outlets was 3%, increasing from 14.893 outlets in 2015 to 15,335 units in2016. A growth rate of 3% is also expected for 2017.Within the food service, independent outlets were the best performers in 2016 with a growth of 4%,whereas chain food service outlets decreased by 2%. Foodservice outlet growth is expected to grow by4% in 2017. Coffee houses (cafés) grew by 5.4% from 2011-2016 (constant 2016 prices) and fast foodfoodservice by 2.6% in the same period. In 2016 to 2021 projected growth rates are 5.6% for coffeehouses and 6.6% for fast food foodservice.The Chilean HRI sector is described below:HotelsThe overall hotel sector grew by 16% in 2015. While hotels still represent the greatest proportion oftotal value of sales (72%) in the accommodation sector, short-term rentals are growing rapidly. In 2015,short-term rentals doubled in the number of outlets present, increasing by 123.8% compared to theprevious year. Hotel sales are expected to grow by 16% in sales from 2015 to 2020. As more and morepeople book accommodations online, not only will direct hotel sales increase but also those ofintermediaries. These include websites that offer price comparisons or the “best deals”, this groupexperienced strong growth of 15% in 2016.Aside from the rise of web-based platforms such as Airbnb, which offer short-term rentals, eco- friendlyhotels and boutique hotels are also having a larger presence within the industry.RestaurantsIn 2016, there were 15,335 food service outlets in Chile, which represents a 6.7% increase over 2015.Independent restaurants do not only hold more outlets than chain restaurants but also grew faster interms of new openings per year. Moreover, tourism is a strong contributor to growth of consumerfoodservices. Despite a general slowdown in economic activity, food service growth is strong andconsumers have not changed the frequency in which they eat out, however they are spending lessamount of money on each occasion and opting for cheaper options.Food delivery services increased in importance, not only in the fast food sector, but for healthieroptions. Delivery services provide a solution to the increasingly busy lifestyles that Chileans areleading as well as to the lack of motivation and knowledge required to prepare healthy meals.Furthermore, coffee shops show strong growth as well as juice and smoothie bars.InstitutionsThe two largest sectors for the institutional food service industry are the mining and education sectors.In 2014, the number of educational institutions of all levels reached a total of 16,372 establishments6
(Ministry of Education).The three main institutional service companies are Sodexo Chile, S.A., Central de RestaurantesAramark, and Compass Catering, S.A., led by Aramark. Aside from the large players, many smallernational companies serve the market. The smaller companies will often supply a few schools orcompanies and guarantee a direct and personal contact to their clients as well as flexibility, clienttailored and individual solutions.Canal Horeca magazine reports that the main players in the sector are incorporating the health trend intotheir offerings by offering healthy menus, transparent nutritional information and adapting to changingdemands. The smaller companies also adapt their menus both by shifting towards higher qualityingredients as well as by offering healthier menu options.C. Key demand driversThe following drivers and trends have been identified as boosting demand within the HRI sector:Low-Cost RestaurantsEconomic slowdown led consumers to seek for lower cost restaurants, which resulted in an increase inthe fast food sector. Fast food restaurants are constantly innovating and developing their offerings tofurther attract consumers such as offering higher quality prepared food.Unemployment rate of 6.6% in 2016 has not modified the frequency in which Chileans eat out, butrather the amount of money spent per meal, which has increased demand for low-cost restaurants.Health TrendHealthy consumption trends continue to grow, as stated by the Chilean food journal Canal Horeca. Ithas changed not only restaurant and hotel operators, but also the institutional food service, wherecompanies aim to deliver healthy foodservice. Low-cost restaurants also started to include healthieroptions in their menus as a premium, more expensive option. New companies are trying to satisfy ademand for healthy, but fast food service, i.e. catering office workers located in business areas.Furthermore, the health trend is driving demand for homemade and local food.Nutritional Labeling LawA nutritional labeling law for food products was implemented in June 27, 2016. According to AmericaRetail, 36.5% of Chileans have adapted their selection and purchase of food as a direct result of theregulation. Many companies have responded to the nutritional labeling law by modifying the recipesand ingredients of current products, and by innovating and investing in new “healthy” products whichdo not require labels.Local Foodservice7
Independent outlets still dominated the market in 2016, having increased by 4% to reach 12,961 venues,whereas chain restaurants decreased by 2.3%, totaling 2,374.TourismFood services in the hotel and restaurant sector have benefitted from the steady increase of tourism. In2016, the number of tourist arrivals staying in accommodation establishments increased by 3.1%.Moreover, shopping centers frequently visited by tourists, especially Argentinians, positively impactsales in food courts in Chile.E-Commerce:E-commerce in Chile is expected to grow 14% annually through to 2020 (BMI). The number ofsmartphone users in Chile is very high, and smartphone coverage level in Chile has reached 70% of thepopulation. By 2020, it is expected to reach 78%. These coverage levels of smartphones and internetaccess are amongst the highest in Latin America and provide a strong potential for e-commerce. Theentry of DHL e-Commerce in 2017 exceeded expectations as consumers turned to online shopping. Thistrend is also apparent in the food industry. In 2016, 0.6% of total sales in the foodservice sector wereordered online. Despite accounting for a small proportion of overall sales, intermediaries that offeronline delivery services for various types of cuisines and restaurants are growing.U.S.-Chile Trade Relations:According to the U.S. Census Bureau U.S. exports of goods to Chile were 12.9 billion in 2016, andimports of Chilean products and services reached 8.8 billion in the same period, creating a U.S tradesurplus of 4.1 billion.Since the implementation of the U.S. - Chile free trade agreement, in 2004, the value of U.S. exportssoared increasing seven fold, and the U.S. market share more than doubled from 7% in 2004 to 17% in2017.U.S. exports of agricultural & related products reached 840.5 million from January through October2017, which represents a 16% increase over the same period in 2016. Consumer oriented products havegrown by 40.6% in the same period reaching 600 million. The top U.S. agricultural export productsare beer, poultry, feed (corn gluten meal), pork and dairy (cream cheese and skim dry milk). In 2016,U.S. exports of agricultural and related products reached a total of 881.6 million.Reputation of U.S. products in Chile:The worldwide Made-In-Country Index 2017 shows that 83% of respondents from Chile perceivedproducts made in the U.S. as “slightly positive” or “very positive”. The survey indicates that U.S.products have the strongest reputation in Chile, followed by German products. According to Chilean8
importers U.S. food products are known to be more expensive and of higher quality than otherequivalent products from other sources.D. Sales and Growth RatesPrivate consumption (in real terms) rose by 2.6% in 2016 and 3.6% in 2017 and the positive trend isexpected to continue. Moreover, consumer confidence is increasing after a record low in August of2016 and is predicted to remain at around 40 points, whilst the unemployment rate remains steady at6.8%. These developments are positive for the food service industry, such that the outlook for theChilean hotel, restaurant, and institutional food service sector is encouraging.Consumer expenditure per capita totaled 8,600 in 2016. This figure is expected to increase by 1.5% inreal terms in 2017. Annual spending on food reached 1,147 per capita in 2015, marking an increase of14.2% in real terms from 2010 to 2015. Growth can be attributed to rising incomes and changes ineating habits towards increased consumption of dairy products, processed foods and a tendency to eatout more frequently.According to data from the World Bank on 2016 household final consumption expenditure per capita(constant 2010 US ), Chileans spent a higher amount compared to their neighboring countries (Chile: 9,156, Argentina: 6,946, Peru: 3,881, Bolivia: 1,503), but less than a third than households fromthe U.S. ( 35,526).In 2016, gross national income (GNI) per capita stood at 23,270 (purchasing power parity at currentinternational prices) and between 2010 and 2015 disposable income in Chile grew by 25.3%, reaching 8,964 in 2015. This increase in income levels has influenced consumer choices and lifestyles.E. Advantages and Challenges to Entering the HRI Foodservice MarketAdvantagesOne of the highest credit ratings in LatinChallengesDomestic market is limited: Chile’s population is 18.49
America, with a high per capita income.Consumption (especially on nonnecessities) increases.Strong demand for processed and readymade food in the hotel sector.Areas beyond the country’s capital,Santiago, are becoming more popular,and scope for expansion in these regionsand cities remains strong.The fast growing tourism industry offersnew clients and opportunities forfoodservice.Possibility to export directly torestaurants and hotels which requirehigh volumes of products.New Food Labeling Law: Manycompanies have adapted their recipes inorder to avoid the labels and others areworking on innovations and newproducts to meet the demand forhealthier foods.Snacks and confectionary that do notcarry warning labels as well as valueadded products across categories aregrowth categories for exporters to Chile.U.S. suppliers and products are able tomeet the growing demand for gourmetand premium products, healthierproducts, and convenient food.Demand for premium coffee varietiesincreases and U.S. style coffee shops areincreasingly prevalent in Chile.million in 2017.Due to its open market, Chileans are price sensitive,especially during economic slowdowns.Due to Chile’s geography long distances have to becovered for distribution.Many hotels purchase individually and do not combineto increase purchasing volume such that it is notattractive for U.S. companies to export directly.However, some hotels report to combine theirpurchasing efforts in order to be able to import directlyand to avoid commissions to intermediaries.U.S. products and brands face strong competition fromEurope. Certain European nations are renowned for theirgourmet or high-quality products such as French cheese,Spanish meats and Italian pastas, etc.Domestic competition is rising in consumer orientedproduct categories, as Chilean companies increasinglyaim to produce value-added products.New Labeling Law: Imposes barriers to importation dueto required extra packaging and labeling.U.S. exporters seeking to access the Chilean HRI marketshould identify an importer that specializes in distributingto this sector and be prepared to offer small quantities ofproducts or mixed containers.F. Five Years Import OverviewChile’s food industry is based on its plentiful agricultural resources such that Chilean imports of food(consisting of meat, food, and drinks valued at 2.2 billion in 2016, CIF) were largely surpassed by thevolume of Chilean food exports (consisting of agriculture, forestry, fishery and other food valued at 14billion, FOB). The Chilean Central Bank records that the agricultural sector, which includes forest andfishery products, contributes 3.5% to Chile’s overall GDP (compared to mining, which accounts for10.3% of overall GDP) in 2016. However, this relatively small figure only considers primaryagricultural products. Considering the processing industries related to agriculture leads to an 11%10
contribution to GDP. Although overall imports from the U.S. fell by 12.4% in 2016, 18% of Chile’simports still come from the U.S., which makes the U.S. Chile’s second biggest import origin, afterChina. Since 2011 food imports to Chile have increased by 15.1%, from 1.9 billion to 2.2 billion in2016.Table 2: Chile food and beverage importsFood and Beverage Imports CIFYear(billion 05520111.913% of overallimports3.743.463.142.832.512.56Variation % (year overyear)1.92-5.391.689.327.40-Source: Chilean Central BankData from the Chilean Central Bank shows that exports of agricultural products and food have increasedby 12.22 % since 2011, from 12.5 billion in 2011 to 14.1 billion in 2016.Table 3: Chile Agricultural, forestry and fishery exportsAgricultural, Forestry and Fishery ExportsYearFOB (billion 1212.532201112.530% of overallexports23.2021.2919.8718.0916.0515.39% change (yearby year)6.21-11.337.4910.830.02-Source: Chilean Central BankG.Edible Fishery ProductsAs the second largest producer of salmon in the world after Norway, Chile has a strong aquacultureindustry. Therefore, Chile only imports only small volumes of fishery products. In 2016, fish andrelated exports reached 3.9 billion of which 31% were exported to the United States, making the U.S.the main export destination for Chilean fishery products, which mostly consist of Atlantic salmon.In the HRI sector, the best prospects for edible fishery products are for gourmet products and for thosenot available in the domestic market, such as shrimps. 47% of imports are (Ecuadorian) shrimps,11
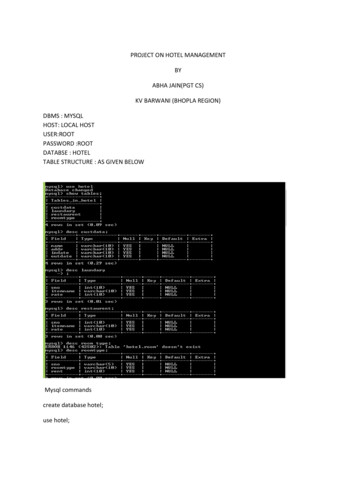
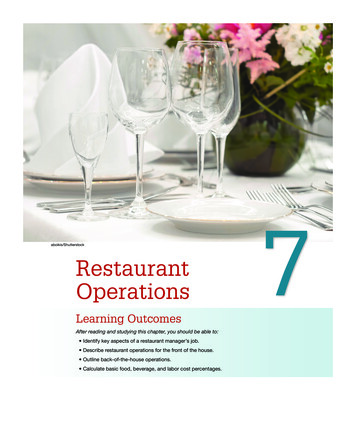
followed by pangasius fillet with 8.9%, and tuna with for 3.3% of imports. 41% of all imported fisheryproducts come from China, 31% from Ecuador, and 14% from Vietnam. Asian fish products are oftenconsiderably cheaper than from other markets. Proportionally, premium products dominate fisheryimports but due to their pricing, demand and import volumes are low. Almost all fish products arefrozen in order to guarantee quality and safety. Frozen fish benefits from longer shelf lives and tend tocome in convenient, pre-cut portions.Section II: Market EntryA.Market StructureThe following diagram portrays how food products are supplied by the U.S. exporter to the various foodservice sub-sectors (based on information from interviews):12
Adapted FormUS SupplierLocal Producer(Unprocessed)Local stributors/Local ketsCatererInstitutionssales channels for US Supplierbuying channels for Hotelsbuying channels for Restaurantsbuying channels for Institutionsmain channeloccasionallyThe HRI sector typically does not import products directly. Instead, they purchase the products fromlocal distributors or from wholesalers. Therefore, the best entry method for U.S. companies is to supplydirectly to local distributors, agents or wholesalers who will then distribute among the HRI industry.International hotels may have their own distribution network arranged by the company headquarters.According to post sources, hotel in Chile brands do not have a centralized supply chain as each hotel hasan independent purchasing department.13
B. Entry StrategyThe Office of Agricultural Affairs in Santiago, Chile advises U.S. producers to check that their productsmeet the most up to date Chilean regulations to ensure a straightforward entry strategy into this market.U.S. suppliers will have to consider their market entry strategy. FAS Santiago maintains listings ofpotential importers and develops sector-specific information to help you introduce your product inChile.Overall, exporters tend to enter the market either through wholesales, via a distributor, or directly to thebuyer (see graph above).Market access for imported products: IntermediariesThe most common way for hotels, restaurants and institutions to purchase products is usually throughintermediaries such as distributors, importers, or local representatives including caterers or wholesalers.According to interviews, most hotels and restaurants use domestic distributors. Most of these firms arebased in the capital, Santiago. Supermarkets and restaurants which purchase big volumes of foodproducts are seeking to import directly. The trend towards direct imports is driven by the search forlower prices (avoiding intermediary costs) while also maintaining high and constant quality. Distributorcommissions range between 5% and 10% depending on the product.U.S. exporters seeking to access the Chilean HRI market should identify an importer that specializes indistributing to this sector and be prepared to offer small quantities of products or mixed containers. Chileanimporters typically import mixed containers and offer a range of products. HRI companies often deal withmultiple importers in order to get the desired range of imported foods.HotelsHotels prefer to purchase their products from distributors, mainly because they offer a vast array ofproducts and import costs and procedures are avoided (i.e. obtaining license to import liquor). Althoughhotels may prefer to import some products directly in some cases to avoid intermediary costs or obtainspecific products, many barriers arise such as: the risk that the products may not arrive on time or at all,the need for insurance, a lack of storage capacity to be able to import large quantities, and the need tohire additional personnel to manage and guarantee the quality of the products. According to postsources, overall, the lower prices achieved via direct importation do not make up for the additional costsand time.Some products unavailable through distributors, which are mostly luxury products, are importeddirectly. For example, luxury hotels import certain types of liquor directly as they are not foundelsewhere in the domestic market.Raw materials and basic ingredients are purchased from local producers either directly, in order toreduce commission costs, or via a distributor. For finished or processed products, hotels prefer topurchase from the official distributor or representative of that producer in order to have consistency ofsupply and quality.14
Supermarkets are not typically part of the supply chain, however, when an ingredient is urgentlymissing in small quantities both hotels and restaurants would purchase from supermarkets as a lastresort.Distributors offer a variety of high quality products reducing management efforts to the HRI industry.Depending on their clients, hotels may prefer to have as few distributors as possible to further reducecomplexity, especially when not catering for high-end clients.Distributors mostly del
Dec 22, 2017 · Chile offers excellent opport unities for U.S. food exports. Chile’s economy is ranked as a high-income economy by the World Bank and is considered South America’s most stable and prosperous nation in Latin America and the Caribbean, and Lonely Planet Travel Guide selected Chile