Transcription
Turnout for the 11 October and 8 November 2005 Elections1NATIONAL ELECTIONS COMMISSION30 November 2005
Summary 74.9% turnout for 11 October 2005 election 61.0% turnout for 8 November 2005 election Nearly 80% of the registered voters participated in at least one of the 2005 elections–––– Similar turnout among females and males overall–– ––Turnout was significantly higher in urban precincts in both elections with a larger difference (18.6%) in the 8 November election than the 11 Octoberelection (7.5%)Turnout decreased more substantially in the 311 “Difficult Access” precincts than the 273 “Inaccessible” precinctsIDP–– Turnout was higher among registered voters identified as likely literate with a more substantial difference (15.0% vs 5.5%) in the 8 November electionLiterate females had the highest turnout in both electionsUrban/Rural Categorization of Precinct– Highest turnout generally among 38-57 year oldsLowest turnout experienced in youngest age groups (18-22) with nearly as low turnout in oldest age group (68 )In 11 October election, slightly higher turnout among younger females than males but significantly higher turnout among males for registered voters 58 In 8 November election, turnout similar among females and males age 37 and younger. For ages 38 and above, male turnout consistently higher thanfemale turnoutYounger males (18-37) more frequently did not participate in either election than younger females; older females (58 ) more frequently did notparticipate than older malesLiteracy–– Female turnout may have been slightly higher (0.9%) than male turnout in 11 October electionMale turnout slightly higher (2.0%) than female turnout in 8 November runoffDifferences by age of voters–––– 52.1% voted in both20.2% voted only in the 11 October election7.1% voted only in the 8 November electionOnly 20.6% did not participate in either electionIDP turnout significantly lower than national average in 11 October election but higher than national average in 8 November runoff.IDPs registered for county of origin voted approximately half of the time in county of origin and half in the special IDP polling places provided in the IDPCamps.Please see important notes regarding methodology and data in Appendix2NATIONAL ELECTIONS COMMISSION30 November 2005
Registered Voters and Turnout for 2005 egistered Voters11 October 2005Turnout8 November 2005TurnoutSource:3NATIONAL ELECTIONS COMMISSION30 November 2005
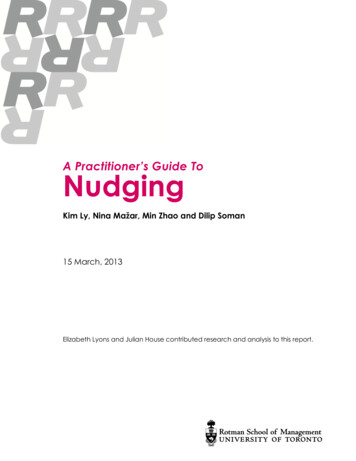
Registered Voter Turnout Across Both 2005 ElectionsTurnout of Registered VotersVoted in NeitherElection20.6%Voted in 8 NovemberElection Only7.1%Voted in BothElections52.1%Voted in 11 OctoberElection Only20.2%Nearly 80% of the registered voters participated in at least one of the 2005elections.Source: Random sample of voter rolls accounting forapproximately 11% of registered voters. See Appendix fordetails.4NATIONAL ELECTIONS COMMISSION30 November 2005
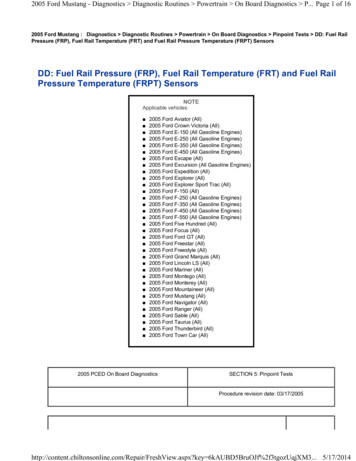
Turnout by Gender100%90%80%Fem ales72.8%Males71.9%70%Fem ales58.2%60%Males60.2%50%40%30%20%10%0%11 October ElectionSee notes in Appendix for possibleexplanations on why sampleturnout was slightly lower thanelection reported turnout.8 November Runoff ElectionSlightly higher (0.9%) turnout among females in 11 October election but 2.0%higher turnout among males in 8 November runoff.Source: Random sample of voter rolls accounting forapproximately 11% of registered voters. See Appendix fordetails.5NATIONAL ELECTIONS COMMISSION30 November 2005
Turnout by Gender Across Both 2005 ElectionsFemalesMalesVoted in NeitherElection19.6%Voted in NeitherElection21.5%Voted in 8 NovemberElection Only7.6%Voted in BothElections50.7%Voted in 8 NovemberElection Only6.6%Voted in 11 OctoberElection Only22.1%Voted in BothElections53.6%Voted in 11 OctoberElection Only18.3%Suggests females participated slightly more than males in at least one of the elections (80.4% vs.78.5%). Males voted in both elections more frequently than females. More females than malesvoted in only the runoff but a higher portion of females chose to vote in only the first election.Source: Random sample of voter rolls accounting forapproximately 11% of registered voters. See Appendix fordetails.6NATIONAL ELECTIONS COMMISSION30 November 2005
Turnout by AgeTurnout by 3-5758-6263-6768 Age GroupTurnout lowest among the youngest and oldest voters. Consistent 10-14% decrease in turnoutacross age groups from 11 October to 8 November election.Source: Random sample of voter rolls accounting forapproximately 11% of registered voters. See Appendix fordetails.7NATIONAL ELECTIONS COMMISSION30 November 2005
Turnout by Age Across Both ElectionsTurnout Across 2005 Elections by AgeVoted Both Elections11 Oct Only70%8 Nov OnlyNeither 33-3738-4243-4748-5253-5758-6263-6768 Age GroupParticipation in only one election was relatively constant with age. Participation in both or neitherelection varies with age with youngest and oldest least likely to vote in either election.Source: Random sample of voter rolls accounting forapproximately 11% of registered voters. See Appendix fordetails.8NATIONAL ELECTIONS COMMISSION30 November 2005
Turnout by Age and GenderTurnout by Gender and AgeFemale 11-OctFemale 8-Nov100%Male 11-Oct90%Male -3233-3738-4243-4748-5253-5758-6263-6768 Age GroupTurnout in 11 October election similar between males and females until age 58 where femaleturnout dropped. In runoff, male and female turnout similar until 38 where male turnoutcontinued to rise slightly with age but female turnout remained flat or declining with age.Source: Random sample of voter rolls accounting forapproximately 11% of registered voters. See Appendix fordetails.9NATIONAL ELECTIONS COMMISSION30 November 2005
Turnout by Age and Gender Across Both ElectionsFemalesMalesFemale Turnout Across 2005 Elections by Age11 Oct Only8 Nov OnlyNeither ElectionVoted Both ed Both ElectionsMale Turnout Across 2005 Elections by Age30%8 Nov OnlyNeither Election30%20%20%10%10%0%11 Oct 263-6768 18-22Age GroupSource: Random sample of voter rolls accounting forapproximately 11% of registered voters. See Appendix 263-6768 Age Group10NATIONAL ELECTIONS COMMISSION30 November 2005
Turnout by Age and Gender Across Both ElectionsPercent of Registered Voters Voting Only in the 11 October Election by Gender andAgePercent of Registered Voters Voting in Both Elections by Gender and AgeFemalesMales70%60%60%Percent of Registered VotersPercent of Registered 18-2268 23-2728-3233-3738-4248-5253-5758-6263-6768 58-6263-6768 Percent of Registered Voters Voting in Neither ElectionPercent of Registered Voters Voting Only in the 8 November Election by Gender andAgeFemales43-47Age GroupAge GroupFemalesMales70%70%60%60%Percent of Registered VotersPercent of Registered 18-2223-2728-3233-37Source: Random sample of voter rolls accounting forapproximately 11% of registered voters. See Appendix fordetails.38-4243-4748-5253-5758-6263-6718-2268 23-2728-3233-3738-4243-4748-5253-57Age GroupAge Group11NATIONAL ELECTIONS COMMISSION30 November 2005
Turnout by County11-OctTurnout as Percent of Registered of er GeeRiver CessNimbaMontserradoMarylandMargibiLofaGrand KruGrand GedehGrand Cape MountGrand BassaGbarpoluBongBomi0%Note: Figures do not include voters at “Special IDP Polling Places”. Turnout at these polling places was34.6% (11-Oct) and 34.1% (8-Nov). Note that this is not IDP turnout.Source: 2005 election results.12NATIONAL ELECTIONS COMMISSION30 November 2005
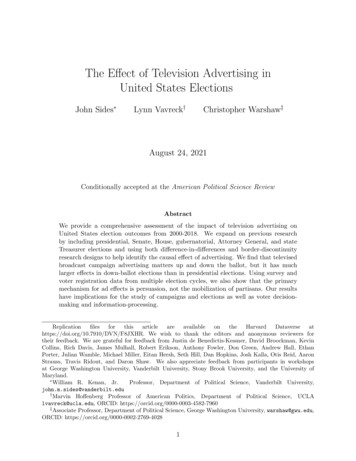
Turnout by County11 October 2005 Turnout8 November 2005 TurnoutLofa54,004 voters62.0%Lofa46,154 voters53.0%Gbarpolu12,621 voters56.1%Gbarpolu15,063 voters66.9%Grand Cape Mount26,916 voters72.1%Bomi28,272 voters73.4%Grand Cape Mount19,198 voters51.4%Bong109,870 voters72.2%Bomi24,050 voters62.4%Nimba141,635 voters74.4%Margibi71,444 voters71.2%Bong78,784 voters51.3%Nimba100,126 voters52.6%Margibi58,169 voters57.8%Grand Gedeh22,783 voters71.8%Montserrado381,705 voters78.8%Grand Bassa69,161 voters68.3%Montserrado354,360 voters72.9%Grand Gedeh23,403 voters73.8%River Cess12,582 voters66.9%Grand Bassa45,423 voters44.8%River Cess8,094 voters43.0%8 November 2005 Turnout40-45%11 October 2005 Turnout45-50%50-55%River Gee9,327 voters42.4%45-50%40-45%Sinoe20,165 voters71.8%River Gee15,901 voters72.3%50-55%55-60%Sinoe14,889 80%70-75%75-80%Grand Kru14,570 voters77.1%Maryland27,982 voters71.7%Grand Kru9,905 voters52.4%Maryland21,833 voters56.0%Note: Figures do not include voters at “Special IDP Polling Places”. Turnout at these polling places was34.6% (11-Oct) and 34.1% (8-Nov). Note that this is not IDP turnout.Source: 2005 election results.13NATIONAL ELECTIONS COMMISSION30 November 2005
8 November Turnout as Percent of 11 October Turnout by County8 November Turnout as Percent of 11 October 8%70.7%Grand Cape 0.7%Margibi81.2%40%30%Montserrado92.5%Grand Gedeh97.4%Grand Bassa65.5%20%10%River Cess64.3%SinoeRiver GeeRiver CessNimbaMontserradoMarylandMargibiLofaGrand KruGrand GedehGrand Cape MountGrand BassaGbarpoluBongBomi0%Runoff Turnout as Percent of 11-Oct Turnout55-60%River -90%Grand Kru68.0%Maryland78.0%90-95%95-100%Turnout for 8 November runoff election was 81.4% of 11 October election.Note: Figures do not include voters at “Special IDP Polling Places”. 8-Nov turnout at these polling placeswas 98.6% of 11-Oct turnout.Source: 2005 election results.14NATIONAL ELECTIONS COMMISSION30 November 2005
Turnout by County Across Both ElectionsTurnout by CountyVoted Both Elections11 Oct Only8 Nov OnlyNeither 22.1%29.7%17.7%25.9%Percent of Registered 2%44.0%44.3%35.6%27.6%26.5%10%Source: Random sample of voter rolls accounting forapproximately 11% of registered voters. See Appendix fordetails.Special IDPPolling PlacesSinoeRiver GeeRiver CessNimbaMontserradoMarylandMargibiLofaGrand KruGrand GedehGrand CapeMountGrand BassaGbarpoluBongBomi0%15NATIONAL ELECTIONS COMMISSION30 November 2005
Turnout by County and Gender – 11 October11 October 2005 Turnout by County and 66.5%74.1%35.9%50%40%30%30.4%Percent of Registered Voters80%72.8%90%75.2%Female20%10%Special IDPPolling Places*Sinoe*River Gee*River CessNimbaMontserrado*MarylandMargibiLofa*Grand KruGrand Gedeh*Grand CapeMount*Grand BassaGbarpoluBomiBong0%* Difference statistically significant at 98%confidence level.In 4 counties (plus Special IDP Polling Places), female turnout for 11 October election significantlyexceeded male turnout. In 2 counties male turnout significantly exceeded female turnout. In 9 counties thedifference between male and female turnout was statistically insignificant.Source: Random sample of voter rolls accounting forapproximately 11% of registered voters. See Appendix fordetails.16NATIONAL ELECTIONS COMMISSION30 November 2005
Turnout by County and Gender – 8 November8 November 2005 Turnout by County and %40.9%43.9%60%49.6%63.0%70%60.8%Percent of Registered Voters80%70.2%75.2%90%30%20%10%Special IDPPolling Places*SinoeRiver GeeRiver Cess*Nimba*MontserradoMarylandMargibiLofa*Grand KruGrand GedehGrand CapeMount*Grand Bassa*Gbarpolu*BomiBong*0%* Difference statistically significant at 98%confidence level.Female turnout for 8 November election significantly exceeded male turnout only in the Special IDP PollingPlaces. In 7 counties male turnout significantly exceeded female turnout. In 8 counties the differencebetween male and female turnout was statistically insignificant.Source: Random sample of voter rolls accounting forapproximately 11% of registered voters. See Appendix fordetails.17NATIONAL ELECTIONS COMMISSION30 November 2005
Turnout by County and Gender for Both ElectionsTurnout by County and GenderFemale 11 OctMale 11 Oct100%Female 8 NovMale 8 Nov90%Percent of Registered Voters80%70%60%50%40%30%20%10%Special IDPPolling PlacesSinoeRiver GeeRiver CessNimbaMontserradoMarylandMargibiLofaGrand KruGrand GedehGrand CapeMountGrand BassaGbarpoluBongBomi0%With exception of Grand Gedeh, Lofa, Montserrado, and Special IDP Polling Places, turnout fell statisticallysignificant amount among both females and males between 11 October and 8 November election.Source: Random sample of voter rolls accounting forapproximately 11% of registered voters. See Appendix fordetails.18NATIONAL ELECTIONS COMMISSION30 November 2005
Turnout and urban/rural precinctsTurnout by Urban/Rural Categorization* of ban70.7%Percent of Registered Voters70%60%Rural52.1%50%40%30%20%10%* Categorization of precincts as in Urban orRural location approximated by NEC staff.277 of precincts categorized as Urban and1144 categorized as Rural.0%11 October Election8 Novem ber ElectionUrban turnout significantly higher in both elections. Decrease in turnout from 11 October to 8 Novemberelection significantly greater in rural precincts (-17.5%) vs. urban precincts (-6.7%)Source: 2005 election results.19NATIONAL ELECTIONS COMMISSION30 November 2005
Turnout by gender and urban/rural location of precinctFemale Turnout and Location of Precinct100%Fem ales - UrbanMale Turnout and Location of Precinct100%Fem ales - RuralMales - Rural90%90%80%Males - Urban80%76.1%73.2%Percent of Registered Voters70%69.5%68.6%70%60%48.5%50%40%30%Percent of Registered 1 October Election11 October Election8 Novem ber Election8 Novem ber Election* Categorization of precincts as in Urban orRural location approximated by NEC staff.277 of precincts categorized as Urban and1144 categorized as Rural.Source: Random sample of voter rolls accounting forapproximately 11% of registered voters. See Appendix fordetails.20NATIONAL ELECTIONS COMMISSION30 November 2005
Turnout by accessibilityTurnout by Accessibility of Precinct100%Easily AccesibleDifficult AccessInaccessible90%80%73.0%Percent of Registered 0%0%11 October Election8 Novem ber ElectionTurnout in 11 October election was similar for both “Easily Accessible” and “Difficult Access” precincts butturnout dropped the most significantly (-22.0%) for the “Difficult Access” precincts between elections.Source: 2005 election results.21NATIONAL ELECTIONS COMMISSION30 November 2005
Turnout and Literacy*Turnout by Literacy100%LiterateIlliterate90%80%Percent of Registered Voters70%* Literacy of voter from previous samplingwhere registered voters were classified aslikely literate if the registration form wassigned and classified as illiterate if markedby finger print. Study found 45% literacyrate among registered %Illiterate50.7%50%40%30%20%10%0%11 October Election8 Novem ber ElectionLiterate registered voters participated significantly more than illiterate voters. Decrease inturnout for 8 November election substantially greater among illiterate registered voters (17.6%decrease vs. 8.1% decrease).Source: Random sample of voter rolls accounting forapproximately 11% of registered voters. See Appendix fordetails. Sample size for literacy statistics is approximately 7,000resulting in confidence interval of /- 1.5-2.2%22NATIONAL ELECTIONS COMMISSION30 November 2005
Turnout by Gender and Literacy*Female Turnout and Literacy100%Literate Fem alesMale Turnout and Literacy100%Illiterate Fem ales90%80%Literate MalesIlliterate ent of Registered VotersPercent of Registered 67.0%0%11 October Election8 Novem ber Election11 October Election8 Novem ber ElectionLiterate females had highest turnout in both elections while turnout among illiterate females hadlargest decline (18.5%) between elections.* Literacy of voter from previous sampling where registeredSource: Random sample of voter rolls accounting forapproximately 11% of registered voters. See Appendix fordetails. Sample size for literacy statistics is approximately 7,000resulting in confidence interval of /- 1.5-2.2%voters were classified as literate if the registration form wassigned and classified as illiterate if marked by finger print.Study found 45% literacy rate among registered voters.23NATIONAL ELECTIONS COMMISSION30 November 2005
Turnout by Literacy* and GenderTurnout by Gender and LiteracyTurnout by LiteracyBoth Elections11-Oct OnlyBoth Elections8-Nov Only11-Oct Only8-Nov OnlyFem ales70%Neither19.5%80%8-Nov Only6.6%11-Oct Only14.7%60%8-Nov Only7.8%11-Oct Only25.5%50%40%30%90%Neither23.9%Both Elections59.1%Both Elections42.8%20%Percent of Registered VotersPercent of Registered eSource: Random sample of voter rolls accounting forapproximately 11% of registered voters. See Appendix fordetails. Sample size for literacy statistics is approximately 7,000resulting in confidence interval of /- 1.5-2.2%LiterateFem alesIlliterateIlliterateFem alesLiterateMalesIlliterateMales* Literacy of voter from previous sampling where registeredvoters were classified as literate if the registration form wassigned and classified as illiterate if marked by finger print.Study found 45% literacy rate among registered voters.24NATIONAL ELECTIONS COMMISSION30 November 2005
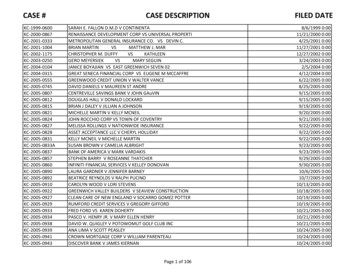
IDP TurnoutIDP nt of Registered Voters100%70%Percent of Registered VotersIDP %30%20%10%10%0%0%Source: Random sample ofvoter rolls accounting forapproximately 11% ofregistered voters. SeeAppendix for details.68.0%Turnout in Special IDP PP60%20%11 October ElectionTurnout11-Oct ElectionIDPs Registeredfor County ofOrigin8 Novem ber Election11-Oct ElectionIDPs Registeredfor IDP Cam p8-Nov Election IDPs 8-Nov Election IDPsRegistered forRegistered for IDPCounty of OriginCam pIDP turnout significantly lower than national average in 11 October election but higher thannational average in 8 November runoff. IDPs registered for county of origin voted approximatelyhalf of the time in county of origin and half in the special IDP polling places setup in the IDPcamps.NATIONAL ELECTIONS COMMISSION30 November 200525
IDP Turnout by County of Origin and Location of Voting42.6%14.3%20%34.6%Bong30%39.2%43.6%Bom 9.4%39.8%60%20.4%70%56.4%70%Percent of Registered Voters80%40%Turnout in Special IDP Polling Place in IDP Cam p90%80%50%Turnout in County of Origin Polling Place14.8%Turnout in Special IDP Polling Place in IDP Cam p90%Percent of Registered Voters100%Turnout in County of Origin Polling Place32.8%100%8 November Turnout by Location for IDPs Registered for Countyof Origin30.8%11 October Turnout by Location for IDPs Registered for Countyof Origin10%0%0%Bom iBongGbarpolu Grand CapeMountLofaMontserrado Nim baCounty of OriginIncludes only those countieswith at least 1,000 IDPregistered for as county oforigin.Source: Random sample ofvoter rolls accounting forapproximately 11% ofregistered voters. SeeAppendix for details.Gbarpolu Grand CapeMountLofaMontserrado Nim baCounty of OriginThe location of voting of IDPs registered for county of origin varies significantly depending on thecounty which the IDP registered for. In 4 out of the 7 counties with significant number ofregistered IDPs, IDPs were more likely to vote in county of origin than in the special pollingplaces provided in the IDP camps.NATIONAL ELECTIONS COMMISSION30 November 200526
Appendix27NATIONAL ELECTIONS COMMISSION30 November 2005
Methodology Turnout statistics from election results and voting history contained in randomly sampledvoter rolls used during 2005 elections The Data Center randomly selected voter rolls from 342 polling places and recorded thevoting history of approximately 150,000 registered voters–– Distribution of sampling across counties was constructed to approximate distribution of registeredvotersVoter rolls were eliminated from sample (and replaced) if polling staff did not follow procedurescorrectlyOverall turnout for sample was lower than election reported turnout––––11-October turnout was 74.9% and 72.4% in sample (2.5% difference)8-November turnout was 61.0% but 59.2% in sample (1.9% difference)Difference in turnout is within error margin expected in repetitive recording and data processing tasksSample suggests that additions to the voters roll (allowed for polling staff, police, etc.) accounted forapproximately 1.9% of 11 October and 1.1% of 8 November turnout Though efforts were made to include the additions to the voters roll in the data entry, not all additions were entereddue to poorly handwritten numbers and time constraintsIt is possible that these voter roll additions may account for a large portion of the observed difference in turnoutNote that it is also possible that the additions to FRR may partially explain a lower turnout among younger ages as itis assumed that a large portion of the additions were the (generally younger) polling staff. However, cursory reviewof the additions did not suggest significant difference in age or gender characteristics with other votersConfidence Interval–––98% confidence interval approximately /- 0.4% at national level98% confidence interval varies from /- 1.0% to /- 3.0% at county levelWarnings on small sample sizes have been included where appropriate28NATIONAL ELECTIONS COMMISSION30 November 2005
Turnout by date of registrationTurnout by Approximate Date of pr26-Apr25-Apr0%Approximate Date of RegistrationFirst people to register were more likely to vote than those that registered later in process.However, this may be more correlated with more urban registrations in beginning and ruralregistration more predominant in end of registration.Source: Random sample of voter rolls accounting forapproximately 11% of registered voters. See Appendix fordetails.29NATIONAL ELECTIONS COMMISSION30 November 2005
30 November 2005 2 Summary 74.9% turnout for 11 October 2005 election 61.0% turnout for 8 November 2005 election Nearly 80% of the registered voters participated in at least one of the 2005 elections - 52.1% voted in both - 20.2% voted only in the 11 October election - 7.1% voted only in the 8 November election