Transcription
Excerpt from / Fragmento delGLOBAL COMPETITIVENESS REPORT2003/2004By / PorWorld Economic Forumin collaboration with / con la colaboración deIESE Business Schooland the support of / y el apoyo deNissan Chair of Corporate Strategy and International BusinessAnselmo Rubiralta Center for Globalization and Business StrategyIncluding/Incluye:Executive SummaryCompetitiveness RankingsCompetitiveness SpainYou can search for the full text at / Puede buscar el texto completo ent/Global Competitiveness Programme%5CGlobal Competitiveness Report%5CGlobal Competitiveness Report 2003-2004
XAVIER SALA-I-MARTIN, Columbia University and UniversitatPompeu FabraThe fundamental objective of the Global CompetitivenessReport (GCR) is to evaluate the economic competitivenessof a large sample of countries.Traditionally, the GCR hasfocused on two complementary approaches to analyzingcompetitiveness.The first, called the Growth CompetitivenessIndex (GCI), was developed by Jeffrey D. Sachs ofColumbia University and John W. McArthur of The EarthInstitute and was presented in The Global CompetitivenessReport 2001–2002.The second index, now labeled theBusiness Competitiveness Index (BCI), was developed byMichael Porter of Harvard University and was first introduced in The Global Competitiveness Report 2000.The two indexes combine available hard data and datafrom the Executive Opinion Survey (Survey) conductedannually by the World Economic Forum (see Chapter 3.1for additional analysis of Survey results and methodology).The Survey is conducted in the first half of every year.Input is contributed exclusively by leading business executives and entrepreneurs whose current perceptions of thebusiness environment in which they work are captured intheir responses to a comprehensive and scientifically constructed questionnaire. By participating, respondents arealso provided with the opportunity to identify key obstacles to economic growth in their own countries and thuscontribute to assessing the quality of the business environment in the countries where their companies operate.This, in turn, may help precipitate an internal debatewithin the country between government officials, businessleaders, organizations of civil society and the academiccommunity on key problem areas and how best toaddress them.The Survey was carried out this year in collaborationwith 104 Partner Institutes of the World EconomicForum’s Global Competitiveness Programme. PartnerInstitutes are typically leading national research or academic institutes committed to contributing to the growthpotential of their respective economies. Under the direction of the World Economic Forum, their collaborationinvolves conducting the Survey according to commonguidelines in order to ensure that the sample of respondents is representative of the economies in question andthat the Survey method used remains consistent across allcountries.The number of countries surveyed this year increasedsignificantly, from 80 to 102.The countries added aremainly from the developing world, especially Africa.Thecoverage in that region of the world has increased from 8to 25, and now also includes Algeria, Angola, Cameroon,Chad, Egypt, Ethiopia, Gambia, Ghana, Kenya,Madagascar, Malawi, Mali, Mozambique, Senegal,Tanzania,Uganda, and Zambia. Newly added countries alsoembrace non-African nations, including Luxembourg,Macedonia, Malta, Pakistan, and Serbia.The countriesincluded in this year’s Report account for 97.8 percent ofExecutive SummaryExecutive Summary1
Executive Summary2world’s GDP. The Global Competitiveness Report2003–2004, therefore, provides comprehensive coverage ofthe global economy.The Growth Competitiveness IndexThe GCI’s main goal is to analyze the potential for theworld’s economies to attain sustained economic growthover the medium and long term.The index is based oneconomists’ current understanding of the determinants ofthe complex process of economic growth and development. It summarizes the set of institutions, policies, andstructures driving the growth process of 102 heterogeneous countries.The GCI is founded on three central ideas.The firstone is that the process of economic growth can be analyzed within three important broad categories: the macroeconomic environment, the quality of public institutions,and technology.Although it is certainly not true that macroeconomicstability alone can increase the growth rate of a nation, itis no less true that macroeconomic disarray kills its growthprospects. Informed decisions cannot be made in environments where the inflation rate is in the hundreds.Thebanking system cannot function if the government runsgigantic deficits.The government cannot provide servicesefficiently if it has to pay enormous interest rates on itspast debts. And wasted taxation hurts the business sectorunnecessarily. In sum, sustained growth is hard to achievein nonfavorable macro environments.The second pillar underlying the GCI relates to public institutions. In a market economy, wealth is ultimatelycreated by private businesses. However, these businesseshave to operate within a country and have to deal with itsinstitutions. It is important, for example, that propertyrights are guaranteed by a legal and judicial system. It ishard for private companies to operate efficiently in countries where the rule of law is nonexistent or where contracts cannot be enforced. Firms may find it too expensiveto do business where corruption is rampant.Thus, theGCI measures the soundness of the public institutions andit introduces this soundness as the second of the three pillars of economic growth and development.The third channel is technological progress. Perhapsthe main lesson of neoclassical growth theory is that theultimate source of long-run economic growth is technological progress.The reason for this is that the otherpotential determinants of growth must run into diminishing returns. For example, institutions and the macroeconomic policy can have important effects on growth incountries with terrible environments. But once institutions are more or less right, and once the macroeconomyis more or less stable, additional improvements along theselines will probably have little or no effect on economicgrowth.This is not true for technological progress: theredo not seem to be good reasons that would suggest thatthere are diminishing returns to ideas. In fact, the contrarymight be true, given that humanity seems to generate newideas at accelerating rates.The GCI uses both hard (publicly available) data anddata from the World Economic Forum’s Survey to estimate three “component indexes” that capture the threepillars of growth mentioned above.The three componentsare called the “technology index,” the “public institutionsindex,” and the “macroeconomic environment index.”Thethree components are then combined to calculate theoverall GCI.The second idea underlying the GCI is that, althoughtechnological advance is the ultimate source of growth, itsorigin may be different across countries. In particular, foreconomies that are already close to the technological frontier, innovation is the main source of technologicalimprovements. For those that are far away from the frontier, technological improvements can be achieved partlythrough innovation and partly by copying or adopting theknowledge previously developed in one of the leadingeconomies.To capture this second idea, the GCI separates thesample of countries into two groups: the “core” and the“non-core” innovators. Core innovators are thoseeconomies whose growth is largely driven by their capacity to innovate because they are close to the technologicalfrontier. “Non-core” innovators are those that dependmore on technological adoption from abroad.The threshold of 15 patents per million population was chosen toseparate the countries into these two groups. Countriesabove this threshold are defined as the core group, and allothers as non-core.To reflect the fact that innovation is more importantthan adoption for core innovators, the technology indexof the GCI puts a larger weight on innovation for thecore innovators than for the non-core innovators.Technological adoption, on the other hand, receives a positive weight for non-core countries and zero weight forcore innovators.Technological adoption is captured by thetechnology transfer subindex.The third central idea underlying the GCI is that theimportance of the determinants of economic competitiveness varies for core and non-core innovators. Getting thefundamentals right in terms of the macroeconomic environment and institutions is still extremely critical for thenon-core innovators, whereas core innovators will havethese fundamentals largely in place, and for them technological innovation has become the deciding factor forgrowth. Along these lines, the GCI assigns a larger weightto the technology index for core innovators than it doesto the public institutions index and the macroeconomic
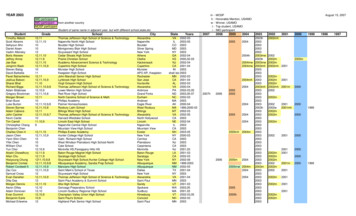
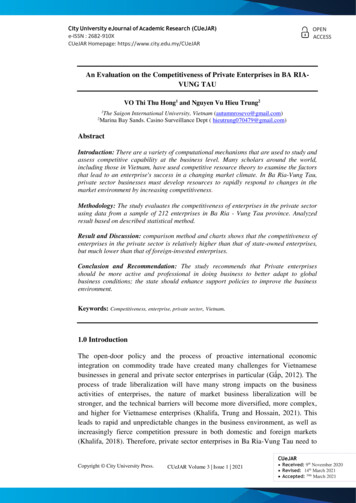
Extent of distortive government subsidies Diversion of public funds Public trust in the financial honesty of politiciansWe think that this “composite waste subindex” captures waste through government favoritism and corruption.This should account for a large part of overall government wasteful spending. Statistical analysis of thesevariables indeed showed that they have strong explanatorypower with regards to medium- to long-term growth.This solution was thus retained.The second change, lessimportant in its implications, affects the innovation component of the technology index—the details are presentedin chapter 1.1.Last year’s rankingsOf course, altering the model as described in the sectionabove necessarily has an impact on the rankings of theindex.Table 1 compares last year’s published rankings(Column 4) with those that would have been obtainedusing the current formula (Column 3).We see that therewould have been a number of differences in last year’srankings if we had made the two substitutions describedin the section above. A first notable point is that Finland,rather than the United States, would have topped therankings.This can be traced to the fact that the US government spends a relatively low percentage of GDP compared to Finland. And although US spending is not seen asparticularly wasteful, Finland’s is seen as even less so.Thecombined effect of these two forces is that Finland isranked ahead of the US once government expenditure isreplaced by government waste.Finland’s relative improvement is indicative of a moregeneral trend we see in the data: many western Europeancountries would have been higher in the rankings last yearusing the new formula.These countries have governmentsthat spend a high proportion of GDP (which was “penalized” by last year’s formula), but that, as captured by thewaste composite, are not seen as spending wastefully. Infact, all western European countries have either the sameor higher rankings following the introduction of government waste to the index: not one of them is lower following this change.The other side of the same coin is that many countries in Asia and Latin America would have had lowerranks last year if we had been using the waste variablerather than government expenditure.These are countriesthat have relatively low overall government spending,which pushed them higher in the rankings last year.However, once the wastefulness of the spending they dohave is taken into account, many of these countries do lesswell, therefore coming in lower in the rankings.Competitiveness Rankings 2003–2004Column 1 of Table 1 reports the results of this year’s 2003Growth Competitiveness Index rankings using the fullsample of 102 countries. In order to establish comparability between last year’s rankings (Column 3) and this year’s,we also report this year’s rankings when only the countriesthat participated in last year’s study are included.This isdone in Column 2.A quick comparison of Columns 2 and 3 revealsstriking similarities with last year’s top ten rankings.Thefirst four ranks are identical, with Finland in first place,followed by the United States, Sweden, and Denmark,respectively.Taiwan and Singapore maintain their rankingsrelative to each other, but both moved higher by one position, to 5th and 6th positions respectively, slidingSwitzerland from 5th position to 7th position.Norway declined by one rank to 9th place, making wayfor Iceland at 8th place. Canada, previously at 9thplace, falls off the top 10 list while Australia remains in10th position.The top two newcomers are Malta (19th) andLuxembourg (21st).The new countries from the developing world lie all at the bottom half of the table. Gambia(55th) is the highest rank newcomer, whereas Chad(101st) is the lowest. Egypt (58th) comes back to the rankings after being eliminated last year because of problems inthe data collection process.Tanzania (69th), Ghana (71st),Pakistan (73rd) and Algeria (74th) are the next highestrank newcomers, followed by Malawi (76th), Serbia(77th), Senegal (79th), Uganda (80th), Macedonia (81st),Kenya (83rd), Zambia (88th), Cameroon (91st), Ethiopia(92nd), Mozambique (93rd), Madagascar (96th), Mali(99th), and Angola (100th).Executive Summaryenvironment index. On the other hand, equal weights areassigned to these three indexes for non-core innovators.Although we have maintained the basic structure andoverall logic of the GCI as developed by Sachs andMcArthur, this year we have made one significant changeto the methodology. In the macroeconomic environmentindex, we have replaced a previously used variable, the“government expenditure as a percentage of GDP,” with acomposite subindex aimed at capturing governmentspending waste.We decided to consider governmentspending as a percentage of GDP because, implicitly, itsinclusion assumed that economic growth would be maximized at zero government expenditures.We do not thinkthat this is a good assumption, since many public expenditures are productive and contribute positively to the competitiveness of a nation.The index should capture publicwaste rather than public spending. After testing a numberof candidate variables, three were selected:3
Executive Summary4Table 1: Growth Competitiveness Index rankings and 2002 comparisonsGCI 2003 RankCountryFinlandUnited ndNorwayAustraliaJapanNetherlandsGermanyNew ZealandUnited niaSpainHong aCzech RepublicLithuaniaItalySouth AfricaSlovak RepublicChinaPolandMauritiusMexicoEl SalvadorTrinidad and TobagoUruguayCosta VietnamMoroccoDominican i LankaGCI 2002 Rank(among 2003countries)(among 6059(cont’d.)GCI 2003 RankCountryTanzaniaRussian agascarZimbabweBangladeshMaliAngolaChadHaiti(among 87888990919293949596979899100101102*Applying the 2003 FormulaSource: World Economic ForumGCI 2002 Rank(among 7371—7075———7672—7974———80
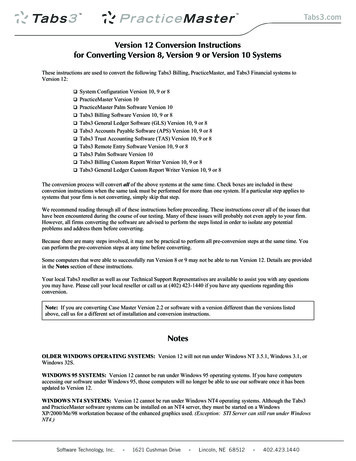
region in all three index components, the country hasexperienced notable deterioration in the area of government waste, exhibiting the worst decline in the indicatormeasuring public trust of politicians.The lowest ranking inthe region is held by Haiti, which also occupies 102ndposition in the GCI. Brazil and Argentina both posted significant declines in the macroeconomic environment.Technology offers a bright spot for both countries: tertiaryenrollment increased significantly and diffusion of ICTcontinues at a very fast pace in Brazil, while governmentprioritization of ICT and success of government ICT promotion both received higher ratings in Argentina. Amongthe countries in the region, the biggest declines in therankings were experienced by Uruguay and Jamaica.Uruguay fell due to drastic deterioration of its macroeconomic environment as evident in the region’s largestdecline in credit rating. Lower scores in the macroeconomic environment also pushed Jamaica lower in therankings. On the opposite extreme, Mexico and ElSalvador experienced the most notable improvements inperformance.In the Middle East, Jordan and Turkey both post dramatic improvements in the quality of public institutions.Jordan, in particular, showed the largest score and rankincrease in this area, driven by gains in control of corruption and greater independence of the judiciary.The country also posted better ratings relating to public trust inpoliticians, diversion of public funds, and the extent of distortive subsidies. Likewise, but to a lesser extent,Turkeyexhibited significant improvements in the control of corruption and the independence of the judiciary.In Africa, Botswana enjoys the highest ranking in theGCI. It has the highest public institutions andmacroeconomic environment rankings in the region.Botswana’s ranking in technology is lower than its rankingin other components; despite increases in ICT diffusion,significant drawbacks in technology remain. South Africaleads the region in the area of technology. However, SouthAfrica’s overall growth competitiveness ranking is muchlower than last year’s because of deterioration in the quality of public institutions.The Business Competitiveness IndexStable political, legal, and social institutions and soundmacroeconomic policies create the potential for improvingnational prosperity. But wealth is actually created at themicroeconomic level—in the ability of firms to createvaluable goods and services using efficient methods. Onlyin this way can a nation support high wages and theattractive returns to capital necessary to support sustainedinvestment.The Business Competitiveness Index (BCI) presented in this volume is based on a conceptual frameworkand statistical approach which follows that of the previousExecutive SummaryTable 2 breaks down the GCI into its three main subcomponents: the macroeconomic environment index, thepublic institutions index, and the technology index. InTable 2 we see, for instance, that Finland is ranked firstoverall because it scored well in all areas. Unlike Finland,the United States maintained its position in secondplace of the GCI amid varying levels of achievement inthe different components. For instance, the country’s overall performance is weakened by the quality of its publicinstitutions. And although the United States still leads inthe technology index, its overall score dropped, reflecting areduction in the tertiary enrolment rate and a decline inthe number of patents granted.In Europe, France, at 26th place, received a boost inits rankings due to higher scores in public institutions andtechnology, which offset a decline in the macroeconomicenvironment. Unlike France, Ireland fell to 30th position due to widespread declines in the different components of the index. Similarly, Italy, at 41st position, alsoplummeted in the rankings, reflecting across-the-boarddeclines in the major components of the index, particularly its macroeconomic environment.Among central and eastern European countries,Estonia maintains its leadership at 22nd place in the overall rankings, enjoying the highest technology, public institutions, and macroeconomic environment scores in theregion. Latvia is most notable for posting one of the mostimproved performances across the various components.Although Ukraine, at 84th place, has the lowest rank inEurope, the country has posted improvements incertain areas.In Asia, Korea posted one of the most notable ascentsin the GCI rankings, moving from 25th to 18thposition. Korea’s rise in the rankings was driven byimprovements in its macroeconomic environment,increased public trust in politicians, a better score in thearea of diversion of public funds, and a remarkableimprovement in its technology performance with one ofthe highest increases in patent activity. Like Korea,Thailand and Vietnam registered notable improvementsin overall rankings. Although Indonesia declines in theoverall rankings, the country posts one of the most significant increases in its actual score. Its macroeconomicenvironment score is the 5th most improved, marked bydramatically better scores in the area of government waste.Malaysia and India both derived gains from improvementsin the area of technology. Among the most notable downward shifts in the rankings was experienced by China.The country’s plunge in the rankings was marked by aremarkable deterioration in the perceived quality of publicinstitutions.In Latin America, Chile continues to have the highestrank in the region, followed, at a considerable distance, byMexico. Although Chile has the highest scores in the5
Executive Summary6Table 2: Growth Competitiveness Index componentsGrowth Competitiveness Index (GCI)CountryFinlandUnited ndNorwayAustraliaJapanNetherlandsGermanyNew ZealandUnited niaSpainHong aCzech RepublicLithuaniaItalySouth AfricaSlovak RepublicChinaPolandMauritiusMexicoEl SalvadorTrinidad and TobagoUruguayCosta VietnamMoroccoDominican urce: World Economic ForumMacroeconomic Environment IndexCountryBulgariaTurkeyPhilippinesJamaicaSri LankaTanzaniaRussian nNetherlandsAustriaCanadaUnited KingdomNew ZealandUnited StatesHong ryCzech RepublicSouth nidad and TobagoEl SalvadorPolandSlovak tiusPeruPanamaPhilippinesRussian FederationPakistanCosta iaSri LankaColombiaSenegalGhanaDominican 888990919293949596979899100101102
Public Institutions IndexCountryDenmarkFinlandIcelandAustraliaNew ZealandSingaporeSwedenSwitzerlandGermanyHong KongNetherlandsUnited KingdomLuxembourgAustriaIsraelNorwayUnited l SalvadorLithuaniaGreeceSouth AfricaMauritiusLatviaItalyCzech RepublicNamibiaCosta RicaMexicoSlovak RepublicChinaBrazilPeruIndiaTrinidad and rkeyTechnology can amaSri uaBoliviaEcuadorRussian 01102CountryUnited dUnited KingdomMaltaNetherlandsAustraliaMalaysiaCzech RepublicPortugalNew ceChileHungarySlovak RepublicPolandBrazilLithuaniaHong KongIrelandThailandSouth AfricaCroatiaLuxembourgMexicoItalyArgentinaCosta RicaTrinidad and TobagoJordanMauritiusPanamaUruguayDominican 85960616263(cont’d.)CountryIndiaChinaSerbiaEl SalvadorEgyptRussian FederationMacedoniaMoroccoSri 01102Executive SummaryTable 2: Growth Competitiveness Index components (cont’d.)7
Executive Summary8reports and the findings are fully comparable with previous Microeconomic Competitiveness Index results.The microeconomic foundations of productivity reston two interrelated areas: (1) the sophistication withwhich domestic companies or foreign subsidiaries operating in the country compete, and (2) the quality of themicroeconomic business environment in which they operate.The productivity of a country is ultimately set by theproductivity of its companies. An economy cannot becompetitive unless companies operating there are competitive, whether they are domestic firms or subsidiaries offoreign companies. However, the sophistication and productivity of companies is inextricably intertwined withthe quality of the national business environment. Moreproductive company strategies require more highly skilledpeople, better information, more efficient governmentprocesses, improved infrastructure, better suppliers, moreadvanced research institutions, and more intense competitive pressure, among other things.This is what the BCItries to capture.The BCI is constructed from measures drawn primarily from the Executive Opinion Survey. Quantitativemeasures are utilized for patenting rates and Internet andcellular telephone penetration. For all of the other dimensions measured, quantitative data for many countries areunavailable.Thus, the Survey offers many unique measuresand captures the informed judgments of thousands ofbusiness leaders and decision makers in the economiesexamined.To derive the overall BCI, two subindexes are computed.The subindexes measure the (1) sophistication of company operations and strategy and (2) the quality of the nationalbusiness environment, respectively. Many of the dimensionsof company sophistication and the quality of the businessenvironment tend to move together. Moreover, the sampleof countries is relatively small and the number of relevantvariables is high.Thus, the impact of individual variables isdifficult to distinguish statistically. Hence common factoranalysis is used to compute the subindexes.The twosubindexes are then averaged to estimate the overall BCI.The weights are determined from the coefficients of amultiple regression of the subindexes on GDP per capita.The BCI rankings for 2003 are shown in Table 3.Column 1 shows the overall rankings. Columns 2 and 3display the two subindexes: the company operations andstrategy subindex and the quality of the national businessenvironment subindex, respectively.In the overall BCI, Finland retakes the leading position, after dropping to second place behind the UnitedStates last year. Finland remains one of the world’s mostremarkable success cases over the last decade.The UnitedStates was pulled down by concerns about rising tradeprotection, tightening capital availability, and weakeningcluster vitality. Other advanced nations improving theirrankings include France, Denmark, Sweden, Australia, andNew Zealand. France gained five positions, mainly due toan improving business environment, regaining its pre-2000ranking. Heartening for France are improvements in localcompetition, governance, and reductions in governmentdistortions. Denmark and New Zealand gained four ranks;mainly based on improvements in the business environment. Australia continued its upward trend, while Swedenreached the third position based on company and businessenvironment improvements.Advanced countries slipping in the rankings includeAustria, based on a deteriorating business environment.The United Kingdom also slipped several places afterstrong gains last year. Other advanced nations that are slipping are Switzerland, Canada, and Japan. Japan, while stillsliding, registered strong improvements in corporate governance and cluster collaboration. Germany’s rank fallsonly one place, but the quality of its business environmentdropped precipitously. Labor-management relations are agrowing
Columbia University and John W. McArthur of The Earth Institute and was presented in The Global Competitiveness Report 2001-2002.The second index,now labeled the Business Competitiveness Index (BCI), was developed by Michael Porter of Harvard University and was first intro-duced in The Global Competitiveness Report 2000.