Transcription
Modeling the Philippine Cities’ Competitiveness Toward aSustained Development Amid COVID-19 PandemicReymund B. Flores1ABSTRACTCities and urban centers are viewed as drivers of regional and national development. The COVID19 pandemic and the subsequent enhanced community quarantine (ECQ) implemented by thePhilippine government and related public mobility restrictions imposed had resulted to closure ofbusinesses – from the micro, small, and medium enterprises (MSMEs) sector to several majorindustries in regional and provincial centers across the country. In the current crisis, it is arguedthat urban centers play a crucial role in sustaining the country’s competitiveness. Thus, we shouldnot limit our understanding of cities competitive on rankings alone. Assessing the vital signs ofcompetitiveness in terms of the underlying fundamentals that ultimately drive these results andproviding prescriptions to address the economic challenges we are facing in this time of pandemicare also necessary. It is then at this level that the interrelationships of the four pillars ofcompetitiveness – economic dynamism, government efficiency, infrastructure, and resiliency,should be understood better. Applying the structural equation modeling (SEM) approach, thisstudy analyzes the interrelationships of these four pillars of competitiveness using the Cities andMunicipalities Competitiveness Index (CMCI) data from 2017-2019. Through model developmentand analysis, the findings in this study provide direction for Philippine cities in framing theirdevelopment agenda and recommendations for local government officials and developmentplanners on what to prioritize in attaining and sustaining local competitiveness particularly in thisvery challenging time.Keywords: competitiveness of cities, Philippine competitiveness, competitiveness indicators,Philippine cities competitiveness1Independent Researcher; Assistant Professor of Politics and Public Administration/Governance, West Visayas StateUniversity, Iloilo City Doctor of Public Administration, National College of Public Administration and Governance,University of the Philippines Diliman. email: greatmund@gmail.com reymund.flores@wvsu.edu.ph
Cities compete with each other in many different fields. It is for this reason that tools forbenchmarking and “Index of Competitiveness” are becoming more relevant. Since itsestablishment in 2011, the Philippine National Competitiveness Council (PNCC) has beenmandated to promote and develop strategies and push for the implementation of the action agendafor competitiveness. The Cities and Municipalities Competitiveness Index (CMCI), developed byPNCC, is an annual ranking of Philippine cities and municipalities based on Michael Porter’s(2004) framework. Porter’s competitiveness focused on the idea of productivity defined as outputper unit of input. According to him, competitiveness is the ability of firms to thrive in a businessenvironment (Porter 1990). He also said, “national competitiveness” corresponds to the economicstructures and institutions of the state for economic growth within the structure of global economy.Following the same lens, “local competitiveness” is viewed as how well cities ormunicipalities know their resources and how these resources are used to improve the standard ofliving. Henceforth, it is argued that through productivity improvement, cities and municipalitiescan have greater opportunity to raise their citizens’ standard of living; thereby, could contribute tothe country’s economic development, particularly in this time of pandemic.At present, the Philippines’ general understanding of competitiveness is limited to thedescriptive findings of PNCC, specifically the ranking of cities and municipalities based on anoverall competitiveness score. The overall competitiveness score is determined by the sum ofscores on the four main pillars – economic dynamism, government efficiency, infrastructure, andresilience, which pool data from several sub-indicators. The higher the score of a city ormunicipality, the more competitive it is (CMCI Website). Hence, this study was conceptualized toprovide better understanding of the interrelationship of these four main pillars of competitivenessof Philippine cities to guide city government officials and planners in framing their developmentagenda and what to prioritize in attaining and sustaining the city/urban-competitiveness anddevelopment which are deemed useful in keeping local and national economic activities.Specifically, it aimed to:1. Analyze and interpret the three-year (2017, 2018, and 2019) Philippinecompetitiveness index data; and2. Provide recommendations to local government officials and planners, on what toprioritize, in attaining and sustaining LGU-competitiveness.The findings in this study are based from the 2017, 2018, and 2019 datasets (thescores/ratings of Philippine cities) of the four pillars of competitiveness as determined in CMCI.Using these datasets for analysis of the interrelationships of these four indicators is essentiallyimportant in understanding the general standpoint of Philippine economic development. Generally,because there is a growing consensus that nation-states are not really the only relevant operationaland economic units in the new economy. The cities and their regional environments are nowconsidered key players in the global economy.
Moreover, this study can provide inputs to institutions working for nationalcompetitiveness like the PNCC to also assess and track the country’s performance in terms of theunderlying fundamentals that ultimately drive competitiveness as an outcome. It is at this level ofunderlying fundamentals that policies, backed by data-driven analysis, have to intervene in orderto make a sustainable development in the country’s standard of living over time.The competitiveness of firms is normally defined by their ability to sell their products in contestedmarkets (Turok, 2005:25). A competitive city is identified as one with relatively high per capitaincomes or employment and features as a prominent goal of development agencies on how toincrease economic development (Turok, 2005). It is in this context that competitiveness, accordingto Turok (2005), should be viewed as encompassing three key determinants of growth andprosperity; namely, the ability of a city’s firms to sell their products in contested external markets(trade), the value of these products and the efficiency with which they are produced(‘productivity’), and the extent to which local human, capital and natural resources are utilized(e.g., the “employment rate”).The importance of the concept of competitiveness has increased rapidly in recent years,with the issues surrounding it becoming more empirically refined and theoretically complex at thesame time (Porter, 1990, 2000; Huggins and Izushi, 2011). Porter (1990) defined nationalcompetitiveness as an outcome of a nation’s ability to innovate in order to achieve, or maintain,an advantageous position over other nations in a number of key industrial sectors. In his earlystudy, Porter (1990) linked national competitiveness to productivity and, principally, a nation’sability to innovate.The comprehensive competitiveness of a city is the result of economic, political, andcultural forces playing their roles together (Pengfei, N. and Kresl, P.K., 2010). Hence, it is afunction of complex interrelationships of variables. It should not be reduced to any single one ofthem. Moreover, there remains unresolved questions about the factors and forces underlying thesefeatures, and how the concept should be deeply measured and understood.The role of the cities as spatial unit of organization has pulled attention of governancescholars and practitioners of competitiveness at the local level. From this spatial perspective,Porter’s (2000) major contribution was to take a micro-level understanding of the conditionsdetermining firm competitiveness, such as the capacity to innovate, and apply it to the territorialunit – like a city. It is Porter’s (2000) notion of the microeconomic determinants of prosperity andwealth generation, as opposed to determinants related to monetary exchange rates and the like, thatis at the heart of the concept of local competitiveness.Of relative similarity, there is also growing consensus in the Philippines that cities areprimary spatial units that compete to attract investment. In urban center or city level, knowledge
is circulated and transferred, resulting in agglomerations or clusters of industrial and service sectorenterprises. Yet, the Philippines ranks 103th among 189 countries according to the World Bank’sDoing Business 2016 Report.The 2010 Global Urban Competitiveness Report presented an analysis on why some citiesare more competitive while others are less competitive. The observation indicates that cities withleading comprehensive competitiveness tend to have high scores in each of the aspects, and do nothave any distinct disadvantages in any other components. Some cities have high ranks in some ofthe indices, but are restricted by other aspects. Therefore, their comprehensive competitivenessranks remain low. Obviously, in order to improve their comprehensive competitiveness, citiesshould focus on balanced development and leverage their competitive advantages.The quality of urban living environment contributes to a city’s competitiveness byattracting and cultivating talented individuals (Pengfei, 2012). This means that high quality livingenvironment plays an important role in attracting and cultivating high-quality talent as well as themaximum application of their abilities. Competitive places have developed diverse,multidimensional ways to attract mobile workers as well as mobile investment. Benchmarks,including knowledge metrics, innovation indices, and report cards, are increasingly common andincreasingly critical to the monitoring of key features of economies and societies whose factors ofproduction and of success are highly mobile (Malecki, 2007). While nations can only do much tofacilitate these adjustments, the primary burden of action always falls on the shoulders of cityleaders. Hence, the city’s leadership and policymakers need to grasp the nature of “placecompetition” and the critical roles of knowledge in the strategies of the most competitive places inorder to sustain the economic activities despite the pandemic.Cities have been engines of productivity and growth throughout history. The massive andrapid urbanization of countries, particularly in Asia, suggests that the role of cities is even moreessential in the overall economy of nations and regions, their future growth, and competitiveness.Moreover, it is important to recall that early Asian prosperity was also driven by cities. The WorldEconomic Forum (WEF) defined the city’s competitiveness as the set of factors – policies,institutions, strategies and processes –that determines the level of a city’s sustainable productivity(2014). Here, WEF argues that sustainability encompasses economic, environmental, and socialissues.A city competitiveness index is becoming very useful for benchmarking and understandinghow they behave in relation with other cities. Indicators and Indices can help measure the level ofcompetitiveness of a city. Measuring certain key urban indicators and providing relevantcomparisons through benchmarking analysis allows stakeholders of the city to make appropriatedecision to achieve their specific objectives. In the Philippines, the PNCC measures the cities and
municipalities’ competitiveness using four indicators – economic dynamism, governmentefficiency, infrastructure, and resiliency.The PNCC associates economic dynamism to the city’s activities that create stableexpansion of business and industries and higher employment. It recognizes that localities are atthe center of economic activities. These business expansion and job creation are easily observablein local settings. Government efficiency refers to the quality and reliability of government servicesand government support for effective and sustainable productive expansion. This factor looks atgovernment as an institution that is generally not corrupt, able to protect and enforce contracts,and apply moderate and reasonable taxation and is able to regulate proactively. PNCC measureslocal infrastructure indicator of competitiveness by looking into the physical building blocks thatconnect, expand, and sustain a locality and its surroundings that enable the provision of goods andservices. In 2017, PNCC introduced resiliency in measuring the cities and municipalitiescompetitiveness. Generally, this indicator attempts to look into the capacity of a locality tofacilitate businesses and industries to create jobs, raise productivity, and increase the incomes ofcitizens over time despite of the shocks and stresses it encounters. This implies that the role oflocal governments is critical in ensuring a competitive environment to make businesses sustaintheir profits, create jobs, and increase the productivity of its people. In order for localities to beable to do this, it must be resilient in its infrastructure, governance, social and environmentalsystems.However, in spite of the relevance of cities in this new century, Vegara (2016) explainedthat Urban Science concepts and methodologies are still going through a major evolution. We needalso to take note that many of the great challenges that cities are facing do not have correspondingmajor framework for analysis. This makes comparing initiatives and performance of differentcities difficult to measure. Hence, this study gained interest at modeling the scores of Philippinecities in these four indicators, using the CMCI datasets from 2017 to 2019, to provide new meaningin competitiveness interpretation other than using the CMCI rankings as a form of benchmarking.It is at this point that the SEM structure (Figure 1) is advanced to analyze theinterrelationships of the four pillars of competitiveness of Philippine cities.Figure 1. SEM Structure for Data Analysis
The concept aims to provide policymakers with a basis to make data-driven decisions onwhere action is needed to sustain competitiveness in a given situation, particularly in emergencysituations or during this period of pandemic. The model stands in the idea extracted from the WorldBank’s 2013 Doing Business Publication that says, “since rules and regulation that governmentimposes on markets and companies have long been a natural focus of competitiveness analysis,thus, rules matter.” Following this idea, urban governments need to focus more attention on howto institutionalize proactive regulation and efficient design, promote growth and developmentthrough transparency and accessibility, and shape better-functioning institutions with reasonablyefficient design to build infrastructure support and sustainability for markets to enhance localeconomic dynamism.This is a scientific, non-experimental study that systemically investigated the interrelationships ofthe four pillars of competitiveness measured by PNCC in its Annual CMCI reports. The study usedthe structural equation modeling (SEM) approach in the data analysis.Frequency counts of cities from each clustered geographical area was used to describe thepattern of the number of cities included in the top ten in each CMCI indicator. Three-year data sets(2017, 2018, and 2019) from PNCC’s Annual CMCI reports for Philippine cities were used inquantitative data analysis. A systematic review of literatures in urban competitiveness served asbasis in framing the model or SEM structure for analysis. Hence, this research is largelyquantitative in its generic sense, but embedded qualitative analysis – specifically systematic reviewthrough desk-archival research.SEM is a “second generation” multivariate method used to assess the reliability andvalidity of the model measures. It allows simultaneous analysis of all the variables in the modelinstead of analyzing them separately. The main reason for using SEM approach in this study isthat, the simultaneous evaluation of the model construct relationships is possible. Evaluation neednot to be performed in sequential steps. The approach likewise provides flexibility for theresearcher to compare observed data with the theory. Lastly, instead of doing path analysis usingthe traditional regression procedures, the use of SEM for path models enables the researcher togenerate output for measures of model-fit, and modification indices.In data analysis, standardized maximum likelihood estimation was used in SEM analysis.SEM standardized path coefficients and model-fit analyses were done using IBM SPSS AMOSsoftware version 21 to analyze the interrelationships of the four pillars of cities competitivenessnamely: government efficiency, resiliency, economic dynamism, and infrastructure. Normative FitIndex (NFI), Tucker Lewis Index (TLI), Comparative Fit Index (CFI), and Goodness of Fit Index(GFI) were used for model-fit analysis. The analysis of the goodness of fit of the SEM structureused in this study is shown in Table 8 (See Annex D).
The next section outlines and discusses the key findings of and takeaways from this study.Urban/cities competitiveness index serves as essential baseline for city and regional leaders andmanagers to better understand the performance of their own area in relation with othercities/regions according to various indicators in a precise moment of time. Through thiscompetitiveness index, cities can take advantage of the opportunity to also learn from other citiesand benefit each other. The city’s leadership/management can discover, through benchmarking,how they can compete and cooperate with other cities and look for integrated strategies andsolutions to achieve their respective objectives.In the Philippines, cities are concentrated in NCR and Luzon areas. There is a total of 33Highly Urbanized Cities (HUCs); and 112 Component Cities (CCs) included in the CMCI rankingsin 2017, 2018, and 2019 respectively (See Tables 1 and 2). Of this total, 16 (48.5 %) HUCs arelocated in NCR; 5 (15.1 %) in Luzon; 6 (18.2 %) in Visayas; and 6 (18.2 %) in Mindanao. Forcomponent cities, 52 (46.4 %) cities are in Luzon; 33 (29.5 %) in Visayas; and 27 (24.1 %) inMindanao.Table 1. Frequency Distribution of Highly Urbanized Cities in the Philippines According to Geographical AreaGeographical Area2017-2019Number of 2Total33100Table 2. Frequency Distribution of Component Cities in the Philippines According to Geographical AreaGeographical Area2017-2019Number of 112100
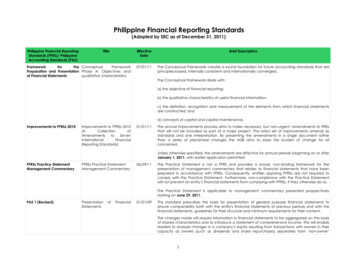
Number of Top Performing Philippine Cities in the Competitiveness Index from EachGeographical AreaMore cities from the National Capital Region (NCR) are top performing in the four-pillars ofcompetitiveness index among highly urbanized cities (HUCs) in the Philippines from 20172019.From 2017 to 2019, more cities from NCR are among the top performing cities HUCs in all fourCMCI indicators. Six to seven Metro Manila cities were included in each of the four indicators ofcompetitiveness during this three-year period. This suggests that being part of the primaryinternational entry point in the country is an advantage for cities in Metro Manila which havealready established governance mechanisms and strategies to be more attractive to markets andkeep a dynamic economic environment.Moreover, it is observed that cities from Luzon are seldom ranked within the top tenperforming HUCs in the areas of infrastructure and resiliency.Figures 2 to 5 show the comparative frequencies of cities from NCR, Luzon, Visayas, andMindanao in the top ten HUC rankings of four CMCI indicators.Economic Dynamism (Highly Urbanized oFigure 2. Number of HUCs from their respective areas included in the top ten for Economic Dynamism
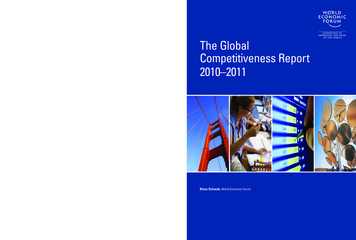
Government Efficiency (Highly Urbanized Figure 3. Number of HUCs from their respective areas included in the top ten for Government EfficiencyInfrasructure (Highly Urbanized oFigure 4. Number of HUCs from their respective areas included in the top ten for Infrastructure
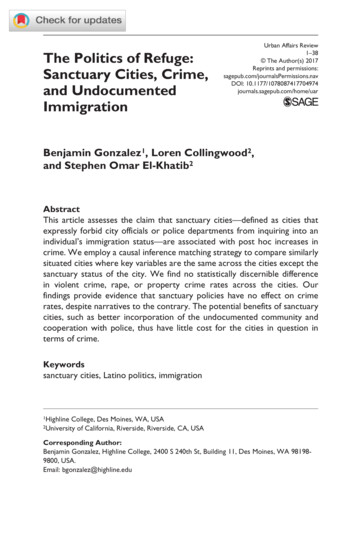
Resiliency (Highly Urbanized oFigure 5. Number of HUCs from their respective areas included in the top ten for ResiliencyMost of the competitiveness index top performing component cities (CCs) in the Philippinesfrom 2017-2019 are from Luzon.From 2017 to 2019, component cities from Luzon (particularly those within Metro Manilaperiphery) are among the top in all four CMCI indicators. Seven to nine CCs in Luzon are rankedwithin the top ten in economic dynamism. It can be noted that there is a significant increase in thenumber of CCs from Luzon in the 2019 (from five in 2018 to nine in 2019) CMCI ranking in termsof government efficiency. Moreover, there is an increasing pattern in the number of CCs fromLuzon which are ranked in the top ten for infrastructure.During this three-year period, cities in the Visayas were not able to ranked within the topten in the following indicators: Economic Dynamism (2017 and 2019), Government Efficiency(2019), Infrastructure (2018 and 2019), and Resiliency (2018 and 2019) while there are about oneor two cities in Mindanao which are among the top performing cities in some competitivenessindicators on a particular year.Figures 6 to 9 show the comparative frequencies of cities from Luzon, Visayas, andMindanao in the top ten CC rankings of four CMCI indicators.
Economic Dynamism (Component oFigure 6. Number of CCs from their respective areas included in the top ten for Economic DynamismGovernment Efficiency (Component oFigure 7. Number of CCs from their respective areas included in the top ten for Government Efficiency
Infrastructure (Component gure 8. Number of CCs from their respective areas included in the top ten for InfrastructureResiliency (Component gure 9. Number of CCs from their respective areas included in the top ten for Resiliency
Interrelationships of the Four Pillars of Competitiveness of Philippine Cities(2017-2019) and their Policy ImplicationsOther than capturing local differences, these four pillars of CMCI have been able to enhanced thefrequency of benchmarking, point out the areas of improvement for a particularly city to improvetheir competitiveness, and highlight good practices that are easily replicable in some other cities.This section presents the key takeaways in SEM analysis of the Philippine HUCs and CCs’CMCI scores from 2017 to 2019. The overall model path coefficients for each year are presentedin Annex A, B, and C respectively.When the [local] government becomes more efficient, the more likely it can build/facilitate betterinfrastructures to support a dynamic economic environment. The results of the simultaneousregression and path analysis of the three-year period datasets showed that government efficiencyhas significant effect to infrastructure (See Table 3). This means that as the city governmentbecomes more efficient better infrastructures to support local economic growth and expansion willmore likely improve. Simpler entry regulations could encourage the creation of more new firmsthat would eventually result to new jobs in the formal sector. Moreover, according to the WorldBank (2013), economies at varying income levels and in different regions saw noticeable increasesin the number of new firm registrations after implementing such reforms, such as in businessregistration. In relation to this, within-country studies have confirmed the positive associationbetween improvements in business registration and registration of new firms (World Bank, 2013).Efficiency in local tax collection is also essential to support public infrastructure which areimportant for the growth of local markets.Thus, the city’s leadership needs to have a clear vision of the city’s direction in order toget the basics right. This involves thinking of a regulatory framework to improve the city’sbusiness climate which involves stable and prudent fiscal policies, including efficient and simpletaxation; a flexible labor market; openness to trade and foreign investment; and simple andtransparent business regulation – is the primary lesson for good public policy (WEF, 2014).Table 3. Standardized Regression Weights (Maximum Likelihood Estimates) Summary between GovernmentEfficiency and InfrastructureYearEstimated βC.R.*P**Label20170.455.5.07 0.000Significant20180.525.435 0.000Significant20190.8615.048 .0.000Significantβ (standardized regression coefficient); *c.r. 1.96 ( -1.96); **p 0.05
With more infrastructure support for hosting businesses and industries, cities are more likely toexperience dynamic economic activities. The results of the simultaneous regression and pathanalysis of the three-year period datasets showed that when there is improvement in infrastructuresupport cities will more likely have an increase in economic dynamism (See Table 4). Publicinfrastructures such as schools, hospitals, courts, roads, seaports, and airports help businesses andsociety to become more productive and better off (World bank, 2006). In contrast, when the qualityand accessibility of infrastructure services are poor, companies’ productivity and growth suffer(World Bank, 2010). This means that the existence of the right infrastructure supports for marketexpansion could foster dynamism in the Philippine cities’ economy.Table 4. Standardized Regression Weights (Maximum Likelihood Estimates) Summary between Infrastructureand Economic DynamismYearEstimated βC.R.*P**Label20170.7311.362 0.000Significant20180.6810.346 0.000Significant20190.7512.564 0.000Significantβ (standardized regression coefficient); *c.r. 1.96 ( -1.96); **p 0.05The more efficient the government is, the more likely the city will perform better in the resiliencyindicator. To increase competitiveness, [city] governments of emerging economies need topromptly and efficiently implement structural reforms. The right mix of priorities requires tailoringto specific conditions and stages of city development (WEF, 2014). These reforms are necessaryto build their resilience against future external shocks, allow a more efficient allocation ofresources, and facilitate the transition toward more productive activities (WEF, 2014). Those thatare flexible and adapt quickly to changing conditions are successful cities.The results of the simultaneous regression and path analysis to the model using the threeyear period datasets revealed that government efficiency has significant effect to resiliency (SeeTable 5). This supports the idea that as the efficiency in [local] governance improves the city’sperformance (score) in the indicators of resiliency is likewise improving. However, it is importantto note that resiliency here is primarily based on the existence and documentation of outputs; andadherence to the national DRRM policies and mandates to local governments which are generallytrue to all local government units.
Table 5. Standardized Regression Weights (Maximum Likelihood Estimates) Summary between GovernmentEfficiency and ResiliencyYearEstimated βC.R.*P**Label20170.608.919 0.000Significant20180.6911.497 0.000Significant20190.578.393 0.000Significantβ (standardized regression coefficient); *c.r. 1.96 ( -1.96); **p 0.05Resiliency has less likely influenced the notion of competitiveness among Philippine cities.Climate change exacerbates nature loss, which in turn reduces our resilience to climate change andits impacts. Incorporating the sustainability/resilience goals and design into each stage of theinfrastructure asset cycle, particularly in the early stages of strategy and design has been asuccessful strategy (WEF, 2020). Another element of a successful strategy according to WEF(2020) is environmental considerations. Establishing the goals and expected outcomes inconjunction with a predetermined set of sustainability and resilience drivers are relevant to thecity’s competitiveness. These considerations include mitigating effects of natural disasters andclimate change, climate resilience, ensuring efficient energy utilization during construction andoperation phases, optimizing use of natural resources, optimizing land use, waste minimization/design optimization.Interestingly, during this three-year period, resiliency was found to have no significanteffect to improvement in the infrastructure supports for markets (except in 2017) and economicdynamism (See Tables 6 and 7). The results suggest that an increase in resiliency score does notsignificantly mean that a city has more likely have better infrastructure to attract more business oran improving economic environment.While it is believed that the role of local governments is critical in ensuring a competitiveenvironment to make businesses sustain their profits, create jobs, and increase the productivity ofits people, the present component of resiliency being measured is limited to the existence of thefollowing local government’s output: Organization and Coordination – Land Use Plan, DisasterRisk Reduction Plan, Annual Disaster Drill, Early Warning System; Resiliency Financing –Budget for DRRMP, Resiliency Reports – Local Risk Assessments, Resiliency Infrastructure –Emergency Infrastructure, and Utilities; Resilience of System – Employed Population, SanitarySystem.By looking into this, the quality of the outcomes of these plans and outputs have not yetcaptured in the assessments as it is argued that in order for localities to be able
PNCC, is an annual ranking of Philippine cities and municipalities based on Michael Porter's (2004) framework. Porter's competitiveness focused on the idea of productivity defined as output per unit of input. According to him, competitiveness is the ability of firms to thrive in a business environment (Porter 1990).