Transcription
See discussions, stats, and author profiles for this publication at: Experimental study of solving thermalheterogeneity problem of data center serversArticle in Applied Thermal Engineering · October 2016DOI: 043 authors:Sameh NadaAli AttiaBenha UniversityBenha University61 PUBLICATIONS 381 CITATIONS11 PUBLICATIONS 120 CITATIONSSEE PROFILESEE PROFILEK. E. ElfekyBenha University4 PUBLICATIONS 12 CITATIONSSEE PROFILEAll in-text references underlined in blue are linked to publications on ResearchGate,letting you access and read them immediately.Available from: Sameh NadaRetrieved on: 22 September 2016
Applied Thermal Engineering 109 (2016) 466–474Contents lists available at ScienceDirectApplied Thermal Engineeringjournal homepage: www.elsevier.com/locate/apthermengResearch PaperExperimental study of solving thermal heterogeneity problem of datacenter serversS.A. Nada , Ali M.A. Attia, K.E. ElfekyDepartment of Mechanical Engineering, Benha Faculty of Engineering, Benha University, Benha 13511, Egypth i g h l i g h t s Increasing server power density increases its surface temperature heterogeneity. Variation of servers air flow rates leads to better thermal performance. Uniform increase of server’s air flow rates enhances thermal performance. Proper scheme of servers air flow rates maintains all servers at the low temperature.a r t i c l ei n f oArticle history:Received 17 May 2016Revised 1 August 2016Accepted 18 August 2016Available online 20 August 2016Keywords:Data centerEnergy managementHeterogeneous temperature managementServers fans speedsa b s t r a c tDesirable thermal management of data center requires uniform temperature distribution along the servers. Hot air recirculation and cold air bypass in data center leads to non-homogeneous cold air distribution along the servers of the racks which may lead to heterogeneous temperatures distribution along theservers. The present work aims to experimentally study the possibility of controlling these heterogeneoustemperature distributions by controlling the cold air flow rates along the servers. A physical scaled datacenter model was used to conduct this investigation. The effectiveness of thermal management of theservers racks of the data centers has been expressed in terms of intake, rare and surface temperature distributions along the rack servers and the supply and return heat indices (commonly symbolized as SHIand RHI; respectively). Excessive tests were firstly performed under uniform servers fans speed (uniformair flow rates through the different servers). Then the air flow rates distributions along the racks servershas been changed by regulating the server’s fans speeds using different schemes of fans speeds regulations at different data centers power densities. It is concluded that a uniform increase of server’s flow ratefrom the bottom to the top of servers rack cabinet provides (i) the lowest temperature at both coolingaisle (around 10%) and exhaust aisles (around 5%), (ii) the best uniform surface temperature of all rackservers (as the standard deviation is reduced from 10 to around 2), and (iii) the best values of thermalmanagement metrics (SHI and RHI) typically SHI is reduced by around 20% while RHI is increased byaround 3% to approach the targeted values; 0.1 and 0.9, respectively.Ó 2016 Elsevier Ltd. All rights reserved.1. IntroductionHuge and high speed data processing needed in a wide varietyof human life sectors such as industrial, educational, and administrational services in addition to other private sectors is performedusing data centers. These facilities are composed of racks hosingservers with different configurations and/or different capacities.To maintain the efficiency of these servers, proper thermal management is required to keep their operation within targeted temperature values. For this reason great part of power consumed is Corresponding author.E-mail address: samehnadar@yahoo.com (S.A. 016.08.0971359-4311/Ó 2016 Elsevier Ltd. All rights reserved.directed for cooling of these facilities throughout the computerroom air conditioning (CRAC) unit (almost 40–50% total powerconsumed [1]). Under proper thermal management operationabout 10–15% of this total energy consumption can be saved [1].Additional challenge for data center thermal management is howto also maintain the surface temperature of the different serverswithin the allowable limits [2]. Typical server hardware [2,3] israted for allowable operating temperature envelope of 35 C formost data centers with some control; for general applicationsASREA has recommended the operating temperature envelope tobe from 18 C to 27 C. Thus the main scope of data center manufacturer is to remove the hot air exhaust from servers to improvethe system cooling efficiency [4].
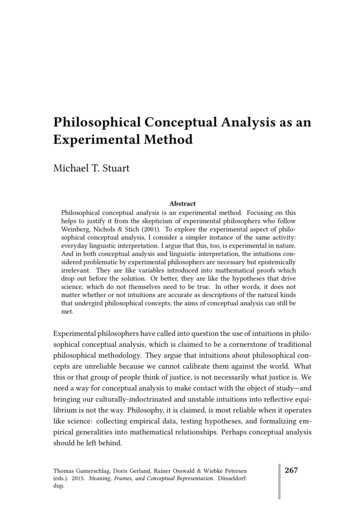
S.A. Nada et al. / Applied Thermal Engineering 109 (2016) stant pressure air specific heat (J/kg k)computer room air conditioningserver heat dissipation rate (W)length (m)air flow rate (kg/s)total number of servers intakesreturn heat indexsupply heat indextemperature ( C)reference temperature ( C)air velocity (m/s)intake xDifferent techniques are used for data centers cooling; the mostcommon techniques uses raised-floor configuration where thecooling air is supplied to the data center from the under-floor plenum through perforated tiles (see Fig. 1). The raised-floor arrangement provides unlimited flexibility regarding cooling air flowconfigurations. The most efficient configuration is the one thatdepends on separating cold and hot aisles [5,6] to avoid hot airrecirculation and cold air bypass. In their study on different datacenter configurations, Shrivastava et al. [7] found that using raisedfloor to supply the cold air and extracting the discharge hot airfrom the ceiling is the efficient data center air distribution system.This flow configuration becomes the standard practice for datacenter cooling where server racks are commonly arranged in properly oriented-rows to be placed on both sides of the cold aisle. Thusthe hot air from neighboring two rows of racks is exhausted intothe hot aisle. Then hot air from different hot aisles is collectedand returned to CRAC unit. As the server racks have their internalfans, the supplied cooling airflow rate through perforated tiles shallbe equal (or greater) than the required airflow rates of these fans toensure effective cooling process.Many investigations were performed to provide the best conditions that should provide high cooling efficiency of data centers.Cho et al. [8] studied air distribution in high power density datacenters and they concluded that as human thermal comfort isnot the aim of data center cooling, supply air velocity is a criticalfactor in data center. VanGilder and Schmidt [9] studied flow uniformity from data center floor perforated tiles and they reportedthat 25% perforated tiles opening ratio with 0.61 m plenum depthor more is the optimum for air flow uniformity. In other work, itwas reported that reducing system fan speed and increasing airFig. 1. Typical open aisle data center [4].SuperscriptsCCRACRrackSubscriptsi, jCartesian directionInair inlet to serversTimean temperature at intake x ( C)Outair outlet from servertemperature rise across the server increase the energy efficiencyin data centers [10,11]. In this case the mean temperature of hotair is raised across the data center room leading to a concern onthe system reliability due to approaching the thermal limits ofthe system.Effective data center thermal management can be attainedwhen proper cooling air distribution throughout the room is maintained. In this regard many controlling parameters should be studied; including cooling air flow pattern, temperature distributioninside data center, and server fan air flow rate. The later parameteris interrelated with the server power loading and/or processingload to maintain the server surface temperature within the predefined value as specified by manufacturer or as targeted by standards whichever is more stringent. There are many metrics usedfor thermal management evaluation in data centers [12–15]. Herrlin [16] concluded that the cooling efficiency of racks dependsmainly on the data center room environment, correspondinglythe use of performance metrics can help in analyzing theseinterdependencies.The most commonly used metrics are those used to evaluate themixing level between cold and hot air streams in the hot-aisle andcold-aisle arrangement related; namely supply heat index (SHI)and return heat index (RHI). These metrics evaluate the extent ofcold and hot air mixing in data center; SHI is the ratio of the heatgained by cold aisle air before entering the racks to the total heatgained by the air in the data center while RHI is the ratio of theheat gained in the air during passing in the rack relative to the totalheat gained by the air in the data center. These two metrics havebeen used by many investigators while studying or attempting toimprove data center cooling efficiency [15].Boucher et al. [17] have experimentally found that racks at therow end exhibit higher temperature than those inside due to hotair recirculation. The study concluded that proper control of CRACsupply temperature, CRAC fan speed, and plenum vent tile openings can greatly improve the energy performance of data centers.Kumar and Joshi [18] found that to overcome the escaping of coldair from the top of cold aisle other methods should be consideredrather than the increase of air flow rate through perforated tilewhich may not be the best way to confirm high efficiency coolingof data center. Cho et al. [19] concluded that the separation of coldand hot air aisles not only minimize the hot air recirculation butalso increase the chance of hot air short-circulation over seversespecially when the temperature at server backs approaches35 C. Patterson [20] reported that cooling system efficiency indata centers strongly depends on flow distribution and air temperature rise across the racks. Durand-Estebe et al. [21] proposed anew temperature adaptive control strategy to minimize the energyneed while investigating the effect of increasing server room temperature on the cooling plant energy consumption. Nada et al.
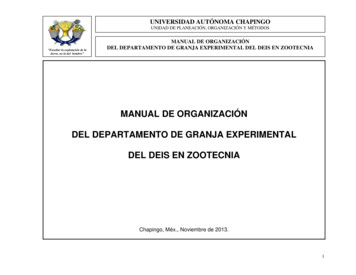
468S.A. Nada et al. / Applied Thermal Engineering 109 (2016) 466–474[22,23] presented numerical studies for the thermal performanceof data centers under different operating conditions and for different configurations of computer room air conditioning (CRAC) unitsand physical separations of cold and hot aisles. Temperature distribution, air flow characteristics and thermal management of datacenters racks array were predicted and evaluated for the differentarrangements.Most of investigations cited in the literature were experimentally reported in actual data centers or using CFD simulation. Carrying out a research on actual data center is costly and timeconsuming. To resolve this problems, the similarity analysis wasproposed to provide a physically scaled model of real data center[24–26]. Nada et al. [28,27] applied this dimensionless theory toconstruct a 1/6 scaled physical model test facility simulating thestandard data center to improve the thermal management andcooling efficiency of data centers. In their initial study [27], a singlerack inside data center room housing four servers was used to findthe best conditions providing best thermal management performance. Main conclusions determined optimum conditions to occurat uniform power loading scheme with perforated plate of 25%opening ratio under high power density. The results also showedthat there are variations in the servers temperatures along the servers of the rack and along the racks of the racks row due to hot airrecirculation and cold air bypass. To prevent hot air recirculationand/or cold air bypass, Nada et al. [28,29] used different arrangements of aisles partitions and containments in data center to control air distribution in a typical data centers using under floor airdistribution system for single and multiple racks rows. It was concluded that, using vertical aisle partition above the rack and topcontainment for aisle enclosure [28] lead to a reduction of the rackinlet temperature by 4–13% and 13–15.5%, respectively, and so thedata center cooling efficiency is improved. These results met thosestated by Mulay [30] who concluded that the cold aisle containment is not only used to reduce the CRAC power consumption considering dynamic thermal managing of data center, but also leadsto better uniform rack inlet temperature. In this regard properthermal awareness of data center is needed to overcome serveroverheating or service failure due to inhomogeneous servers’ surface temperature distribution [31]. Like-this thermal awarenessis realized by using proper management control (scheduling) algorithm to keep discrete server processing speed and/or power loadwithin the allocated values at all times to minimize data centerpower consumption; including server power and cooling power[31–33]. The scheduling algorithms that minimize the inlet airtemperature can minimize the cost of consumed energy as the heatrecirculation is reduced [33].From the literature, researchers and manufacturers shall facethe data center problems related to the inhomogeneous temperature distribution over different servers. While reviewing the cur-rent published literature, it seems that thermal management ofdata centers to overcome servers heterogeneous conditions byvarying servers fans flow rates was not investigated by previousstudies. Even the literature is rich with the dynamic thermal management of data centers and thermal awareness, almost none ofthese works were concerned with the server’s surface temperatureto provide proper control strategy on actually programmed serverswithout scheduling server power load. The current paper is anattempt to resolve these problems by proposing proper thermalmanagement based on the necessity to regulate the cooling airflow rate over different servers along racks such that the servers’surface temperatures become within the designed value. Whileperforming the study, the performance metrics were evaluated tocheck the effectiveness of the proposed cooling scheme.2. Experimental facility and procedure2.1. Scaled data center roomIn the current paper, scaled physical model proposed by Nadaet al. [27–29] using under floor supply-ceiling return configurationis used to investigate the current investigation of the cooling performance of data center under servers’ heterogeneous temperaturedistribution. A one-sixth geometrical scaled factor and Archimedesnumber equality were considered in designing and constructingthe physical scaled model. A physical scale room simulating datacenter contained three racks in a row was constructed to conductthe present experimental work. A general layout of the currentsetup is shown in Fig. 2.In this setup, a blower is used to supply air to the raised floor.Air enters the model room through perforated tiles located in frontof data center racks (cold aisle) to cool the racks servers. After cooling the servers, air was discharged as from the rear of the racks(hot aisle) as a hot air which is then is exhausted from the roomtop using discharging fans. The room model contains three rackseach includes four servers simulating actual racks row in a realdata. A group of sixteen T-type thermocouples distributed in themodel room are used to measure temperatures of air at racks inletand outlet as well as servers’ surface temperatures. The thermocouples used to measure the inlet and outlet rack air temperatureswere installed on a thin plastic chassis in front and behind the middle rack. Four thermocouples are installed on each frame and distributed at different rack heights to measure the inlet and outlettemperature of each server. Two other sets of two thermocouplesare located at air inlets to the perforated tile and return fans tomeasure supply and exit air temperatures to the room. Data Acquisition system and PC are used to record all the temperaturereadings.Fig. 2. Schematic diagram of the experimental setup.
4692.2. Data reduction and experimental procedureThe measured temperature distributions throughout the modeled data center room have been used to evaluate the efficiencyof data center cooling under specific operating conditions. Due tothe occurrence of hot air recirculation and cold air bypass (infiltration) phenomena, the intake air a rack is expected to be a mixtureof cold supply and recalculated hot air and this cause an increase inthe intake air temperature. It has been noticed that about 40% ofthe supplied cold air passes through the racks servers and the restis bypassed around the racks [36]. The efficiency of data centerthermal management is calculated from the measured temperature distributions in terms of thermal metrics proposed by Sharmaet al. [14] to determine SHI and RHI as follows: SHI ¼¼dQQ þ dQEnthalpy rise in cold aisle before entring the serverTotal enthalpy rise of the cold air RHI ¼ QQ þ dQ ¼Total heat extraction by the CRAC unitsTotal Enthalpy rise of the cold airð1Þð2Þwhere Q is the total heat dissipation from all the racks in the datacenter and dQ is the enthalpy rise of the cold air before enteringthe racks. From temperature measurements performed along singlerack, the enthalpy rise and heat dissipation are computed from temperature measurements by:101,6Plate HeaterIntake8090The dimension details of the modeled room is shown in Fig. 3.The room walls is made from 1-cm thick Plexiglas sheet and wereair tight assembled using silicon. The room outside dimensions is704.8 (length) 329.2 (width) 500 (height) mm with a raisedfloor height of 100 mm. The cold and hot aisles widths are 101.6and 75 mm, respectively. The racks dimensions are 101.6 152.6 332.3 mm (height) designed to accurately simulate actualracks of four servers each [34].To avoid internal air recirculation, the servers intake andexhaust faces are attached to rack perforated doors. The rack frontand rear doors are made of screen mesh of 65% opening ratio tosimulate actual servers [35]. A variable speed fan (0.45 m3/min)and electric heater (150 W) are used in each server cabinet to simulate the fan and heat generation of actual servers. The server fanflow rate is controlled by controlling the input power supplied tothe fan using a variac. Hot wire anemometer is used to measurethe fans flow. A nickel-chromium wire wrapped around mica plateand covered by a 0.5 mm in thick stainless steel plate is used togenerate heat in each server as shown in Fig. 4. A variac is usedto control the input power to the server.Axial FanS.A. Nada et al. / Applied Thermal Engineering 109 (2016) 466–474Exhaust5,2111,1127,9152,6Fig. 4. Top view of the server (dimensions in millimeters).Q¼XdQ ¼mr CpðTrout Trin ÞXð3Þmr CpðTrin Tref Þrð4ÞT rinT routwhere m is the mass flow of air through the rack,andarethe average inlet and outlet temperature from the rack and Tref isthe vent tile inlet air temperature. Neglect heat transfer in the plenum and constant temperature of the air exit from the vent tile theperformance metrics can be evaluated using the following relations: P r ðT T ref ÞP rinðTout T ref Þð5Þ P r ðT T in ÞRHI ¼ P routðTout T ref Þð6ÞSHI ¼It is easy to observe that:SHI þ RHI ¼ 1ð7ÞEqs. (1) and (4) show that increasing dQ cause an increase inðTrin Þ and SHI. Rising ðTrin Þ may leads to systems failure and reliability problems. Increasing ðTrin Þ also causes entropy generationdecreasing energy efficiency. Therefore, SHI may be used as anindication of thermal management and energy efficiency in datacenter. A low RHI indicates bypass of the cold air and its mixingwith the rack exhaust air without passing on the servers. Ideal values of (SHI and RHI) are (0 and 1) while typical benchmark acceptable ranges of SHI and RHI are SHI 0.2 and RHI 0.8 [14].The experimental procedure followed throughout this studyincludes the following steps:1. Initially confirm the clean and accessible of data center room.2. Check and set for operation the blower and its speed at the predefined values according to the experimental program.Fig. 3. Scale model data center (a) top view and (b) side view (dimensions in millimeters).
470S.A. Nada et al. / Applied Thermal Engineering 109 (2016) 466–4743. Adjust the servers supplied power according to the program.4. Adjust the fan speed according to the experiment objective.5. Turn on the data acquisition system to collect all temperaturemeasurements.6. Wait ad ensure achievement of steady state.7. Record all instruments readings (temperatures, air flow rate,voltage, and current).8. Repeat steps 3–7 at different power densities for the middlerack at each studied case.2.3. Experimental programFirstly group of experiments have been performed at homogenous power scheme to check the existence of heterogeneous temperature distribution regarding server’s surface temperature alongthe rack at different room power densities. As the objective of thecurrent study is to propose the optimum thermal managementprocedure to remove/reduce the heterogeneity of temperature distributions over servers’ surfaces, the controlling variables of theexperimental program include (i) the variation of power densityunder homogeneous cooling air flow rates, and (ii) the use of different schemes based on different server’s cooling air flow rates. Theeffect of these two factors are investigated while other parametersof data center are kept constant; see Table 1 for more details. It isimportant to state that the blower air flow rate is synchronizedwith the racks power density to ensure that server’s temperaturesare within the recommended range as in real data centers. Toensure measurements consistency, each experiment is repeatedat least twice. The measurements included air temperatures, airflow rate, voltage and current. The uncertainties in measuringthese quantities were estimated to be 0.2 C, 2%, 0.25% and 0.25%, respectively.3. Results and discussionThe first group of experiments were performed under conditions of homogenous power density with homogenous cooling airflowrates over the four servers along the test rack - abbreviatedas Case (1). Then the cooling load over different servers has beenscattered with the purpose of approaching uniform servers’ surfacetemperature abbreviated to be Case (2), Case (3), and Case (4). Toproperly show the influence of any proposed cooling load schemeon the modeled data center thermal analysis both groups (all thefour cases) of experiments have been plotted on the same relevantfigures. As shown from Figs. 5–7, the use of homogenous coolingloads leads to almost uniform temperature distribution at the rackinlets with slight increase in the servers’ front temperature due tothe influence of heat generation servers on its surrounding (within1 C). At rear of servers, the temperature is increased owing to heattransferred from servers with nearly ascending order as theexhaust gases receive more energy along the rack except at thetop server where the influence of cooling air bypass leads to slightdecrease in the exhaust air temperature. This behavior is independent of data center room power density, as the overall cooling loadis synchronized with the room power density to maintain the servers, surface temperatures within the allowable operating range(correspondingly the exhaust air temperature is nearly keptconstant).From the first view, it can be decided the non-necessity of additional thermal management as a suitable degree of homogenoustemperature distributions are observed. But when inspecting theservers’ surface temperature (the main target to keep the high processing efficiency of data centers) for uniform cooling flowrates(Case (1)) shown in Figs. 8–10, a significant ascending temperaturerise along the rack from bottom to top is observed. This result ismainly due to the accumulation of energy absorbed by coolingair as the exhaust is directed from bottom to the exhaust fan. Thistemperature rise varies according to the power density in the rangeof around 60–80 C for the bottom server and varies from around85 to 135 C for the top server. This is why Nada et al. [28,27] proposed for better thermal management of data centers the use ofservers having highest processing duties at the bottom to keepits surface temperature and so its effectiveness at optimal valuesno matter the room power density. This discrepancy in servers’surface temperature is known as heterogeneous temperature distribution which may lead to the overheating of local servers eventhe exhaust air temperatures are kept within the designed value.In purpose of keeping surface temperatures of all servers withinnarrow range of discrepancy, additional thermal management procedure based on the cooling load of servers along the rack is proposed. In this regard, four mentioned schemes are studied torecommend the best one of them that would keep all serversalmost at the same temperature while maintain a high degree oftemperature distribution at both front and rear of racks. In factany of these schemes can be realized as the most of servers’ housefans are currently programmable, and so fan power supply can bevaried according to the server location along the rack. The firstchoice was to remove both effects of bypass cooling and accumulation of energy in exhaust air occur at the top server, so most ofTable 1Details of experimental program.Ranges of controlling variableMeasured/studied variables1. Room power density (W/m2): 379, 759 and 11392. Schemes of server’s cooling flowrate:a. Uniform air cooling flowrates, 25% of the air flow rate to each server (Case (1))b. Non-uniform air flowrates specified for Case (2)c. Non-uniform air flowrates specified for Case (3)d. Non-uniform air flowrates specified for Case Case (1)Case (2)Case (3)Case (4)1. Temperature distribution throughout data center room2. Servers’ surface temperature3. Supply/return heat indices (SHI & RHI)
471S.A. Nada et al. / Applied Thermal Engineering 109 (2016) 466–474Case (1)Case (2)Case (3)Case (4)Case (1)Case (2)Case (3)Case (4)Servers temperature, CHeight, cmCase (2)Case (3)Case (4)12040302010010Case (1)140100806040201214161820222426280Temperature, C10152025Server height, cmFig. 5. Temperature profile at front (solid lines) and at rear (dashed lines) of therack at room power density of 379 W/m2.Case (1)Case (2)Case (3)Case (4)Case (1)Case (2)Case (3)Case (4)Fig. 8. Variation of servers’ temperature along rack height for different scheme ofserver cooling at room power density of 379 W/m2.Case (1)Case (2)1015Case (3)Case (4)140Servers temperature, CHeight, erature, CFig. 6. Temperature profile at front (solid lines) and at rear (dashed lines) of therack at room power density of 759 W/m2.Case (1)Case (2)Case (3)Case (4)Case (1)Case (2)Case (3)Case (4)2025Server height, cmFig. 9. Variation of servers’ temperature along rack height for different scheme ofserver cooling at room power density of 759 W/m2.Case (1)Case (2)Case (3)Case (4)14040Servers temperature, C120Height, cm302010010121416182022242628Temperature, CFig. 7. Temperature profile at front (solid lines) and at rear (dashed lines) of therack at room power density of 1139 W/m2.10080604020010152025Server height, cmFig. 10. Variation of servers’ temperature along rack height for different scheme ofserver cooling at room power density of 1139 W/m2.cooling air is directed to that server; Case (2). Due to the blockageof cooling air at low level servers, these servers are heated moreand affect their surroundings, so both temperatures of inlet andexit of low level servers are increased (see Figs. 5–10). In comparison with the homogeneous scheme, the inlet air temperature isincreased over 15% and the exhaust air temperature is increasedby around 3%. For Case (2), the mass flowrate over the top serveris high for fixed power density enhances the server cooling causingthe server temperature to be the lowest. This scheme to cool thedata center leads to the descending temperature rise of the servers’surface temperature which should oppose the natural convectionof heat transfer, correspondingly this scheme is not recommended
S.A. Nada et al. / Applied Thermal Engineering 109 (2016) 466–474Power 379 W/m2Power 379 W/m2Power 759 W/m2Power 759 W/m2Power 1139 W/m2Power 1139 W/m2Mean temperature, C2510020901580107056001234Standard temperature deviationi. The mean temperature value is increased by the increase ofthe power density.ii. Under uniform cooling flowrates, the standard deviation isthe maximum among studied cases for all studied powerdensities.iii. All the studied cases lead to reduction in the average temperature but with different standard of deviation.iv. Case (4) provides not only the lowest average temperaturebut also with minor standard of deviation indicating almostequal temperatures of all servers along the rack.Cooling scheme case numberFig. 11. The variation of the mean temperature along the rack (solid lines) and thecorresponding standard of variation (dashed lines) at the four studied SHIand other schemes are studied. The third scheme was proposed asthe middle servers were observed to have almost the same temperature at rear of the rack, so equal air cooling flowrates are used;Case (3).The use of Case (3) reduces the blockage of cooling behind thefront of the rack, so air is slightly heated but with level lower thanthe previous cases (Case (1) and Case (2)). In comparison with thehomogeneous scheme, the inlet air temperature is slightly reducedby around 4
heterogeneity problem of data center servers Article in Applied Thermal Engineering · October 2016 . Hot air recirculation and cold air bypass in data center leads to non-homogeneous cold air distribu- . aisle (around 10%) and exhaust aisles (around 5%), (ii) the best uniform surface temperature of all rack .