Transcription
Kenya meeting the electricitydemand of 2030An assessment of how Kenya Vision 2030 and climate changeimpact the optimal electricity generation mixAnna BerggrenSara ÖsterbergBachelor of Science ThesisKTH School of Industrial Engineering and ManagementEnergy Technology EGI-2017SE-100 44 STOCKHOLM
Bachelor of Science Thesis EGI-2017Kenya meeting the electricity demand of2030Anna BerggrenSara ÖsterbergApprovedExaminerSupervisorMark HowellsNandi MoksnesCommissionerContact person
This study has been carried out within the framework of the Minor Field StudiesScholarship Programme, MFS, which is funded by the Swedish InternationalDevelopment Cooperation Agency, Sida.The MFS Scholarship Programme offers Swedish university students an opportunity to carry out two months’ field work, usually the student’s final degree project, in a country in Africa, Asia or Latin America. The results of the work arepresented in an MFS report which is also the student’s Bachelor or Master of Science Thesis. Minor Field Studies are primarily conducted within subject areas ofimportance from a development perspective and in a country where Swedish international cooperation is ongoing.The main purpose of the MFS Programme is to enhance Swedish universitystudents’ knowledge and understanding of these countries and their problems andopportunities. MFS should provide the student with initial experience ofconditions in such a country. The overall goals are to widen the Swedish humanresources cadre for engagement in international development cooperation as wellas to promote scientific exchange between unversities, research institutes andsimilar authorities as well as NGOs in developing countries and in Sweden.The International Relations Office at KTH the Royal Institute of Technology,Stockholm, Sweden, administers the MFS Programme within engineering andapplied natural sciences.Erika SvenssonProgramme OfficerMFS Programme, KTH International Relations OfficeKTH, SE-100 44 Stockholm. Phone: 46 8 790 6561. Fax: 46 8 790 8192. E-mail: mensarbete/mfs
ABSTRACTKenya’s electricity sector faces extensive development as the country strives to achieve the goal ofuniversal access to electricity by 2020 and the national blueprint Kenya Vision 2030. With a history ofoverestimating the future electricity demand, it is important to make investment decisions based onrealistic demand prognoses. In this study, we evaluate a cost-optimal energy mix for electricitygeneration in 2030 for scenarios following business-as-usual (BAU) and Kenya Vision 2030 demandforecasts, using the spatial electrification tool OnSSET and the energy system modelling toolOSeMOSYS. Kenya is vulnerable to climate change and faces the challenge of frequent droughts,making water management a national priority. This study considers the nexus of Climate, Land, Energyand Water (CLEW). We look at how a climate change scenario, following a worst-case developmentaccording to Representative Concentration Pathway (RCP) 8.5, can affect the hydrology of the TanaRiver and thereby the electricity generation from its hydro power plants. Results show that the shareof grid connected households increase with a higher demand forecast, that the investment cost ofmeeting the electricity demand of Kenya Vision 2030 is 106 % higher than the investment cost at BAUdemand and that extreme climate change reduces the electricity generation of hydropower, leadingup to that 2 % of electricity production must be supplied by other (non-hydro) sources in 2030. Aconclusion drawn from this study is that the demand estimation has a central role for the investmentsin electricity technologies and is suggested to be based on trends of Kenya’s actual growth rather thanvisionary goals. Another conclusion is that a scenario of climate change impacts the future usage ofhydropower, making the nexus to other natural resources important to include in the development ofthe electricity system.SAMMANFATTNINGKenyas elsektor står inför omfattande utveckling när landet strävar efter att ge hela befolkningentillgång till elektricitet och att uppfylla de nationella utvecklingsmålen enligt Kenya Vision 2030. Dåelbehovet tidigare överskattats är det viktigt att investeringsbeslut grundas på realistiskaefterfrågeprognoser. I den här studien utvärderas en kostnadsoptimal energimix för elgenerering år2030 i scenarion som följer prognostiserade elbehov enligt business-as-usual (BAU) och Kenya Vision2030, med hjälp av modelleringsverktygen OnSSET och OSeMOSYS. Kenya är utsatt förklimatförändringar och har problem med återkommande torka, därför är vattenplanering högtprioriterad i landet. Den här studien tar hänsyn till hur Klimat, Land, Energi och Vatten (CLEW) påverkarvarandra. Vi tittar på hur ett extremt klimatförändringsscenario som följer RepresentativeConcentration Pathway (RCP) 8.5 kan påverka hydrologin i floden Tana och därmed elgenereringenfrån dess vattenkraftverk. Resultaten visar att andelen elnätsanslutna hushåll bör bli större vid etthögre elbehov, att investeringskostnaden för att möta elbehovet enligt Kenya Vision 2030 är 106 %högre än investeringskostnaden i ett BAU-scenario och att extrema klimatförändringar kan göra attelgenereringen från vattenkraft minskar, vilket gör att 2 % av elgenereringen måste ersättas av andraenergikällor år 2030. En av slutsatserna i studien är att efterfrågeprognosen har en central roll förinvesteringar som görs i elsystemet och bör baseras på utvecklingstrender snarare än visionära mål.En annan slutsats är att klimatförändring påverkar den framtida produktionen från vattenkraft, vilketgör att kopplingen till andra naturresurser är viktig att inkludera i utvecklingen av elsystemet.i
ACKNOWLEDGEMENTWe would like to acknowledge the following people for their help, advice and encouragement in thework with this Bachelor’s Thesis:Nandi Moksnes - for your patient supervision and fast feedback. Thank you for challenging us to thinkfor ourselves and to make decisions. We’ve learnt very much from working with you.Professor Mark Howells - for the inspiration and for the opportunity to do this project.Eunice Pereira Ramos, Alexandros Korkovelos and the rest of the KTH-dESA team - for introducing usto the tools for energy system modelling and for answering our questions along the way.Maria Stridsman at the Swedish Embassy in Nairobi - for sharing knowledge about Kenya’s energysector and for connecting us to your contacts. You helped us to get the most out of our field study.Boniface Kinyanjui at Kenya Power and Lighting Company - for deepening our understanding forKenya’s electricity sector and for assisting us with essential data.Dr Mary Mbithi and Dr Anthony Wambugu at University of Nairobi - for your warm welcoming at theUniversity of Nairobi.We would also like to thank David Mwangi, Charles Muchunku, Tom Ogol and Michelle Paula Akute fortaking the time to meet us and for sharing your expertise.We also want to express our gratitude to SIDA and ÅForsk for financing our minor field trip to Kenya.It was an inspiring experience and we have learnt a lot.ii
TABLE OF CONTENTSABSTRACT . ISAMMANFATTNING . IACKNOWLEDGEMENT . IILIST OF FIGURES . IVLIST OF TABLES . IVABBREVIATIONS. VLIST OF UNITS . V1. INTRODUCTION . 11.1 BACKGROUND . 11.2 OBJECTIVE . 21.3 RESEARCH QUESTIONS. 21.4 STUDY BOUNDARIES. 22. METHODOLOGY. 32.1 SCENARIOS. 32.2 CALIBRATION OF MODELS . 42.2.1 ONSSET . 42.2.2 OSEMOSYS . 52.2.3 WEAP . 72.3 MODELLING PROCESS. 83. RESULTS . 93.1 SPLIT OF HOUSEHOLD ELECTRIFICATION SOLUTIONS . 93.2 OPTIMAL ENERGY MIX FOR ELECTRICITY GENERATION TO THE NATIONAL GRID IF KENYA VISION 2030 IS ACHIEVED 103.3 IMPACTS ON HYDROPOWER ELECTRICITY GENERATION IN 2030 IF CLIMATE FOLLOWS REPRESENTATIVECONCENTRATION PATHWAY 8.5. 114. DISCUSSION . 125. CONCLUSIONS . 136. RECOMMENDATIONS FOR FUTURE WORK . 13REFERENCES . 14APPENDIX 1 – CAPITAL COST FOR ONSSET OFF-GRID TECHNOLOGIES . AAPPENDIX 2 – ENERGY CARRIERS IN THE REFERENCE ENERGY SYSTEM . AAPPENDIX 3 – TECHNOLOGIES IN THE REFERENCE ENERGY SYSTEM . BAPPENDIX 4 – DATA COLLECTION OSEMOSYS MODEL . EAPPENDIX 4.1 – TIMESLICES OSEMOSYS. EAPPENDIX 4.2 – TECHNOLOGY COSTS .FAPPENDIX 4.3 – TECHNOLOGY PERFORMANCE. Giii
APPENDIX 4.4 – CAPACITY FACTORS WIND . HAPPENDIX 4.5 – RESIDUAL CAPACITY . IAPPENDIX 4.6 – TOTAL ANNUAL MIN CAPACITY INVESTMENT (GW) . JAPPENDIX 4.7 – SPECIFIED DEMAND PROFILE . JAPPENDIX 4.8 – TECHNOLOGY ACTIVITY . KAPPENDIX 4.9 – EMISSION ACTIVITY RATIO . KAPPENDIX 5 – EVAPOTRANSPIRATION AND PRECIPITATION IN KENYA 2030 IN RCP 2.6 AND 8.5 . LAPPENDIX 6 – INTEGRATION OF MODELS . MAPPENDIX 6.1 – CALCULATION OF SPECIFIEDANNUALDEMAND . MAPPENDIX 6.2 – CALCULATION OF GRID PRICE. MAPPENDIX 6.3 – CALCULATION OF CAPACITY FACTORS . MLIST OF FIGURESFIGURE 1 – THE CLEWS FRAMEWORK. 2FIGURE 2 – INTERLINKAGE OF THE MODELS . 3FIGURE 3 – THE OSEMOSYS TIMESLICES . 5FIGURE 4 – REFERENCE ENERGY SYSTEM. 6FIGURE 5 – KENYA’S RIVER BASINS AND THE WEAP SCHEMATIC OF THE TANA RIVER BASIN (MOKSNES ANDHOWELLS, 2016) . 7FIGURE 6 – PRECIPITATION AND EVAPOTRANSPIRATION DATA FOR RCP 2.6 AND RCP 8.5. 7FIGURE 7 – THE MODELLING PROCESS . 8FIGURE 8 – ONSSET MAP WITH THE OPTIMAL SPLIT OF HOUSEHOLD ELECTRICITY SOLUTIONS IN THE VISIONSCENARIO . 9FIGURE 9 – ELECTRICITY PRODUCTION BY SOURCE IN 2030 IN VISION COMPARED TO BAU . 10FIGURE 10 – OSEMOSYS RESULTS FOR VISION TIMELINE OF INSTALLED CAPACITY, ELECTRICITY GENERATION BYENERGY SOURCE AND COMPARISON TO BAU . 10FIGURE 11 – REDUCTION OF ELECTRICITY PRODUCTION BY HPP AND THE EFFECTS ON THE TOTAL ENERGY MIXAT VISION-DEMAND . 11FIGURE 12 – THE CAPACITY FACTORS FOR KAMBURU, KIAMBERE, KINDARUMA AND MASINGA HPPS IN 2030 INRCP 2.6 AND RCP 8.5 . 11LIST OF TABLESTABLE 1 – DEFINITION OF SCENARIOS: VISION, VISION – CLIMATE CHANGE AND BAU . 4TABLE 2 – COMPARISON OF THE COST OPTIMAL SPLIT OF ELECTRICITY SOLUTIONS IN VISION AND BAUSCENARIOS . 9iv
, Land-use, Energy and WaterCarbon dioxideGreenhouse gasesHPPLCOEHydro Power PlantLevelized Cost Of ElectricityOnSSETOSeMOSYSOpen Source Spatial Electrification ToolOpen Source Energy Modelling SystemPGTMPPPPVRCPSDGsTEMBAWEAPPower Generation and Transmission Master PlanPower PlantPhotovoltaicRepresentative Concentration PathwaySustainable Development GoalsThe Electricity Model Base for AfricaWater Evaluation And Planning systemLIST OF UNITSGWGWhhhkWhkWh/hh/yearMtCO2eqMWUSDGigawatt (109 W)Gigawatt-hour (106 kWh)HouseholdKilowatt-hourKilowatt-hour per household per yearMillion tonnes of CO2-equivalentsMegawatt (106 W)US Dollarsv
1. INTRODUCTION1.1 BACKGROUNDEnergy poverty is declared to be one of the main problems that sub-Saharan Africa is facing. In 2014,more than 620 million people in sub-Saharan Africa didn’t have access to electricity in their homes(International Energy Agency 2014). “To ensure access to affordable, reliable, sustainable and modernenergy for all” is the 7th (UNDESA 2016) of The Sustainable Development Goals (SDGs), agreed uponby world leaders in 2015 as a part of The 2030 Agenda – a global action plan for people, planet andprosperity (United Nations 2016). The Government of Kenya has declared the target to reach universalaccess to electricity by 2020 (The Government of Kenya 2007). In 2015, the percentage of electrifiedhouseholds was 46 % (Power Africa 2016), compared to 23 % in 2012 (The World Bank 2012). The rateof new grid connections is high, partly thanks to the rural electrification programme “The Last MileConnectivity Project” (African Development Bank Group 2017), carried out by The AfricanDevelopment Bank, The Government of Kenya and The World Bank to supply households withelectricity from on- and off-grid electricity solutions (Ministry of Energy 2016).Increasing access to energy has positive effects on other SDGs since it is closely linked to economic andsocial development (UNDESA 2016). Achieving the goal of universal access to electricity is crucial tocarry out Kenya’s long-term national planning strategy, Kenya Vision 2030, containing ambitious goalsfor economic, social and political development. The main vision is to transform Kenya into “a newlyindustrializing middle-income country providing a high-quality life to all its citizens by the year 2030”(The Government of Kenya 2007). Kenya’s population is estimated to increase from 46 million to 65.4million in the years 2015-2030 (The World Bank Group 2017a) and the electricity consumption isforecasted to increase with 315 % during that period in case Kenya Vision 2030 and universal access toelectricity are achieved (International Energy Agency 2017). This implies that Kenya’s electricity sectormust develop to meet a much higher demand and there are several flagship projects for electricitygeneration planned (Ministry of Energy and Petroleum 2016).Historically, hydropower has been the most used source for electricity generation in Kenya (IEA 2017).Today, the reliability of hydropower is questioned (Wahome 2013) as periods of droughts haveaffected the output of hydropower plants (HPPs) the last years (Ministry of Environment and NaturalResources 2016). Climate change impacts the patterns of rainfall and temperature, causing periods offloods and droughts (Ministry of Environment and Mineral Resources 2013). Kenya has a highvulnerability to these fluctuations in water availability since it destroys livelihoods and causes hunger(Kenya National Bureau of Statistics 2014), disease and even death (National Drought ManagementAuthority 2013). Access to clean drinking water (SDG6) and security in food supplies (SDG2) cannot beendangered when expanding the energy system. Water can’t be replaced when it comes to drinkingand irrigation. Meanwhile, Kenya has a good potential to use energy from wind and sun as well asgeothermal energy located in the Rift Valley (Energy Regulatory Commission 2012) for future electricitygeneration to replace hydropower if that is necessary.1
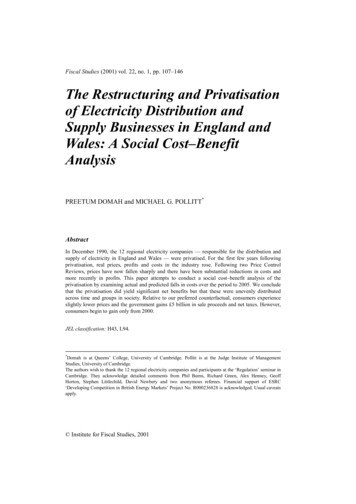
In this study the Climate, Land-use, Energy and Water strategies (CLEWs)framework has been applied to model the nexus of these naturalresources in Kenya (Figure 1). The idea behind CLEWs is that the naturalresources of land, energy and water are highly integrated and that theexploitation of them contributes to climate change, meanwhile they areall highly vulnerable to it. The interlinkages between those systems mustbe considered to develop consistent strategies and ensure an efficientresource management (Bazilian et al. 2011; Howells et al. 2013).ClimateWaterand LandEnergyFIGURE 1 – THE CLEWSAs a part of our work with this Bachelor’s thesis, we have conducted aFRAMEWORKfield study in Nairobi. We met professionals in Kenya’s energy sector1 toask for their opinions on the main challenges for Kenya’s electricity generation. Some of themexpressed concern about the risk of overestimating the future demand, since previous demandforecasts for Kenya has regularly been too optimistic (Ministry of Energy and Petroleum 2016). Kenyahas the goal to sustain a yearly GDP growth of 10 % (The Government of Kenya 2007) to achieve KenyaVision 2030. There is a risk of overestimating the need of capacity investments if demand-prognosesare based on a correlation with the 10 % GDP growth (Power Africa), since this is a very ambitious goalcompared to earlier GDP growth in Kenya (varying in the range 0.2 % to 8.4 % in the period 2001-2014(The World Bank Group 2014)). The World Bank projects the GDP growth in Kenya to be 5.8 % in 2018and 6.1 % in 2019 (The World Bank Group and Kenya Economic Roundtable 2017).1.2 OBJECTIVEThe objective of this study is to investigate how the choice of demand estimation for 2030 and theclimate change affects the energy mix for electricity generation in Kenya.1.3 RESEARCH QUESTIONS1. How does the size of electricity demand forecasted for Kenya Vision 2030 change the optimalsplit of household electrification solutions based on spatial electrification analysis, comparedto a BAU demand?2. How does the size of electricity demand forecasted for Kenya Vision 2030 change the costoptimal energy mix for on-grid electricity generation compared to a BAU demand?3. What impact will climate change according to RCP 8.52 have on the electricity generation fromhydropower in Tana River by 2030 and what are the effects on the on-grid electricitygeneration mix?1.4 STUDY BOUNDARIES Kenya’s electricity system is modelled. No electricity trade with neighbouring countries hasbeen included.This study investigates a simplification of reality where only households are given thepossibility to get electricity from off-grid solutions.The optimization in this study runs from year 2015 till year 2030.The impacts of climate change have only been modelled for the HPPs in the Tana river basin.1The professionals that we have talked to about the development of Kenya’s electricity generation is:Maria Stridsman - Swedish Embassy in NairobiBoniface Kinyanjui – Chief Engineer, Generation Planning at Kenya Power and Lightning CompanyDavid Mwangi – Senior Energy ConsultantCharles Muchunku – Independent Renewable Energy Consultant2 RCP is short for Representative Concentration Pathway. The scenario RCP 8.5 is a worst-case scenario of climate changewhere the concentration of greenhouse gases don’t stagnate within the 21th Century (Riahi, Grübler, and Nakicenovic 2007).2
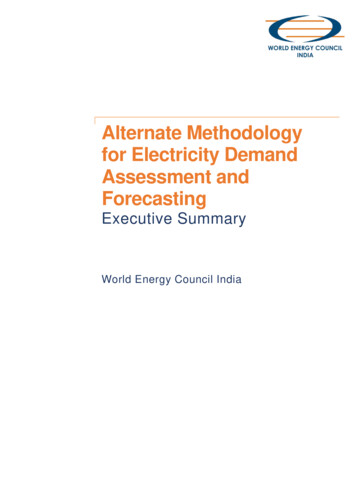
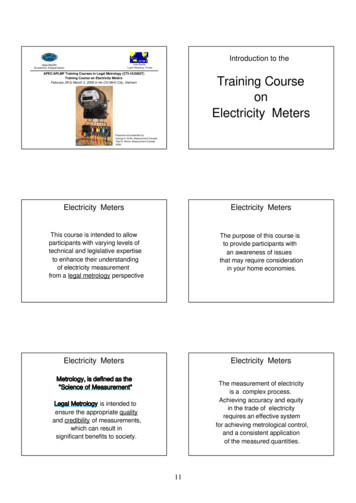
2. METHODOLOGYAn electricity demand for development in accordance with Kenya Vision 2030 (Vision) was comparedto a lower demand based on development following historical growth, referred to as BAU. Twoextremes of climate change scenarios, RCP 2.6 (van Vuuren et al. 2007) and RCP 8.5 (Riahi, Grübler,and Nakicenovic 2007), were applied to the scenario with Vision-demand.Three modelling softwares were used to investigate what mix of electricity generation sources Kenyashould aim to have in 2030, taking into account the nexus of Climate, Land, Energy and Water (Howellset al. 2013; Bazilian et al. 2011) (Figure 2). Energy was modelled in the Open Source SpatialElectrification Tool (OnSSET) (Mentis et al. 2015) and in The Open Source Energy Modeling System(OSeMOSYS) (Howells et al.OnSSET2011). Water and Land-use weremodelled in the Water Evaluationand Planning tool (WEAP) (SieberGrid costGrid electricityof electricitydemand2017), using an existing model ofthe Tana catchment (MoksnesCO2 emissonsOSeMOSYSand Howells 2016). To includeClimate in the nexus assessment,Demand fromthis model was extended withConstraints forhydro power plantsRCP-specific precipitation andhydropowerevapotranspiration data to seehow climate change affects theWEAPhydrology in the Tana river, andTemperaturethereby the capacity factors of itsRainhydropower plants in 2015-2030.FIGURE 2 – INTERLINKAGE OF THE MODELS2.1 SCENARIOSIf Kenya Vision 2030 is achieved, the national electricity demand is expected to increase rapidly,starting at 7655 GWh in 2015 (IEA 2017). In the Power Generation and Transmission Master Plan(PGTMP) a similar Vision-scenario is investigated and they project a demand of 39 260 GWh in 2030(Ministry of Energy and Petroleum 2016). That demand prognosis is used in the Vision scenario. Theaverage electricity consumption per household and year was set according to Tier 3 (695 kWh/hh/year)following Nerini et al. (Nerini et al. 2016). This level of electricity consumption is enough to power awashing machine, computer and lights – a set of household appliances that can be argued necessaryto provide all citizens ”a high-quality life” (Rosling 2010), which Kenya aims to achieve by 2030 (TheGovernment of Kenya 2007). A BAU scenario with a lower level of national electricity demand wascreated to put the Vision scenario in a context. The electricity demand in BAU was set to 27 366 GWh(collected from the reference-scenario in PGTMP) (Ministry of Energy and Petroleum 2016), followinghistorical trends of growth in Kenya. The household electricity consumption was set to 484kWh/hh/year, assuming that residential electricity demand in BAU represents the same share of thetotal national electricity demand as in Vision. Both scenarios are based on that universal access toelectricity is achieved in Kenya before 2030.To understand the impact of climate change, two different scenarios of future climate were studied.The smallest possible climate change was used as a reference with a projected peak of global emissionsof greenhouse gases (GHGs) before year 2020, following the Representative Concentration Pathways2.6 (van Vuuren et al. 2007). RCP 2.6 implies an increase of global mean temperature limited to twodegrees Celsius (Symon 2013) and is in line with trends of flat emissions of greenhouse gases the past3
years (International Energy Agency 2016). This scenario was compared to a scenario of extreme climatechange with climate data from RCP 8.5 where the concentration of GHGs is not expected to stagnatewithin the 21th Century (Riahi, Grübler, and Nakicenovic 2007).The demand levels were combined with climate predictions into three research scenarios: Vision,Vision – Climate Change and BAU. Their characteristics are presented in Table 1.TABLE 1 – DEFINITION OF SCENARIOS: VISION, VISION – CLIMATE CHANGE AND BAUSCENARIO:NATIONAL ELECTRICITYDEMAND 2030VISIONVision demand39 260 GWhVISION - CLIMATE CHANGEVision demand39 260 GWhBAUBAU demand27 366 GWh695 kWh695 kWh484 kWhRCP 2.6RCP 8.5RCP 2.6HOUSEHOLD ELECTRICITYCONSUMPTION 2030CLIMATE SCENARIO2.2 CALIBRATION OF MODELS2.2.1 ONSSETThe Open Source Spatial Electrification Tool (OnSSET) is developed by KTH Royal Institute ofTechnology in collaboration with UNDESA as a part of reaching the goal of universal access to electricityglobally (Mentis et al. 2015). It calculates an optimal split of on-grid, mini grid and standaloneelectrification solutions for unelectrified households to reach a target level of electricity consumption,comparing the Levelized Cost Of Electricity (LCOE) (Nerini et al. 2016). OnSSET takes localcharacteristics such as population density, distance to transmission lines and available energy sourcesinto account, and investments are made in a single timestep over the whole modelling period.The cost optimization tool OnSSET (Mentis et al. 2015) was used to calculate the split of householdelectrification technologies and the electricity demand on the national grid in the scenarios of Visionand BAU demand. The household electrification technologies included in this optimization were:national grid; mini grids of diesel, hydro, solar photovoltaic (PV) and wind; standalone diesel and solarPV. The modelling period in OnSSET was 2015-2030. At the start of this period, 46 % of the householdshad access to on-grid electricity (USAID 2017), and by 2030, universal access shall be achievedaccording to SDG7 (UNDESA 2016). In 2015-2030 the population will grow from 46.1 million to 65.4million (The World Bank Group 2017a), the urban ratio increase from 25.6 % to 32.97 % (The WorldBank Group 2017b) and the number of people per household is 4.4 (Michael Bauer Research 2015).For the national grid a capacity investment cost of 1935 USD/kW (KTH-dESA 2017), an existing gridcost ratio of 0.1 (KTH-dESA 2017), a base-to-peak ratio of 0.38 (KPLC 2016) and losses at an average of14.75 % (KPLC 2017) were used. An initial grid price of 0.052 USD/kWh was assumed before calculatingscenario-specific grid price from OSeMOSYS. The diesel price used was 0.760928 USD/liter, calculatedas an average over the modelling period (Ministry of Energy and Petroleum 2016). The capital costs forthe off-grid electrification technologies used are presented in Appendix 1.4
2.2.2 OSEMOSYSThe Open Source Energy Modelling
River and thereby the electricity generation from its hydro power plants. Results show that the share of grid connected households increase with a higher demand forecast, that the investment cost of meeting the electricity demand of Kenya Vision 2030 is 106 % higher than the investment cost at BAU