Transcription
Annual survey report 2011in partnership with2011ABSENCEMANAGEMENT
2011CONTENTSFOREWORD2ABOUT US4SUMMARY OF KEY FINDINGS5RATES OF EMPLOYEE ABSENCE916CAUSES OF ABSENCE18WORK-RELATED STRESS23MANAGING ABSENCE26RETURN TO WORK VERSUS TURNOVER FROM ILL HEALTH35EMPLOYEE WELL-BEING38EMPLOYEE ABSENCE AND THE ECONOMIC CLIMATE42CONCLUSIONS44BACKGROUND TO THE SURVEY46FURTHER SOURCES OF INFORMATION50ACKNOWLEDGEMENTS51ABSENCE MANAGEMENT 2011THE COST OF ABSENCE1
ABSENCE MANAGEMENTFOREWORDWelcome to the twelfth edition of our Absenceuncertain environment, particularly in the publicManagement survey report in partnership withsector where many organisations we surveyed areSimplyhealth. As in previous years, we provideanticipating redundancies. Furthermore, this year,useful benchmarking data for organisations onfor the first time, we found stress to be the mostabsence levels and the cost and causes of absence,common cause of long-term absence, making anas well as a focus on employee well-being. Ineven stronger case for action.addition, we report on the topical questionswe asked about the abolition of the DefaultWe feature Kent County Council as a caseRetirement Age and levels of turnover due to illstudy in this report, identifying the key factorshealth, and we continue to track the effect of thethat underpin the success of their approach toeconomic climate on employee absence.attendance management and how they are activelypromoting health and well-being. They take aComparing this year’s survey results with those ofholistic approach to ensure a positive attendanceprevious years suggests that the economic climate hasculture is firmly embedded in the council.a considerable effect on employee absence, affectingabsence levels, the prevalence of reported stressSickness absence has also been a significant focusand mental health problems, and the number offor policy-makers over the last few months withemployees coming to work ill. Our results show that itthe launch in February 2011 of the Government-is therefore imperative to manage absence effectively,commissioned independent review on this subject.regularly reviewing the suitability of approaches.The review, jointly chaired by David Frost, formerlyReassuringly, this year’s results show thatdirector general of the British Chambers oforganisations are taking a proactive approachCommerce, and Dame Carol Black, National Directorto absence management overall, responding tofor Health and Work, is exploring radical new waysthe need to constantly reassess their absencein which the current system can be changed to helpmanagement policies, particularly in view ofmore people stay in work and reduce costs.the economic climate. For example, many r organisations have further increased theirThe CIPD has been closely involved in the reviewfocus on employee well-being, in response to theand the data from the Absence Management surveyconsiderable organisation change and uncertaintyseries has helped inform it.faced, despite reduced budgets.We will be feeding our views into the GovernmentHowever, there is still more that can be doneonce the recommendations from the review haveand this report refers to some of the challengesbeen published.organisations are facing now and anticipating overthe next year. A focus on well-being and activeDr Jill Millerhealth promotion is essential given the prevailingResearch Adviser, CIPD
2011Simplyhealth is delighted to partner with theThe survey provides us with insights that invite us toCIPD for a second year to bring you the Absenceask what more employers can do to get employeesManagement survey report. We believe that healthback to work quickly and to keep those at workis the most important thing of all and that employermotivated and engaged.health and well-being strategies play a fundamentalrole in the management of absence. The surveyGill Phippsoffers us, as HR professionals, insights that help us toHR Policy Manager, Simplyhealthdevelop a strategy to keep absence at a sustainablelevel and enable our employees to manage theirhealth and well-being.The current economic climate is presenting additionalchallenges as employers try to adapt to the difficulteconomic conditions. They often have to make quickdecisions, which means that organisational changecan take place rapidly and more frequently, leavingemployees feeling the pressure.In addition, their own household budgets are beingsqueezed, pay rises are now less likely, and the priceof food and household bills continues to rise. Thismeans that the potential for employees to sufferfrom stress is ever greater.The fact that stress is a key cause of absence perhapssuggests that its symptoms are not being identifiedquickly enough. Alternatively, it could be thatemployees are masking their symptoms so as notto draw the attention of their employer. Many areconcerned about keeping their jobs and do not wantBy taking a proactive approach, employers canreduce absence levels by educating employees andintroducing offerings which enable early detectionof health issues along with quick access to treatmentand support.ABSENCE MANAGEMENT 2011to ask for help.3
ABSENCE MANAGEMENTABOUT USCIPDSimplyhealthThe Chartered Institute of Personnel andDevelopment (CIPD) is the world’s largest charteredAt Simplyhealth we focus on healthcare, soHR and development professional body. As aindividuals and businesses can rely on us for ourglobally recognised brand with over 135,000specialist knowledge. We’ve been helping peoplemembers, we pride ourselves on supporting andaccess affordable healthcare for nearly 140 years.developing those responsible for the managementWe now help 2 million people with their healthand development of people within organisations.and 11,000 companies choose us as their healthcareprovider. Our corporate clients include the John LewisOur aim is to drive sustained organisationPartnership, British Airways, Royal Mail and Tesco.performance through HR, shaping thinking, leadingpractice and building HR capability within theWe offer private medical insurance, health cashprofession. Our topical research and public policyplans, dental plans and self-funded health plansactivities set the vision, provide a voice for theto help people with their everyday health and getprofession and promote new and improved HR andcover for the unexpected.management practices.We’re committed to delivering exceptional personalWe know what good HR looks like and what HRcustomer service and go out of our way to do theprofessionals need to know, do and deliver atright thing, not the easy thing. We were recentlydifferent stages of their career, be they specialists ornamed Best Private Health Provider at the Consumergeneralists, working in the UK or internationally.Moneyfacts Awards.We offer:We also care about our communities and last year membershipdonated 1.6 million to local causes and national professional development includingcharities.qualifications and training networking opportunities and world-class eventscipd.co.uk/2011absencemanagementsurvey4 expertise in HR capability-building andconsultancy services topical insights and analysis a wealth of resources and a voice for HR.cipd.co.uksimplyhealth.co.uk
2011SUMMARY OF KEY FINDINGSThis report sets out the findings of the CIPD’s twelfth nationalsurvey of absence management trends, policy and practice. Theanalysis is based on replies from 592 organisations across theUK, employing a total of nearly 2 million employees.Absence levelsOverall, more organisations report their absenceMost organisations record their annual employeelevels have decreased (41%) compared with theabsence rate, with larger organisations and theprevious year than said it has increased (27%). One-public sector most likely to do so.third report it has remained the same. The publicsector was most likely to report their absence levelsThe average level of employee absence remainshave improved compared with the previous year.at the 2010 level of 7.7 days per employee peryear; however, there is high variation acrossThe majority of respondents, particularly in theorganisations, with some reporting extremely highpublic sector, believe it is possible to reduce absence.levels of absence.Length of absenceThe average level of absence remains highest inTwo-thirds of working time lost to absence isthe public sector at 9.1 days per employee peraccounted for by short-term absences of up toyear, a decrease of 0.5 day from 2010. This yearseven days.the public sector figure is nearly matched by thelevel of absence in the non-profit sector at 8.8A larger proportion of manual workers’ absencedays per employee.is long term compared with their non-manualcounterparts.Absence is lowest in the private sector, particularly inAs found in previous years, a higher proportionlevels have reduced in comparison with previousof absence in the public and non-profit sectors isyears (5.7 days compared with 6.9 days in 2010). Indue to long-term absences of four weeks or longercontrast, average absence levels have increased incompared with the private sector, where nearlythe private services sector (2011: 7.1 days; 2010: 6.6three-quarters of absence is short term.days), although there is particularly high variationwithin this sector.Smaller organisations are more likely to attributea higher proportion of their absence to short-termAs in previous years, we found that overall, largerorganisations have higher average levels of absencethan smaller organisations, although this trend isnot reflected in the public sector.leave compared with larger organisations.ABSENCE MANAGEMENT 2011manufacturing and production organisations, where5
ABSENCE MANAGEMENTCost of absencemanual workers while stress is more common forFewer than half of employers monitor the cost ofnon-manual workers.absence. The public sector and larger organisationsare most likely to do so.Stress is particularly common in the public and nonprofit sectors.The average annual cost of employee absence peremployee varies considerably across organisations,Work-related stresspartly because they include different costs inNearly two-fifths of employers overall (50% in thetheir calculations. The median cost of absencepublic sector) report that stress-related absence hashas increased compared with last year ( 673 perincreased over the past year.employee per year compared with 600 in 2010).The top causes of stress at work are workloads,The public and non-profit sectors report higher costsmanagement style, non-work factors such asof absence per employee than the private sector.relationships and family, relationships at work andThe median annual cost per employee in the publicconsiderable organisational change/restructuring.sector is 800 and in the non-profit sector it is 743compared with 446 in private services and 444 inJob insecurity is a more common cause of stress inthe production and manufacturing sector.the public sector this year compared with last yearand is higher there than in the private or non-profitCauses of absencesectors.Minor illnesses (such as colds, flu, stomach upsets,headaches and migraines) are by far the mostThree-fifths of organisations are taking steps tocommon cause of short-term absence.identify and reduce stress in the workplace. As inprevious years, public services employers are mostMusculoskeletal injuries, back pain and stress are thelikely to be proactively managing stress; however,next most common causes of short-term absence.the proportion doing so has fallen in comparisonStress is more common for non-manual workers,with previous years.while musculoskeletal injuries and back pain aremore common for manual workers.Popular methods to identify and reduce workplacestress include using staff surveys, training forHome/family responsibilities are in the top fivemanagers/staff and flexible working options/most common causes of absence for two-fifths ofimproved work–life mentsurvey6Managing absenceAs last year, approximately one in five employersAlmost all organisations surveyed have a writtenreport that absences not due to genuine ill healthabsence/attendance management policy.rank among the top five most common causesof short-term absence for both manual and non-Just over half have introduced changes to somemanual workers. Non-genuine absence is reportedlyaspect of their approach in the last year, withmost common in private services organisations.public sector organisations most likely to havemade changes.The most common causes of long-term absence arestress, acute medical conditions (for example stroke,Overall, just under half of employers have a target inheart attacks and cancer), musculoskeletal injuries,place for reducing employee absence, although thismental ill health and back pain. Musculoskeletalrises to 71% in the public sector.injuries and back pain are particularly common for
2011The most common methods used to manageMost organisations report that the abolition ofshort-term absence are return-to-work interviews,the DRA will have no impact on their provisions oftrigger mechanisms to review attendance, givingprivate medical insurance to employees.sickness absence information to line managers anddisciplinary procedures for unacceptable absence.Return to work versus turnover from ill healthNearly three-fifths of employers report that noThe most common methods used to manageemployees had left their organisation due to illlong-term absence are return-to-work interviews,health in the last 12 months. A small proportionoccupational health involvement and giving sickness(7%) had lost more than 10% of employees due toabsence information to line managers, followed byill health.trigger mechanisms to review attendance and riskassessments to aid return to work.Two-thirds of organisations report that all theiremployees who left in the last 12 months due toLine managers take primary responsibility forill health left after the first 28 weeks of absence.managing short-term absence in two-thirds ofFewer than one in ten report that all employees whoorganisations overall and more than three-quartershad left due to ill health had left during the first 28in the public sector. They take responsibilityweeks of absence.for managing long-term absence in 55% oforganisations overall (73% of the public sector).Two-fifths of employers report that everyone wholeft during the first 28 weeks of absence did soPrivate sector employers are much more likely tovoluntarily, while one-fifth report all who left wererestrict sick pay than the public sector. They are alsodismissed and a small minority (5%) that all tookmore likely to offer private medical insurance andearly retirement. After the first 28 weeks of absenceattendance bonuses or incentives.leavers were less likely to leave voluntarily.The public sector (and to a lesser extent the non-profitEmployee well-beingsector) are more likely to use a range of methodsTwo-thirds of the public sector and one-third of theaimed at promoting good health and flexibility andprivate sector have an employee well-being strategyare more likely to report that attendance is drivenin place.by the board. Nevertheless, fewer public sectororganisations are using stress counselling to manageThe most commonly provided well-being benefitsabsence compared with last year.are access to counselling services, followed byemployee assistance programmes and stop smokingsupport.The majority of organisations believe the abolitionThe public sector are most likely to promote well-of the DRA will have no impact on their absencebeing through benefits to facilitate healthy lifestyles.levels, while a quarter believe it will increaseThe private sector are more likely to provideabsence.insurance for employees.One in six organisations report they will increaseOne-quarter of organisations report their well-their focus on well-being provisions as a result of thebeing spend has increased this year, while one in sixabolition of the DRA and three out of ten that theyreport it has decreased. Similar changes in the samewill increase their use of flexible working practices asdirection are anticipated in 2012.a consequence.ABSENCE MANAGEMENT 2011Impact of the abolition of the DefaultRetirement Age (DRA) on absence7
ABSENCE MANAGEMENTPublic sector organisations are most likely to reporttheir well-being spend has decreased over the pastyear and anticipate further cuts in 2012.Organisations that evaluate their well-being spendare more likely to have increased their spend thisyear and are more likely to increase it in 2012compared with those who don’t evaluate.Employee absence and the recessionMore than two-fifths of public sector organisationsreport they will be making redundancies overthe next six months (and a further third thatredundancies are a possibility), compared with one insix in the private sector and a quarter of non-profits.Half of employers use employee absence records aspart of their criteria for selecting for redundancy.This figure rises to nearly three-quarters in themanufacturing and production sector.Over a quarter of organisations report an increasein people coming to work ill in the last 12 monthsand almost two-fifths have noted an increase inreported mental health problems. These issues aremore common in organisations that are anticipatingredundancies in the next six months.Over a quarter of organisations (two-fifths in thepublic sector) report they have increased their focuson employee well-being and health promotion as aresult of the economic context.cipd.co.uk/2011absencemanagementsurvey8
2011RATES OF EMPLOYEE ABSENCEAverage absence rates overall remain at the 2010 level of 7.7days per employee, per year. While, as in previous years, theabsence rate tends to be highest in the public sector, many in thissector have noted improvements compared with previous years.Most organisations now record their annualThere was considerable variation in the levels ofemployee absence rate, reflecting the relevanceabsence reported by organisations in this year’sof absence to productivity (2011: 81%; 2010: 82%;survey, with a few organisations reporting very2009: 70%; 2008: 72%). Larger organisationshigh absence levels (standard deviation 3.5%,are most likely to record this information, as areor 8.0 days, compared with 1.9%, or 4.3 days inthe public sector (92% compared with 85% of2010).2 In order to avoid a few extreme casesmanufacturing and production, 80% of non-profitsskewing the results, this year we report here onand 72% of private services organisations).1the 5% trimmed mean.3 Last year we reported thearithmetic mean because the standard deviationTable 1 shows that absence levels overall remainwas within acceptable limits.the same as in 2010 at 7.7 days per employee peryear (or 3.4% of working time).Table 1: Average level of employee absence, all employeesAverage working time lost per year(%)Average number of days lost peremployee per yearMeanStandarddeviation5% trimmedmeanMeanStandarddeviation5% trimmedmean2011: all employees3.83.53.48.78.07.7*2010: all employees3.41.93.27.7*4.37.4Base: 403 (2011); 429 (2010)*This year we are using the 5% trimmed mean because the large standard deviation shows there is high variation across organisations,with some reporting extremely high levels of absence. In 2010 we reported the arithmetic mean because the standard deviation waswithin acceptable limits, showing less variation in the level of absence reported by organisations. We have included both the meanand 5% trimmed mean in Table 1 for reference.ABSENCE MANAGEMENT 20119
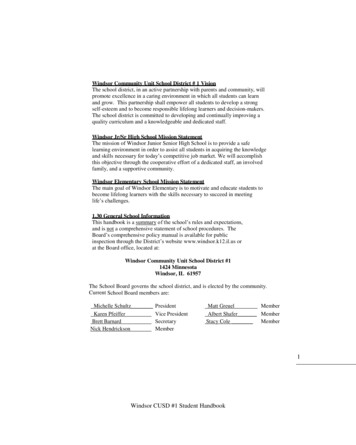
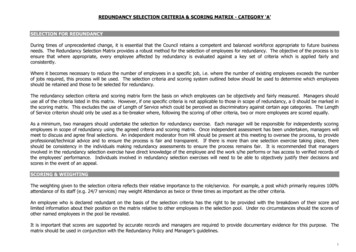
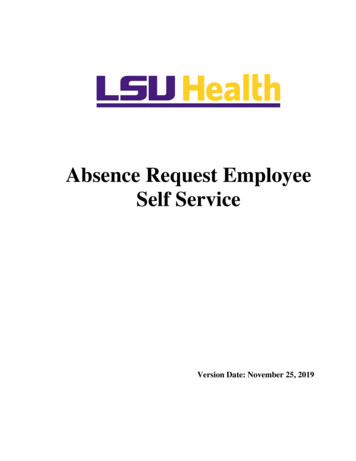
ABSENCE MANAGEMENTSector variationsis particularly high variation within this sectorThere is considerable variation in levels of employee(Table 3). Call centres, finance, insurance and realabsence across sectors (Table 2). As in previousestate, and transport, distribution and storageyears, the average level of absence remains highestorganisations were most likely to report higherin the public sector at 9.1 days per employee perabsence rates, although comparisons should beyear (2010: 9.6 days; 2009: 9.7 days; 2008: 9.8 days),treated with caution due to the small numberalthough this year it is nearly matched by the levelof responses in each industry. There is alsoof absence in the non-profit sector at 8.8 days (2010:considerable variation within sectors. For example,8.3 days; 2009: 9.4 days; 2008: 8.5 days).of the two call centres in our sample who recordedan absence level, one reported their averageAbsence levels are lowest in the manufacturingworking time lost per year was 4%, the other 48%.and production sector where they have reducedin comparison with previous years (2011: 5.7It is interesting to compare absence levels acrossdays; 2010: 6.9 days). In contrast, average absencesectors since 2008 (Figure 1), which suggestslevels have increased in the private services sectorthat changes in absence levels are reflecting the(2011: 7.1 days; 2010: 6.6 days), although thereeconomic climate.Table 2: Average level of employee absence, by sector for all, manual and non-manual employeesAverage working timelost per year (%)Number ofrespondentsAverage number of dayslost per employee per year5% trimmedmeanStandarddeviation5% trimmedmeanStandarddeviationAll employeesManufacturing and production532.51.15.72.5Private sector services1433.15.07.111.4Public services1384.02.49.15.5Non-profit uring and production242.71.26.22.8Private sector services242.35.65.312.9Public services72.82.66.46.0Non-profit ing and production242.03.54.68.1Private sector services462.22.95.06.6Public services193.42.27.84.9Non-profit ual otalNon-manual employeesTotal
2011Figure 1: Average number of days lost per employee per year by sectorAll employees2011201020092008Manufacturing and Private sector services2011201020092008Public services2011201020092008Non-profit 9.88.88.39.48.50246810Average number of daysABSENCE MANAGEMENT 201111
ABSENCE MANAGEMENTTable 3: Average level of employee absence, all employees by sector breakdownsAverageworkingtime lostper year(%)Averageworkingtime lostper year(%)Number of 5% trimmedrespondentsmeanManufacturingand productionPrivate ey12Mean5% trimmedmeanMean0––––Chemicals, oils 4.24.4Electricity, gas and water1N/A*2.8N/A*6.4Engineering, electronicsand metals92.32.35.25.3Food, drink and tobacco83.13.17.07.0General manufacturing42.82.86.36.3Mining and quarrying1N/A*3.5N/A*8.0Paper and r manufacturing/production162.42.45.55.5Professional services(accountancy,advertising, consultancy,legal, etc)232.12.44.75.4Finance, insurance andreal l centres2N/A*25.8N/A*58.8Media (broadcasting andpublishing, etc)2N/A*1.8N/A*4.0Retail and wholesale162.73.06.26.8Transport, distributionand storage143.73.98.48.92N/A*1.3N/A*3.0Other private services433.54.08.19.2Central lth424.64.810.610.9Local government374.24.89.610.9Other public services213.63.68.28.2Care services145.25.311.912.1Charity services163.43.87.88.6Housing association223.94.28.99.6Other voluntary173.23.47.47.7IT gedays lostper yearAgriculture and forestryHotels, catering andleisurePublic servicesAveragedays lostper year*With a low number of respondents, it is not meaningful to calculate the 5% trimmed mean.
2011Manual and non-manual absence levelsthat this relationship is strongest in the privatePrevious years’ surveys have found that manualsector and size has no significant impact onworkers have a higher level of absence than non-absence levels in the public or non-profit sectorsmanual workers. This year differences between(see Table 4a). Previously we have hypothesisedmanual and non-manual absence levels are notthat because people in smaller organisations tendsignificant, although findings here are limited byto work in smaller teams, their absence from workthe small number of organisations reporting bothis likely to be more disruptive and noticeable andmanual and non-manual levels of absence.this may serve as a deterrent. This is clearly not thecase, however, in the public sector. It appears moreThe effect of workforce sizelikely from this data that organisational culture,Our overall findings (Table 4) show a clearand perhaps the sick pay schemes on offer, whichrelationship between workforce size and levelsare more generous in larger organisations in theof absence,4 with larger organisations havingprivate sector and the public sector generally (seehigher average levels of absence than smallerTable 22 and Table 24), are more likely to accountorganisations. Further analysis, however, showsfor the effect of workforce size.Table 4: The effect of workforce sizeAverage working timelost per year (%)Average number ofdays lost per employeeper year (days)Number 34.02.39.25.35,000 464.21.99.64.2No. of UK employees1–49Table 4a: The effect of workforce size on absence levels by sectorAverage number of days lost per employee per year(5% trimmed mean)Private sectorservicesPublic ,9996.99.49.68.9–11.89.6–5,000 ABSENCE MANAGEMENT 2011Manufacturingand productionNo. of UK employees13
ABSENCE MANAGEMENTRegional breakdowndifferences across sectors (Table 6).5 Public sectorThere are no significant regional differences inorganisations, which had the highest levels ofemployee absence levels (Table 5).absence (Table 2), were most likely to reportimprovements, with more than half reporting theirChanges in levels of absence withinorganisationsabsence levels have decreased compared with justOverall two-fifths of organisations report aJust over a quarter of organisations across all sectorsdecrease in their levels of absence compared withreport an increase in absence levels.over a third of organisations from other sectors.the previous year, although there are significantTable 5: Average level of absence by regionAverage working time lostper year (%)Number ofrespondents5% trimmedmeanStandarddeviationEast Anglia153.93.38.97.4East Midlands164.42.310.05.3West Midlands213.11.67.23.6North-east of England173.83.68.68.1North-west of England403.22.87.26.3South-west of England373.28.17.318.4Yorkshire and Humberside233.82.48.75.5South-east of England(excluding 2.310.55.2823.33.37.47.4Northern IrelandIrelandWhole of UKcipd.co.uk/2011absencemanagementsurvey14Average number of days lostper employee per year (days)5% trimmedmeanStandarddeviationTable 6: Changes in levels of absence within organisations compared with the previous year (%)IncreasedDecreasedStayed the sameAll274132Manufacturing and production243739Private sector services273439Public services285517Non-profit organisations263935Base: 559
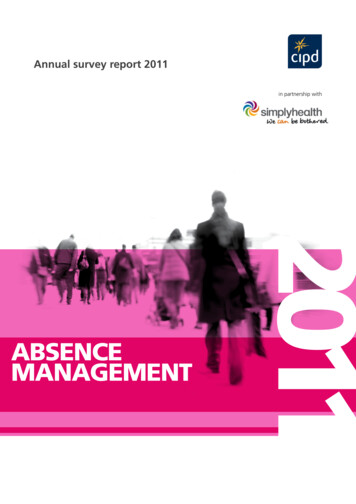
2011Most employers believe it is possible to furthernon-manual employees. A larger proportion ofreduce employee absence (81%). Only one in tenmanual workers’ absence is long term8 and a smallerdo not think it is possible (9% reported they don’tproportion is short term than their non-manualknow). As in previous years, the public sector is mostcounterparts.9likely to believe they can reduce employee absence(90% compared with 76% in the private sector).6Our findings also show, as in previous years, thatLarger organisations are also more likely to believea higher proportion of absence in the public andthey can reduce absence.non-profit sectors is due to long-term absences of7four weeks or longer (Table 7). In contrast, nearlyLength of absencethree-quarters of private sector absence is due toThere has been very little change in the lengthshort-term absence, compared with just over half inof employee absences over the past few years.the public sector.Overall, two-thirds of working time lost to absenceis accounted for by short-term absences of up toLength of absence is also related to workforce size.seven days. Absences of between eight days andSmaller organisations are more likely to attributefour weeks account for 16% of short-term absence,more of their absence to short-term leave thanand a similar proportion is caused by absences oflarger organisations.10 This relationship was observedfour weeks or longer (Table 7). Length of absencefor both private and public sector organisations.does, however, appear to vary across manual andTable 7: The average proportion of sickness absence attributed to short-, medium- and long-termabsence, by workforce size and industry sectorAll employeesManual employeesNumber ofrespondentsUp to seven days(%)Eight days up tofour weeks (%)Four weeks orlonger ic services86521829Non-profit �9991066116141,000–4,999535620255,000 29462034Non-manual employeesIndustry sectorManufacturing and productionPrivate sector servicesNumber of UK employeesABSENCE MANAGEMENT 20111–4915
ABSENCE MANAGEMENTTHE COST OF ABSENCEThe average annual absence costs per employee have increasedcompared with last year, although they vary considerably acrossorganisations. Fewer than half of employers monitor the cost ofabsence.As in previous years, fewer than half (2011: 42%;There is considerable variation in the reported2
a higher proportion of their absence to short-term leave compared with larger organisations. This report sets out the findings of the CIPD's twelfth national survey of absence management trends, policy and practice. The analysis is based on replies from 592 organisations across the UK, employing a total of nearly 2 million employees.