Transcription
Beef QQualityy and Yield GradinggASC 300
Beef Carcass Quality USDA Quality Grade– Skeletal Maturity– Marbling USDA Yield Grade– Ribeye Area– %KPH (kidney, heart, &pelvic fat)– HotH tCCarcass WWeighti ht– 12th Rib Fat Thickness
USDA Quality Grade Prediction of palatabilitypy(tenderness, juiciness,flavor) Skeletalk l l Maturity– Forensic Indicators– Ossification of ChineButtons– Color and Shape of RibBones– Fusion of Sacral Vertebrae Tenderness
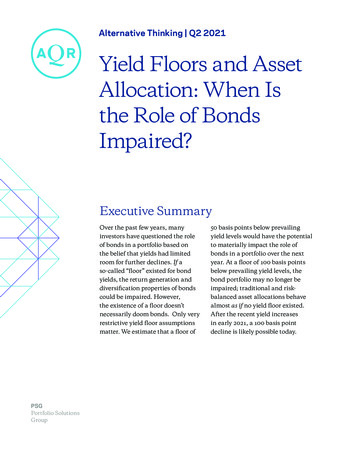
Skeletal MaturityA MaturityC MaturityD Maturity
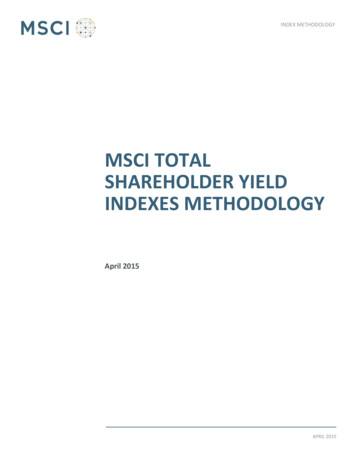
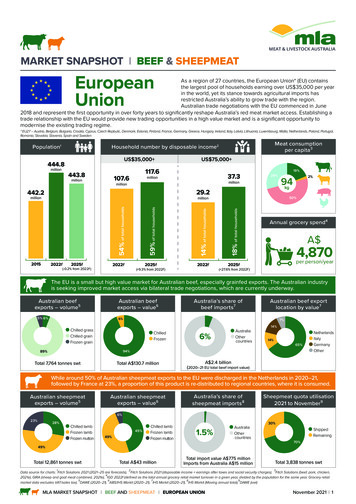
Color and Shape of Rib Bones
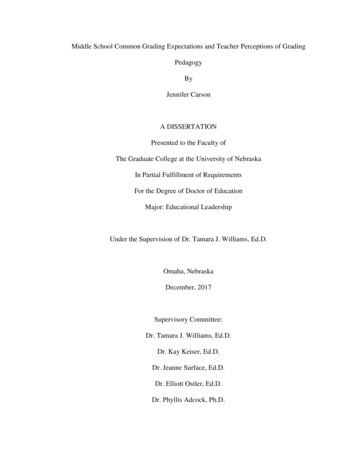
Fusion of Sacral Vertebrae
Skeletal MaturityMaturity ClassificationABCDEMonths of AgeAge**9 to 30 months of age30 to 422 monthsh off age42 to 72 months of age72 to 96 months of ageOver 96 months of age**These ages are only an estimation
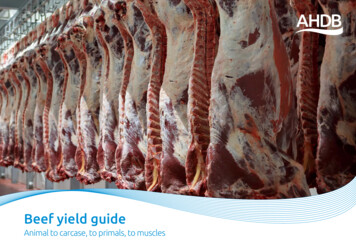
Prime PrimePrime‐Choice Choice Choice‐Select
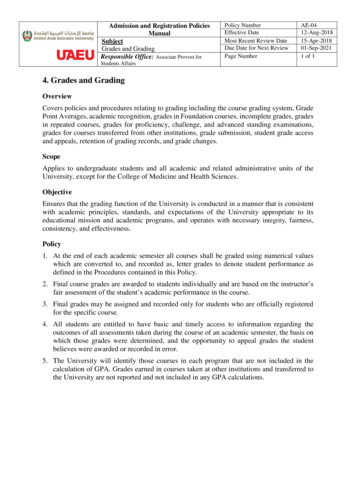
Branded Beef Program The success of CAB has ledto other branded beefprograms Certified Hereford Black Angus Beef (severalof these) ExcelExcel’ss Sterling Silver Tyson’s Chairman’sReserve Nolan Ryan’s Tender AgedBeef Laura’s Lean Kroger’s Private Selection
Kobe Beef
3546
79810
1112
Japanese Grading SystemGrade5 Excellent4 Good3 AverageA2 Below Ave1 PoorBMS No.8 ‐12125‐7343‐421
Comparing the grading systemsJapanese & USDA Beef Marbling Grade Comparison ChartUSDAQuality GradeUSDA MarblingGrade*JapaneseBMS NumberJapaneseQuality GradeN/AExtremelyAbundant 50 11 or 125N/AExtremelyAbundant 0-49105N/A/Veryy Abundant 509995N/AVery Abundant 04985Prime Abundant74Prime ModeratelyAbundant64Prime-Slightly Abundant53Choice Moderate43Choice Modest33Choice-SmallS l tSelectSli htSlightStandardTraces
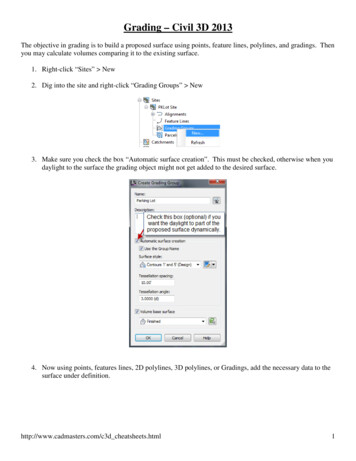
USDA Yield Grade Predicts the ppercentageg of boneless,, closelyytrimmed cuts from the ROUND, LOIN, RIB,and CHUCK 1, 2, 3, 4, & 5 Factors:– Ribeye Area– Hot Carcass Weight– % Kidney, Heart, and Pelvic Fat– Fat Depth at 12th Rib
Ribeye Area and 12th Rib Fat Depth
% Kidney, Heart, and Pelvic Fat
USDA Yield Grade Equation Yield Grade 2.5 (2.5 X Fat thickness) (0.2(0 2 X % KPH)) (0.0038 X HCW)‐ (0.32 X REA) ExampleFat 0.5 inKPH 3%HCW 800REA 13.52.5 (1.25) (0.6) (3.04) – (4.32) 3.07Final Yield Grade 3
Short Cut Method Fat Thickness at 12th ribFat thknsPYG0.02.00.12.250.22.50.32.750.43.00.53.25 RequiredqRibeyey 2.5
Short Cut Method % KPH%KPH4.03.53.0252.52.0151.5Adj 0.10.0‐0.1‐0.202‐0.3‐0 4‐0.4 Equationq Start with fat thickness Subtract Actual REA fromRRequiredi d REA anddmultiply by 0.3 If Actual REA is largerthan Required REAsubtract from fatthickness & vice versathickness, Adjust for %KPH Final YG
Short Cut MethodExample:pFat Thickness 0.3 2.75 PYGFat thickness 0.3700# Carcass 12.2 Required REAHCWT 700 lbs13.6 (Actual REA) – 12.2 (Required REA) 1.4Actual REA 13.61.4 x 0.3 0.42%KPH 2.0%2.75 – 0.42 – 0.3 (%KPH) 2.03 or 2 (Final YG)You try one:Fat Thickness 0.5HCWT 839#Actual REA 1212.33%KPH 3.0
Beef Yield Grade YG1.0151.52.0252.53.0353.5% Cuts 54.653 553.552.351 251.250.048 948.9 YG4.0454.55.0555.55.9% Cuts47.746 646.645.444 344.3 43.3
How do they affect each other? Ribeye area– Larger ribeyes cause YG to go down Fat Depth– More fat higher YG %KPH– Below 3.5% YG will go down Hot Carcass Weight– Heavier carcasses will cause a highergYG
?
Beef Carcass Quality USDA Quality Grade - Skeletal Maturity - Marbling USDA Yield Grade - Ribeye Area - %KPH (kidney, heart, & pelvic fat) - HtHo t Carcass WihtWeight - 12th Rib Fat Thickness