Transcription
Alternative Thinking Q2 2021Yield Floors and AssetAllocation: When Isthe Role of BondsImpaired?Executive SummaryPSGPortfolio SolutionsGroupOver the past few years, many50 basis points below prevailinginvestors have questioned the roleyield levels would have the potentialof bonds in a portfolio based onto materially impact the role ofthe belief that yields had limitedbonds in a portfolio over the nextroom for further declines. If ayear. At a floor of 100 basis pointsso-called “floor” existed for bondbelow prevailing yield levels, theyields, the return generation andbond portfolio may no longer bediversification properties of bondsimpaired; traditional and risk-could be impaired. However,balanced asset allocations behavethe existence of a floor doesn’talmost as if no yield floor existed.necessarily doom bonds. Only veryAfter the recent yield increasesrestrictive yield floor assumptionsin early 2021, a 100 basis pointmatter. We estimate that a floor ofdecline is likely possible today.
ContentsIntroduction3Model Description and Capital Market Assumptions4How Do Yield Floors Impact Expected Returns?7How Do Yield Floors Impact 3About the Portfolio Solutions GroupThe Portfolio Solutions Group (PSG) provides thought leadership to the broader investmentcommunity and custom analyses to help AQR clients achieve better portfolio outcomes.We thank Peter Hecht and Jason Mellone for their work on this paper. We also thank Antti Ilmanen,Thom Maloney, Daniel Villalon, Jordan Brooks, Jim Cavanaugh, Scott Richardson, Bill Latimer,Derek Jansma and Zachary Mees for their helpful comments.Table of Contents
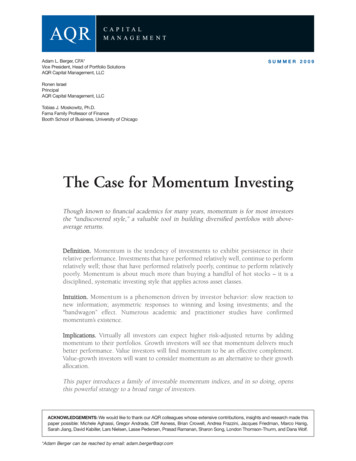
3Yield Floors and Asset Allocation: When Is the Role of Bonds Impaired? 2Q21IntroductionWhile government bond yields have risenwhether bonds can still generate an attractiverecently, developed market yields are stillreturn and provide diversification in theextremely low by historical standards (seefuture, possibly jeopardizing the role ofFigure 1). The low yield environment hasbonds in a traditional or risk-balanced assetput a bull’s eye on the back of bonds. For theallocation. So-called “bond substitutes” havepast few years, investors have questionedemerged to soothe this bond anxiety.1Figure 1: 10-Year Government Bond Yields, January 31, 1995 – March 31, 1720192021U.S.Source: Bloomberg, Reuters, AQR. Bonds are selected to represent the respective current or on-the-run 10-Year bond per country. Yieldsare gross of fees and t-costs.The goal of this paper is to map views onproperties are impaired. This paper shedsfuture bond yields into practical, actionablelight on this critical issue.guidance regarding asset allocation. We tryto constructively address one key source ofIt is important to remember that the extremelydebate: the implications of a yield floor. Whilelow yields observed during the 2020 pandemicsome investors believe that yields have limitedexacerbated, but did not start, concerns overroom for further drops, i.e. current levels arethe possible impact of bond yield floors.approaching a so-called “yield floor,” manyInvestors had similar concerns prior to 2020.struggle with identifying the point whereYields are higher today, but they are stilltheir yield floor view materially impacts assetlow and similar in magnitude to the levelsallocation in practice—the point where aobserved pre-pandemic. Furthermore, abond’s return generation and diversificationnegative economic shock could easily bring1We think this bond anxiety is overblown, and we have written extensively about it. A summary of our views is listed in the Appendix.
4Yield Floors and Asset Allocation: When Is the Role of Bonds Impaired? 2Q21yields back into 2020 territory, and investorscapabilities are approximately cut in half,need to be prepared.both in normal times and equity stressenvironments. At a floor of 100 basis pointsOnly very restrictive views impair the role ofbelow prevailing yield levels, the global bondbonds in a traditional or risk-balanced assetportfolio is no longer impaired; traditional andallocation. We estimate that a floor of 50 basisrisk-balanced asset allocations behave almostpoints below prevailing yield levels materiallyas if no yield floor existed. The yield increasesimpacts the role of bonds in a portfolio overin early 2021 make a 100 basis point declinethe next year. Under this restrictive view, thelikely possible today.global bond portfolio’s2 return-generatingModel Description and Capital MarketAssumptionsTo assess the impact of various yield floorin increments of 50 basis points (“distanceviews, we simulate monthly returns over a one-from the starting yield”): SY-50 bps, SY-100year investment horizon for three hypotheticalbps, SY-150 bps, SY-200 bps, and “No Floor.”portfolios: global bonds, traditional 60/40Unlike absolute yield floors, measuring yieldglobal stock/bond and a levered, risk-balancedfloors relative to the starting yield helps toglobal stock/bond portfolio.4 In each portfolio,ensure the results from the analysis will bethe bond allocation includes 10-year bonds inrelevant through time irrespective of futurethe following six countries in equal notionalbond yield movements. The process forproportions: US, UK, Germany, Japan,calculating the “yield-floor-adjusted” bondCanada, and Australia. Yield floors are definedreturn is described in Table 1.53relative to each country’s starting yield (“SY”)2345Throughout this paper, all references to a “Global Bond Portfolio” refer to an equal-notional-weight portfolio that is investedin US, German, Japanese, Australian, Canadian and UK 10-year bonds. The “Global Bond Portfolio” is rebalanced monthly toequal-notional-weight.The 60/40 portfolio is a synthetic, constant-notional-weight portfolio. The portfolio directly applies a weighting of 60% to the equityinvestment and 40% to the bond investment. The equity investment is represented by a random return series that is meant to emulatethe return characteristics of the MSCI World Hedged Net Index (WHANWIHD Index on Bloomberg). The global bonds are similarlyrepresented by the equal-notional-weight investment in a randomly generated return series which are meant to represent each of thesix country-bonds.The static weights of the risk-balanced portfolio are 178% and 43% in bonds and equities, respectively. The risk-balanced portfoliohas the same volatility as 60/40 stock/bond. All asset returns are USD hedged. USD hedged bond returns are achieved by subtractingthe beginning of month local one-month LIBOR and adding back US LIBOR. Monthly returns are assumed to be multivariate normal,an easy-to-understand and popular choice amongst investment practitioners. All yield curve moves are assumed to be parallel. Thefinancing rate for leverage is assumed to be equal to one-month T-Bills. This two-asset-class portfolio differs from typical risk parityportfolios in not including an inflation protection bucket.For each scenario (Eg: A scenario being “SY-0.5%”), we simulate 100,000 paths of 12 monthly returns per asset and execute thetransformation documented in Table 1. A “path” is a simulated matrix of data where each column represents an asset and each rowrepresents that asset-month’s simulated return. For example, for the US bond, we have 1 column and 12 rows for one year of monthlyreturns.
Yield Floors and Asset Allocation: When Is the Role of Bonds Impaired? 2Q215Table 1: Yield Floor Adjustment ProcessSTEP 1Simulate the monthlybond returnsassuming no yield floor.STEP 2STEP 3Back out the impliedyield change giventhe bond’s durationand convexity.If the implied endof month yield violatesthe yield floor, recalculatethe monthly bond returnassuming the end ofmonth yield equals theyield floor.The Capital Market Assumptions used in thepushing yields lower and possibly reachingsimulations are provided in Table 2. Globalthe yield floor. We estimate forward-lookingequities are assumed to have a 0.3 Sharpestock and bond volatility using the last-three-ratio. Bond expected returns are calculatedyear realized volatility.7 Correlations areassuming the current yield curve is the bestestimated using a similar approach with oneforecast of the year-ahead yield curve. Theexception: while the recent realized stock-key input to the yield floor analysis is bondbond correlation has been slightly negative, wereturn volatility. Volatile bonds are moreimpose a more neutral assumption of zero.86likely to experience large positive returns,678The main analysis was completed in Q1 2021 and used the yield curve as of January 29, 2021. The country starting 10-year yieldsare the following: Germany -0.52%, Canada 0.87%, Japan 0.05%, United States 1.09%, Australia 1.17% and United Kingdom0.32%. The country 1-month starting T-Bills are the following: Germany -0.63%, Canada 0.07%, Japan -0.09%, United States0.05%, Australia 0.02% and United Kingdom -0.05%. Given that the yield floors are defined relative to the starting yield, the specificyield curve date is less important. Also, the starting yield impacts the expected bond return assumption, and the expected return isn'tan important driver of the results. Bond volatility is the most important Capital Market Assumption for the yield floor analysis.We also calculate “stress” results using CMAs motivated by the volatile European debt crisis timeframe, October 2011. In thisenvironment, the global bond portfolio has a 6.6% volatility, which is approximately 60% higher than the current CMA. Details areavailable upon request.The stock-bond correlation isn't an important driver of the results. The forward-looking correlation is a function of the relative amountsof economic growth and inflation uncertainty. Periods of high economic growth uncertainty, such as the last decade, tend to leadto negative correlations while periods of high inflation uncertainty tend to lead to positive correlations. When economic growth andinflation uncertainty are similar in magnitude, the correlation is close to zero, which is consistent with the long-run evidence. Whilebeyond the scope of the analysis here, if the stock-bond correlation became meaningfully positive, this would lessen the diversificationbenefit of a fixed-income allocation but not negate it completely.
6Yield Floors and Asset Allocation: When Is the Role of Bonds Impaired? 2Q21Table 2: USD Hedged Capital Market Assumptions9AssetExpected Total ReturnVolatilitySharpeGerman 10-Year Bond0.9%4.7%0.19Canadian 10-Year Bond1.2%5.7%0.20Japan 10-Year Bond0.8%1.8%0.39United States 10-Year Bond2.1%6.9%0.30Australian 10-Year Bond2.5%5.2%0.47United Kingdom 10-Year Bond1.1%4.5%0.24Developed Equities5.2%17.3%0.30Global Bonds1.4%4.2%0.3360/40 Portfolio3.7%10.5%0.35Risk-Balanced Scaled to 60/40 Vol4.7%10.5%0.45Source: Reuters, Bloomberg, AQR. All numbers are USD hedged. The volatility for all single asset series is the realized 3-year volatility ofthe representative asset series. For the Sharpe ratio, we use the US T-Bill. For developed equities, the expected excess return is arrived atby taking the realized volatility of the representative series over the prior 3-years multiplied by the Sharpe ratio of 0.3 (a static assumptionregarding the expected risk-adjusted return of equities). To calculate the total return, we add the 3-month T-Bill. For the portfolios (GlobalBonds through Risk-Balanced) we calculate the expected total return and volatility using a covariance matrix which reflects the marketrealized trailing 3-year return but overrides the cross terms of developed equities and bonds to be zero.At the portfolio level, our “No Floor” Capitalyields. Despite low yields, the slope of the yieldMarket Assumptions imply a Sharpe ratiocurve plus rolldown, i.e. carry, is still withinof 0.33, 0.35, and 0.45 for the global bondhistorical norms. The risk-balanced portfolioportfolio, traditional 60/40 stock/bond,has the highest risk-adjusted return becauseand the risk-balanced stock/bond portfolio,it fully takes advantage of diversification.10respectively. It is important to point out thatThe diversification advantage is monetizedthe global bond portfolio offers a competitiveusing prudent leverage, leading to the highestrisk-adjusted return even with current lowexpected total return.9Fixed Income capital market assumptions are calculated by first taking the yield of the respective country’s 10-year bond. We nextadd the roll-down return which is the difference between the 10-year and 9-year yield, multiplied by the bond duration. Duration iscalculated using the 10-year yield and pricing the bond accordingly. Next, we add ½ times the product of the bond convexity and thetrailing 3-year annualized variance of yield changes of the 10-year bond. From this value we subtract the current 3-month U.S. T-Billyield to create the “excess return.” For more details on par bonds, duration, convexity and bond math generally, we recommend thereader pursue introductory texts which cover "fixed income securities."For developed equities, we assume the Sharpe ratio is 0.3. We then multiply the assumed Sharpe ratio by the standard deviation ofpast 3-year monthly returns of MSCI World Index Hedged (WHANWIHD Index) to find the expected excess return. From this value wesubtract the current 3-month U.S. T-Bill yield to create the “excess return.”The “Global Bonds” portfolio is an equal-notional-weight portfolio which has a position in all 6 bonds. The return covariance iscalculated using the past 3-year monthly returns of each respective 10-year on-the-run bond series. The 10-year on-the-run bondseries is sourced from Datastream, Reuters, Bloomberg (Eg: US 10-year is BMUS10Y field RI).The “60/40” portfolio is formed by investing 40% of notional weight in the “Global Bonds” portfolio and 60% in the “DevelopedEquities” portfolio. We assume the stock-bond correlation over the last 3-years to be zero.The “Risk-Balanced Scaled to 60/40 Vol” portfolio is formed via a 3-step process. Step 1 of the process is to numerically find theportfolio which has equal contribution to variance of stocks and bonds; we assume zero correlation between the two assets. Oncewe have solved for the portfolio weights that have equal contribution to variance, we calculate the volatility of that portfolio. Next,we scale the weights from step 1 such that the volatility of that portfolio is equal to the volatility of the 60/40 portfolio. “Expected”or “Target” returns or characteristics refer to expectations based on the application of mathematical principles to portfolio attributesand/or historical data, and do not represent a guarantee. These statements are based on certain assumptions and analyses made byAQR in light of its experience and perception of historical trends, current conditions, expected future developments and other factorsit believes are appropriate in the circumstances, many of which are detailed herein. Changes in the assumptions may have a materialimpact on the information presented. Hypothetical data has inherent limitations, some of which are disclosed in the Appendix.10 In the risk-balanced portfolio, stocks and bonds contribute equally to total portfolio risk. In contrast, 60/40 stock/bond total portfoliorisk is dominated by stocks.
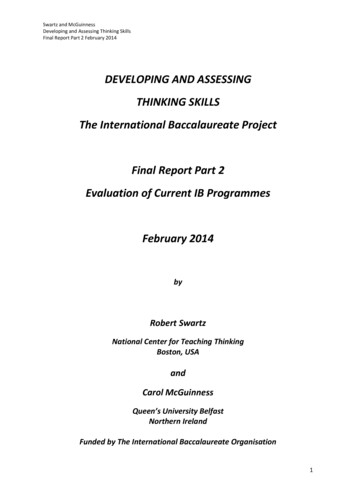
7Yield Floors and Asset Allocation: When Is the Role of Bonds Impaired? 2Q21How Do Yield Floors Impact ExpectedReturns?Figure 2 presents the one-year portfoliothe “No Floor” scenario, we should recoverexpected total returns as a function of theresults consistent with our assumed Capitalassumed yield floor. The most-restrictiveMarket Assumptions.12 When interpretingyield floor, “Starting Yield‒50 bps,” is onFigure 2, focus on the relative results, i.e.the left while the least-restrictive yield floor,compare the yield floor results to the “No“No Floor,” is on the right. As a reminder,Floor” results. This answers important“Starting Yield‒50 bps” means the investorquestions, such as “How does the assumedbelieves it is impossible for yields to dropyield floor impact the expected return whenmore than 50 basis points over the next year.compared to the ‘No Floor’ results?” and “IsIn other words, there is a yield floor 50 basisthe degradation in expected return material?”.points below the current starting yield. For11Figure 2: Portfolio Expected Return by Yield Floor136%Expected SY-2.0%No FloorYield FloorsGlobal Bonds60/40 PortfolioRisk-Balanced PortfolioSource: AQR. 60/40 is a 60% weight to hypothetical simulated stock portfolio 40% weight to hypothetical simulated global bondportfolio.If the investor believes that yields cannot dropexpected return is impaired, halving frommore than 50 basis points, the bond portfolio’sthe “No Floor” expected return of 1.4% to11 Since each country bond has a different starting yield, "Starting Yield‒50 basis points" delivers a different absolute yield floor level foreach country.12 There could be small differences due to simulation error and horizon effects, i.e. our Capital Market Assumptions are annual values,but we simulate monthly data.13 For each scenario (Eg: A scenario being “SY-0.5%”), we simulate 100,000 paths of 12 monthly returns per asset and execute thetransformation documented in Table 1. For each of these paths, we calculate the total return of the portfolio over 12 months andaverage those 100,000 values. “Expected” or “Target” returns or characteristics refer to expectations based on the application ofmathematical principles to portfolio attributes and/or historical data, and do not represent a guarantee. These statements are basedon certain assumptions and analyses made by AQR in light of its experience and perception of historical trends, current conditions,expected future developments and other factors it believes are appropriate in the circumstances, many of which are detailed herein.Changes in the assumptions may have a material impact on the information presented. Hypothetical data has inherent limitations,some of which are disclosed in the Appendix.
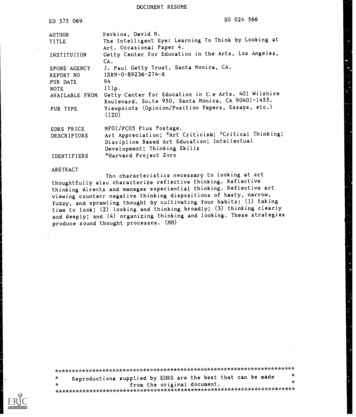
8Yield Floors and Asset Allocation: When Is the Role of Bonds Impaired? 2Q210.7%. Intuitively, the bond portfolio’s upsidebond portfolio’s upside is rarely truncated byis truncated by the yield floor. At the totalthe more relaxed yield floor over a one-yearportfolio level, the traditional 60/40 stock/horizon. Consistent with these results, thebond portfolio loses 30 basis points whiletraditional portfolio recovers its full “No Floor”the risk-balanced portfolio loses more, atexpected return of 3.7%, and the risk-balanced1.3%. Under this restrictive scenario, theportfolio regains its edge over the traditionaltraditional and risk-balanced portfolios haveportfolio (4.6% versus 3.7%).similar expected returns; the risk-balancedportfolio loses most of its edge over the equity-What’s the bottom line? Until one believes thatconcentrated, traditional portfolio.it’s impossible for bond yields to drop morethan 50 basis points over the next year, theThe expected return results materiallyreturn generating properties of bonds are notchange at the “Starting Yield‒100 bps” yieldimpaired by yield floors. Additionally, risk-floor. With a slightly less restrictive view onbalanced portfolios deliver higher expectedfuture yield movements, the bond portfolioreturns than equity-concentrated, traditionaldelivers almost 100% of the “No Floor”portfolios.14expected returns (1.3% versus 1.4%). TheHow Do Yield Floors ImpactDiversification?The diversification-related results in thisof the yield floor, all of the correlations aresection follow the same layout as the expectedconsistent with the “No Floor” Capital Marketreturn results presented previously: the mostAssumption of zero to two decimal places.15 Werestrictive yield floor, “Starting Yield‒50 bps,”obtain a similar result when assuming a “Nois on the left while the least restrictive yieldFloor” stock-bond correlation of -0.2 or 0.2.floor, “No Floor,” is on the right. We tackle thediversification issue using three different, butGiven that yield floors potentially truncaterelated, metrics: the stock-bond correlation,return distributions, perhaps “linear”total portfolio risk, and bond expected returnsmeasures of dependence, such as correlation,during equity stress scenarios.might not be appropriate for measuring thediversification impact. For this reason, weCorrelation is a widely used measure ofnext turn to the 95% annual VaR (Value-at-diversification. If a yield floor distortsRisk), a simple nonparametric measure ofdiversification, it may increase the stock-total portfolio risk.16 In Figure 3, similar inbond correlation. The simulation resultsspirit to the correlation results, we see no yielddo not support this hypothesis. Irrespectivefloor impact on total portfolio risk. Downside14 We also calculate “stress” results using CMAs motivated by the European debt crisis timeframe, October 2011. In this more volatileenvironment, the bond portfolio delivers most of the "No Floor" expected return at the "Starting Yield‒150 bps" yield floor. Details areavailable upon request.15 As discussed earlier, if the stock-bond correlation became meaningfully positive, this would lessen, but not eliminate, thediversification benefit of a fixed-income allocation.16 The 95% annual VaR is equivalent to the 5th percentile of the annual return distribution.
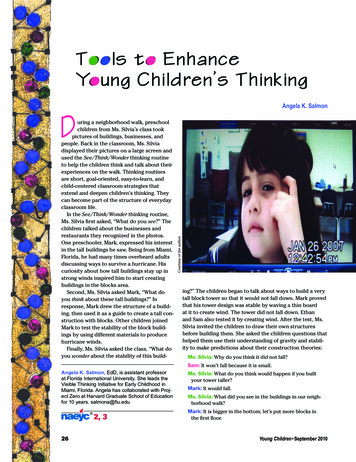
9Yield Floors and Asset Allocation: When Is the Role of Bonds Impaired? 2Q21portfolio risk at the most restrictive yielda “No Floor” stock-bond correlation of -0.2 orfloor, “Starting Yield‒50 bps,” is similar in 0.2 does not change this result.magnitude to the “No Floor” result. AssumingFigure 3: Portfolio 95% VaR17Portfolio -11.8%-13.3%SY-2.0%-5.3%-11.8%-13.3%No FloorYield FloorsGlobal Bonds60/40 PortfolioRisk-Balanced PortfolioSource: AQR. 60/40 is a 60% weight to hypothetical simulated stock portfolio 40% weight to hypothetical simulated global bondportfolio.Bond diversification properties seem toscenarios should mirror the unconditionalbe fairly resilient to yield floors. However,expected return results (Figure 2). This isinvestors don’t just hold bonds to manageconfirmed in the bar chart. If the investoroverall portfolio risk across all environments.believes yields cannot drop more than 50 basisThey also hold bonds to protect the portfoliopoints, the bond’s “equity stress scenario”during large equity drawdowns. We addressexpected return is impaired, dropping in halfthis next by measuring expected returns as afrom the “No Floor” expected return of 1.5% tofunction of the yield floor during equity stress0.7%. At the portfolio level, the risk-balancedenvironments, defined as the bottom 20allocation is impacted more by the restrictivepercentile of annual equity return outcomes.18yield floor, going from a “No Floor” returnthof -0.5% to -1.7%.20 The traditional, equityThe equity stress scenario results in Figure 4concentrated portfolio’s expected return losesare consistent with our earlier unconditional30 basis points due to the yield floor (-4.0%bond expected return and stock-bondversus -3.7%). Given the nature of an equitycorrelation results.19 If the zero correlationstress scenario, the risk-balanced portfolioisn’t impacted by yield floors, then bondperforms the best in absolute terms. Clearly,expected returns during equity stressif an investor is concerned about an equity17 For each scenario (Eg: A scenario being “SY-0.5%”), we simulate 100,000 paths of 12 monthly returns per asset and execute thetransformation documented in Table 1. For each of these paths, we calculate the total return of the portfolio over 12 months andcalculate the 5th percentile return for those 100,000 values per portfolio.18 The 20th percentile of annual equity return outcomes is -7.4%.19 The equity stress scenario results leverage the same stock-bond model from the previous results.20 While the expected return absolute levels vary as a function of the assumed stock-bond correlation, the spirit of the results do notchange for different correlation assumptions. Almost 100% of the "No Floor" expected return is obtained at the "Starting Yield – 100bps” yield floor.
10Yield Floors and Asset Allocation: When Is the Role of Bonds Impaired? 2Q21drawdown, the risk-balanced portfolio isWith a slightly less restrictive view on futuresuperior even if the bond return is impaired.yield moves down, all three portfolios deliveralmost 100% of the “No Floor” expectedLike the earlier unconditional expectedreturns during equity stress scenarios.21 Thisreturn results, an inflection point occursresult holds even if the “No Floor” stock-bondat the “Starting Yield‒100 bps” yield floor.correlation is -0.2 or 0.2.Figure 4: Portfolio Return Given a 20th Percentile Bad Equity Return222%Portfolio .7%SY-1.0%SY-1.5%SY-2.0%No FloorYield FloorsGlobal Bonds60/40 PortfolioRisk-Balanced PortfolioSource: AQR. 60/40 is a 60% weight to hypothetical simulated stock portfolio 40% weight to hypothetical simulated bond portfolio.What’s the bottom line? Until one believes thatbroadly defined diversification properties ofit’s impossible for bond yields to drop morebonds are not impaired by yield floors.than 50 basis points over the next year, theConclusionWhile we believe yields can meaningfullystruggle with mapping yield floor viewsdecline both now and during the lowsinto portfolio outcomes and identifying theof 2020, some investors disagree. A“inflection point” where their view no longer“restrictive enough” view on future yieldmatters in practice.declines could impair the return generatingand diversification properties of bonds,In this paper, we find that only very restrictivequestioning their role within a traditional orviews impair the role of bonds in a portfolio.risk-balanced asset allocation. Many investorsWe estimate that a floor of 50 basis points21 We also calculate “stress” results using CMAs motivated by the European debt crisis timeframe, October 2011. In this more volatileenvironment, the broadly defined diversification properties of bonds are not materially impaired at the "Starting Yield‒150 bps" yieldfloor. Details are available upon request. Hypothetical data has inherent limitations, some of which are disclosed in the Appendix.22 For each scenario (Eg: A scenario being “SY-0.5%”), we simulate 100,000 paths of 12 monthly returns per asset and execute thetransformation documented in Table 1. For each of these paths, we identify those paths which experience a less than 20 th percentilebad outcome for equities. For that subset of paths, we average the cumulative return for each portfolio. Hypothetical data has inherentlimitations, some of which are disclosed in the Appendix.
Yield Floors and Asset Allocation: When Is the Role of Bonds Impaired? 2Q2111below prevailing yield levels materiallyBefore we end, it is important to put theimpacts the role of a global bond allocation100 basis point inflection point in context.over the next year. At a slightly less restrictiveAs of the writing of this paper, the averagefloor of 100 basis points below prevailingdeveloped market 10-year yield is 85 basisyield levels, the bond portfolio is no longerpoints.23 The average yield reached animpaired; traditional and risk-balanced assetall-time low of 14 basis points during theallocations behave almost as if no yield floorcoronavirus pandemic.24 Whatever yieldexisted. The more diversified, risk-balancedfloor views investors have, the recent yieldportfolio regains its total return and risk-increases provide a greater cushion above theadjusted return edge over a traditional 60/40floor, and thus less chance for bond return orstock/bond portfolio.diversification impairment.23 As of March 11, 2021.24 As of March 9, 2020.
12Yield Floors and Asset Allocation: When Is the Role of Bonds Impaired? 2Q21ReferencesBrooks, J., Forthcoming, “What Drives Bond Yields?”, AQR White Paper.Huss, J., Maloney, T., Mees, T., Mendelson, M., 2017, “Asset Allocation in a Low YieldEnvironment”, CAIA Association Alternative Investment Analyst Review, Q4 2017 Volume 6Issue 4.AQR Capital Management, 2012, “Why Do Most Investors Choose Concentration OverLeverage?”, AQR White Paper.Fader, J., Mees, T., Mendelson, M., 2020, “It’s Not a Bound; It’s an Opinion”, AQR White Paper.Asness, C., Ilmanen, A., Maloney, T., 2017, “Market Timing: Sin a Little, Resolving the ValuationTiming Puzzle”, Journal Of Investment Management, Vol. 15, No. 3, pp. 23–40.
Yield Floors and Asset Allocation: When Is the Role of Bonds Impaired? 2Q2113AppendixContinuous 10-year government bonds are created by sourcing the on-the-run yield curve foreach sovereign from Bloomberg. From this yield curve, we take the yield of the 10-year, on-therun government bond. The series representing bond yields is the 10-year bond at each point intime following this methodology.The MSCI World Index Hedged Net TR USD is an index which is meant to represent a returnresulting from hedging the MSCI equity index exposure in the forward currency markets andcontains both an equity and a currency component.For additional familiarity regarding on-the-run government bonds, we encourage the reader toexplore common tooling such as: the Bloomberg terminal screen “WB” for world bonds, and theSt. Louis Federal Reserve website https://fred.stlouisfed.org/.Table A1: Bond Views Summary25Bond Yield DeterminantsLong maturity bond yields move one-for-one with long-term inflation and real growth expectations. These fundamentalmacroeconomic variables provide the backdrop for low yields today.Monetary policy is still viable even if short-ter
Canada, and Australia. Yield floors are defined relative to each country's starting yield ("SY") in increments of 50 basis points ("distance from the starting yield"): SY-50 bps, SY-100 bps, SY-150 bps, SY-200 bps, and "No Floor." Unlike absolute yield floors, measuring yield floors relative to the starting yield helps to