Transcription
Austin WaterAffordability MetricsReportMay 2021
Austin WaterAffordability Metrics ReportMay 2021Report OverviewAustin Water (AW) initiated the Austin Water Affordability Benchmark Study in response to City CouncilResolution No. 20180201-068, which directed the City Manager to provide information on internalaffordability benchmarks, conduct a comprehensive affordability study and make recommendations onaffordability metrics to track and communicate. The initial Austin Water Affordability Benchmark Studywas completed and provided to Council in December 2018 (FY2019). AW continues to annually updatethe affordability metric report in an effort of ensuring affordable utility bills for all customers.Affordability EffortsMaintaining affordable water and wastewater service is a critical component of managing the rising costof living in Austin. Austin Water (AW) continues its affordability efforts to ensure a reliable supply of highquality drinking water and wastewater services that is affordable. AW maintains focus on affordabilityefforts in several ways, as listed below. Customer Assistance Programs: AW provides for significant affordability for its most vulnerablelow-income customers. These Customer Assistance Programs (CAP) provide reduced water andwastewater bills to over 14,000 residential customers. A new CAP initiative was also implementedin FY2021 to provide bill credits to over 15,000 multifamily customers, to provide a discount forwater and wastewater service billed through a master meter. These CAP programs include: Water & Wastewater Service Customer Charge Waiver, Tiered Fixed Charge Waiver, andVolumetric Rate “CAP Bill” Discounts – AW provides waivers for all fixed fees and water andwastewater volume rate discounts for eligible residential CAP customers. This discountprovides the average residential CAP customer a 45% discount as compared to regular NonCAP residential bills. Residential CAP Bill Rate Reductions – Over the last few years, AW has been able toimplement residential CAP customer rate reductions, providing more affordability. InFY2018, CAP customers saw a 11.4% average bill reduction. In FY2019, residential CAPcustomer rates were unchanged and in FY2020, CAP customers saw an 8.3% average billreduction. COVID-19 Bill Relief – In April 2020, the City Council approved COVID-19 Bill Relief forresidential water and wastewater customers. Volume rates were reduced by 10% for watertiers 1-3 and wastewater tiers 1-2 for residential CAP and Non-CAP customers. This ratereduction continued throughout FY2020 for residential Non-CAP customers and extendedthrough FY2021 for CAP customers, providing extended bill relief for our most vulnerablecustomers. Additionally, AW provided a 5.0 million contribution in FY2020 and anotherAffordability Metrics ReportPage 2 of 21
5.0 million in FY2021 to the City’s Financial Support Plus 1 Program, which provides billpayment assistance to residential customers experiencing COVID-19 related economichardship. Financial Support Plus 1 Program – The financial support plus 1 program providesemergency financial help for residential customers that are having temporary difficultypaying utility bills. Arrearage Management Program – The arrearage management program benefits certainlow-income residential customers who were behind on their utility bills in the past. Thisprogram is intended to help these customers pay down their previous utility debt balances. Water Leak Repair Program – The water leak repair program benefits low-incomeresidential customers make necessary plumbing and leak repairs, as they can apply forassistance thanks to a new partnership between Austin Water and Neighborhood Housingand Community Development of the City of Austin. Wastewater Lateral Repair Grant Program – AW provides grant funding to theNeighborhood Housing and Community Development Department to administer a lowincome grant program for residential customers experiencing failures in the wastewaterlateral lines connecting their home to AW’s wastewater system. These repairs can be costlyfor the low-income homeowner and this program provides grants to pay for these repairs. Home Emergency Repair Program – AW agreed to provide up to 1.0 million in FY2021 toprovide funding to the Neighborhood Housing and Community Development Departmentto fund plumbing repairs and other repairs/work or equipment directly related to damagescaused by 2021 Winter Storm Uri for low-income residential customers. Expense Management: AW manages it expenses through annual strategic and budget planning.AW conducts a thorough budget development process which provides for detail line item budgetanalysis, several layers of management review and final approval by the Executive Team andDirector. The Executive Team comprehensively reviews additional staffing requests to limit costimpacts. AW uses conservative assumptions to ensure overestimating budget costs. Capital Project Planning: AW manages its Capital Improvement Projects (CIP) Program ensuring aprocess of thorough review, approval, and funding strategies. Improving affordability andinfrastructure stability are components of the utility’s long-term strategic business plan that usesEffective Utility Management strategies to meet the challenges ahead. Debt Management Strategies: AW focuses on debt management to reduce debt service costsassociated with financing our CIP projects. Financing Strategies – AW strategically reviews the CIP Program for potential Texas WaterDevelopment Board (TWDB) Low-Interest Loan funding. Since 2016, AW has been approvedfor 266.6 million in TWDB low-interest loans to fund 9 major infrastructure projects. Theselow-interest loans will help AW make much needed improvements to its infrastructure ata tremendous cost savings for the utility and its customers.Affordability Metrics ReportPage 3 of 21
Debt Defeasances and Refundings – Since 2016, AW uses Capital Recovery Fee dollars forannual debt defeasance transactions, that reduce future debt service requirements. Thesedefeasances have allowed for AW to manage and stabilize our debt costs. Debt refundingsare the refinancing of debt, which are similar to the refinancing your home mortgage. Withthe refundings at reduced interest rates, the transaction results in debt service savings.AW’s debt management strategies for debt defeasances and debt refundings have yielded 199.9 million in debt savings since 2016. Development Strategies: In FY2014, Austin City Council approved AW to collect capital recoveryfees (CRF) also known as Impact Fees, up to the maximum allowable. CRFs dollars derive from aone-time charge to new developments to pay their fair share for water and wastewaterinfrastructure needed to provide new service. This Council approval allowed for a significantincrease in CRF collections, which are essential for reducing AW’s debt service requirementsthrough annual debt defeasance transactions. Rate Reductions and Stabilization: All of the affordability efforts listed above have allowed AW toreduce and stabilize water and wastewater rates. In 2018, AW implemented a 4.8 percent ratereduction for all retail customers. After this rate reduction, AW maintained stable rates with norate increases from FY2019 to FY2021. In addition, AW’s proposed budget includes no rate increasefor FY2022.This Affordability Metrics Report provides updated results annually of the recommended affordabilitymetrics from the FY2019 Affordable Benchmark Study. In addition, Austin Water has included additionalaffordability metrics which provide supplementary results. The bill comparison metrics include 2021updates to other Texas and national cities’ water and wastewater rates.Affordability Metrics ReportPage 4 of 21
The metrics include the following:Index of Affordability MetricsMetric #1: Historical Rate IndexMetric #2: Residential Low Volume Bill ComparisonMetric #3: Residential Average Customer Bill ComparisonMetric #4: Affordability Ratio (AR20)Metric #5: Hours Minimum WageMetric #6: Average Annual Bill as % of Median Household IncomeMetric #7: Average Historical Annual Bill as % of Median Household IncomeMetric #8: Residential CAP Customer Historical Average BillMetric #9: High Volume Residential Bill ComparisonAffordability Metrics ReportPage 5 of 21
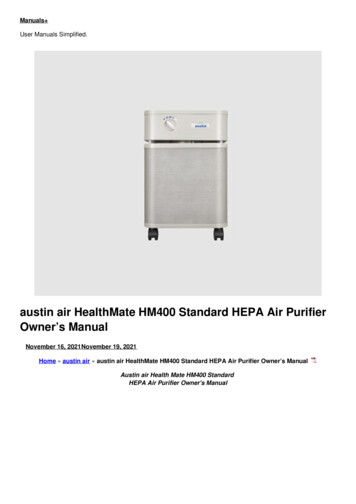
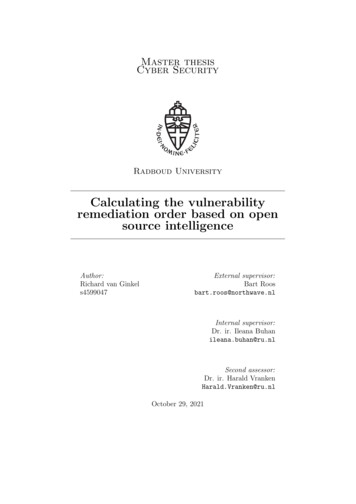
Metric #1: Historical Rate IndexThis metric includes a comparison of the Austin Water (AW) historical rate increases, the water andwastewater industry cost index, and a reference 2% annual rate increase trendline. Each of these indicesare calculated using a base year of 2016. The goal for this benchmark would be for AW to remain underthe 2% annual rate increase trendline. This goal to remain under 2% represents approximately 50% of thecurrent water and wastewater industry index historical trend. This benchmark is consistent with thecurrent Austin Energy benchmark of remaining below a 2% annual rate increase trend.The graph below shows for 2016 and 2017, AW was trending along the water and wastewater industryindex level and above the 2% annual rate increase trendline. However, beginning in the FY2018 ApprovedBudget, AW submitted a 0% rate increase and subsequently Council approved an amendment to thebudget in April 2018 to implement a mid-year 4.8% rate reduction. Since the 2018 rate reduction, AWrates are below both the water and wastewater industry index and the 2% annual rate increase trendline.The graphic also provides for a projection of these indices through 2026. The water and wastewaterindustry index used a historical 15-year average increase to project through 2026, while AW projectedrates through 2026 are based on AW’s Financial Forecast completed in March 2021. This forecast assumedno rate increases for FY2022, FY2023, FY2025 with only a projected 3.2% and 2.8% rate increase in FY2024and FY2026, respectively. With AW proposing multiple years of no rate increases and only two years ofrate increases near the 2% level, the projection of the cost trends for AW is currently below the 2%trendline. These results are consistent with those of the 2020 Affordability Metrics Report, which alsoshowed AW below the 2% trendline. However, these results show an improvement in that rates areprojected to remain flat through 2023.Affordability Metrics ReportPage 6 of 21
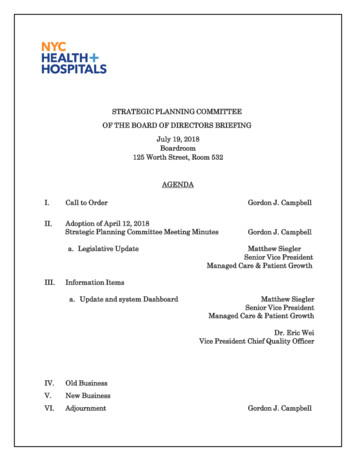
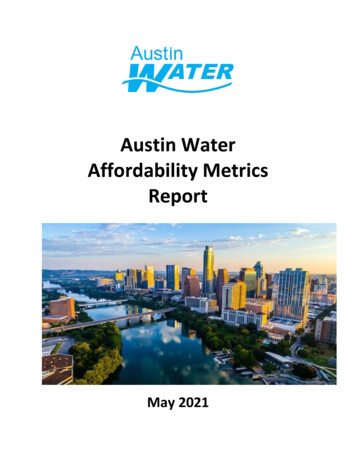
Metric #2: Residential Low Volume Bill ComparisonThis metric provides a low volume user bill comparison of Texas and national cities which usescombined water and wastewater bills based on customers using 3,000 gallons of water and 2,000gallons of wastewater. The comparison of low volume bills is consistent with AW’s rate structuregoals to promote water conservation and provide affordable basic water services to ourcustomers. A residential Customer Assistance Program (CAP) customer bill at low volumes shouldbe at affordable levels, to ensure our most vulnerable low-income customers have access to basicwater services at affordable costs.AW’s goal of low-volume residential CAP customer bills being below the 20th percentile of allcities surveyed. Currently, AW’s CAP residential low-volume bills ranked 1st out of all Texas andnational cities surveyed. This is consistent with the 2018, 2019, and 2020 Affordability MetricsReport which had AW residential CAP customers the lowest of all cities surveyed. This is due tothe waiver of fixed fees and significant volumetric bill discounts provided to our low-incomeresidential CAP customers to keep their bills at affordable levels. In FY2020, AW reducedresidential CAP customer average bills and extended that reduction into FY2021 to provide anincreased discount to water and wastewater volumetric charges as a response to the impacts ofCOVID-19.For residential Non-CAP customer bills, AW’s goal is to reside in the bottom half of all Texas andnational cities surveyed. Currently, AW is ranked 17th out of the 36 cities surveyed, which isslightly above the 50% level. This is an improvement of one rank higher than the 2020Affordability Metrics Report, which had AW residential non-CAP customers ranked 18th out ofthe 36 cities surveyed. As AW’s rates are projected not to increase until FY2024, it is expectedthat our ranking within this benchmark will begin to improve.Affordability Metrics ReportPage 7 of 21
Affordability Metrics ReportPage 8 of 21
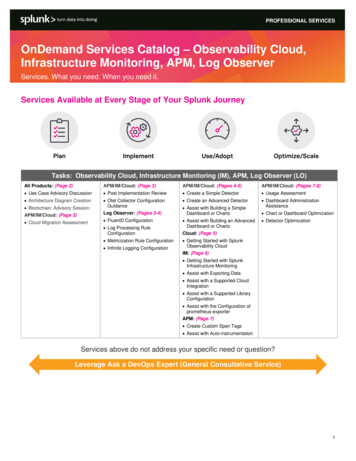
Metric #3: Residential Average Customer Bill ComparisonThis metric includes a residential average customer bill comparison. This metric comparescombined residential water and wastewater bills at the current AW average residential customerusage levels of 5,800 gallons of water consumption and 4,000 gallons of wastewater dischargeper month. Approximately 65% of AW’s customers have bills that are at these levels of usage orbelow. Comparing combined bills at these levels is consistent with AW's rate structure goals topromote aggressive water conservation by our customers. The graph also shows the AW’sresidential CAP customer bill, which highlights the affordability of our water services for our mostvulnerable low-income customers.AW’s goal for residential CAP average bills is at or below the 1st quartile, or lower 25%, of all Texasand national cities surveyed. Currently, AW's residential CAP bill is within this 1st quartile goal,ranking 3rd out of 36 cities surveyed, at the 8% level. This is an improvement of one rank higherwhen compared with the results of the 2018, 2019, and 2020 Affordability Metrics Report.For our residential non-CAP average bills, AW’s goal is to improve to below the 65th percentile ofall Texas and national cities surveyed over the next five years. Currently, AW's average residentialbill is at the 75th percentile, ranking 26th out of 36 cities surveyed. This is an improvement of onerank higher than the 2020 Affordability Metrics Report. Over the next five years, AW anticipatesimprovement within this benchmark given the projection of no rate increases over the next twoyears and with minimal rate increases in FY2024 and FY2026.Affordability Metrics ReportPage 9 of 21
Affordability Metrics ReportPage 10 of 21
Metric #4: Affordability Ratio (AR20)The Affordability Ratio 20 (AR20) is one of the two benchmarks advanced in an American WaterWorks Association (AWWA) publication article written by Professor Manuel P. Teodoro. The titleof the article is: Measuring Household Affordability for Water and Sewer Utilities, JournalAWWA, January 2018. The article provides a rationale for measuring the affordability of waterand wastewater costs based on the impact on low-income households.The AR20 metric measures the ability of low-income customers to pay for basic water andwastewater services after paying for other essential costs such as food and housing. The focus ison low-income customers who are at the 20th percentile of household income, as opposed tolooking at customers at the higher median household income. These low-income customersrepresent the most vulnerable households in which affordability of water and wastewaterservices is critical. The level of household water and wastewater use for this benchmark is forbasic health and sanitation needs, represented by 4,000 gallons of water consumption and 4,000gallons of wastewater discharge per month. This focus on lower volume needs is morerepresentative of the basic water needs of low-income customers. This benchmark is generallyeasy to update each year through calculation of bills at the current rates. The estimation of eachcity’s essential costs, other than water and wastewater services, is difficult to update annuallyand requires the services of Professor Manny P. Teodoro to provide data for the updates.Professor Manny P. Teodoro has suggested a rule of thumb of less than 10% of remaining income,after paying for other essential costs, would be needed to pay for basic water and wastewaterservices. AW’s goal is set at an even more affordable 5% goal for average residential CAP andNon-CAP customers.Currently, for the AW residential CAP customers, the bill for basic water needs for low-incomecustomers is only 2.4% of the remaining income after paying for other essential costs, and thelowest of any major Texas city surveyed. The results of FY2021 are expected to continue forFY2022 at 2.4% which continues residential CAP customer bills as the 2nd lowest of all citiessurveyed, which is an improvement of one ranking from the 2020 Affordability Metrics Report.For residential Non-CAP customers, bills for basic water needs for low-income customers are5.7% of the remaining income after paying for other essential costs, which is above AW’s goal of5.0%, but well below the article recommended 10%. The 2018, 2019, and 2020 AffordabilityMetrics Report showed Austin was at 5.0% or below. According to Professor Manny P. Teodoro,“The significant increase AR20 value is driven mainly by a sharp increase in non-water/seweressential expenditures. The costs of living in Austin apparently is increasing very rapidly –especially for low income households.”Affordability Metrics ReportPage 11 of 21
Affordability Metrics ReportPage 12 of 21
Metric #5: Hours Minimum WageThe Hours Minimum Wage (HM) is one of the two benchmarks advanced in an American WaterWorks Association (AWWA) publication of an article written by Professor Manuel P. Teodoro.The title of the article is: Measuring Household Affordability for Water and Sewer Utilities,Journal AWWA, January 2018. The article provides a rationale for measuring the affordability ofwater and wastewater costs based on the impact on low-income households.The HM simply takes a combined water and wastewater bill calculated with 4,000 gallons ofwater consumption and 4,000 gallons of wastewater flow monthly (to represent consumptionfor health and satiation) for each utility and divides it by the minimum wage per hour in eachcommunity. This indicates how many hours a person must work at minimum wage (ignoringtaxes) in order to pay for the combined water and wastewater bill at 4,000 gallons. In his article,Professor Teodoro suggested a HM of less than 8 hours as an affordability rule-of-thumb. Theintuition behind this threshold is that not one person should have to work for longer than onestandard workday at minimum wage in order to afford their combined water and wastewaterbill.The Hours Minimum Wage benchmark is generally easy to calculate given the availability ofinformation on minimum wage and the ease of calculating bills for basic service. However, thisbenchmark in not widely used in the industry. Additionally, the minimum wage has historicallyremained relatively constant over longer periods of time, making the results of this benchmarklikely to trend higher as bills rise. AW contracted with Professor Manny P. Teodoro whoprovided the data for the Hours Minimum Wage updates.Austin Water's HM for a typical residential Non-CAP customer bill for basic water and wastewaterservices is at 9.3 hours which is slightly above the suggested 8-hour goal. This is consistent withthe 2018, 2019, and 2020 Affordability Metrics Report. Austin Water's residential CAP bill is at4.4 hours, an improvement from 4.9 hours in 2020. For FY2022, AW’s residential CAP customeraverage bills is expected to remain at 4.4 hours and the 4th lowest ranking of 36 cities surveyed.Affordability Metrics ReportPage 13 of 21
Affordability Metrics ReportPage 14 of 21
Metric #6: Average Annual Bill as % of Median Household IncomeThe average residential water and wastewater bill calculation uses the most recent 2019 MHIdata with an inflation factor for each succeeding year to determine the 2021 annual water andwastewater costs to compare with each cities’ median household income. DataUSA 1 is the sourceof the median household income for each of the cities from 2013 to 2018. AW has restated the2013 to 2018 MHI using information from DataUSA, which is an easy to use platform that willdisplay specific data for numerous cities. However, DataUSA experienced COVID-19 impactswhich delayed updating their website with 2019 data, as such AW utilized CensusReporter.orgfor 2019 MHI data. The American Community Survey is the source for both DataUSA and CensusReporter.The percentage of MHI benchmark is commonly used within the water industry, in part becauseit is relatively easy to calculate. However, there are concerns over the use of this benchmark andhow well it measures affordability. First, there are issues with the arbitrary nature of settingstandards or goals. An often-used standard has been 2.0% or 2.5% of MHI based on US EPAguidelines to determine a community’s ability to pay for capital projects. The use of thisbenchmark assumes that if a water or wastewater bill is below the 2.0% standard, then it is“affordable”, and if the bill is above the standard, it is “unaffordable”. There are some utilitiesthat use the standard 2.0% for water and then add another 2% for wastewater, for a combined4.0%. Second, there are concerns with how income varies within different cities. There can besignificant differences between high and low-income households that are obscured by thereliance on MHI. This may cause reliance on MHI to be a poor indicator of affordability, especiallyfor low income households.Austin Water currently has a Key Performance Indicator (KPI) included in the FY2021 ApprovedBudget of total water and wastewater residential annual bills as a percentage of MHI with a goalof below 1.5%.Austin Water residential average annual water and wastewater bills as a percentage of MHI arelower than most major Texas cities which includes Abilene, Corpus Christi, Fort Worth, Kyle,Lubbock, Pflugerville and San Antonio. For an average residential customer of Austin Waterhaving a median household income, they would spend 1.22% of their annual income on waterand wastewater bills. Austin Water average residential customer annual bills as a percent of MHIare ranked 17th out of the 36 Texas and national cities surveyed, which is an increase in oneranking from the 2020 Affordability Metrics Report. The increase in ranking is due to AW’saffordability efforts and keeping rates at the same level for FY2021 and estimated medianhousehold income increasing to higher ffordability Metrics ReportPage 15 of 21
Affordability Metrics ReportPage 16 of 21
Metric #7: Average Historical Annual Bill as % of Median Household IncomeThis metric provides a historical look at Austin Water's average customer annual water andwastewater bills as a percent of MHI. Austin Water has set a goal that our average customer'sannual water and wastewater bills represents less than 1.5% of the median household income.Austin Water forecasts that it will continue to achieve the 1.5% goal. Further, Austin Waterforecasts a downward trend for this benchmark. This is due primarily to no rate increases inFY2019, FY2020, FY2021, and no projected rate increases in FY2022, FY2023, and FY2025, withminimal rate increases projected in FY2024 and FY2026.Source: DataUSA is the source of the median household income (MHI) data for each of the cities for 2013 to 2018[1]. However, DataUSAexperienced COVID-19 impacts which delayed updating their website with 2019 data, as such AW utilized CensusReporter.org for 2019 MHIdata. Austin Water’s MHI data has been restated from 2013 to 2018 using DataUSA. The 2010-2012 MHI is using data from the CensusReporter.Affordability Metrics ReportPage 17 of 21
Metric #8: Residential CAP Customer Historical Average BillAW’s rate structure reflects both Austin’s environmental and social equity and values. Theutility’s residential Customer Assistance Program (CAP) is an example of its commitment to socialequity. In this metric, the historical residential CAP customer water and wastewater bills arepresented. The residential CAP program was initiated in 2009. The chart reflects enhancementsin the residential CAP program over the years.For example, at the beginning of the program, AW provided residential CAP customers a waiverof their fixed charges. This provided an average 43% discount on their bills.In 2013, AW provided additional discounts for not only residential CAP customers' fixed charges,but also a water volumetric rate discount. Then, in 2018, Austin Water provided an average 4.8%water and wastewater rate reduction for all retail customers including residential CAP, along withthe addition of a new wastewater volumetric rate discount for residential CAP customers.During the FY2021 budget, AW continued the reduced residential CAP water rates for tiers 1-3and residential CAP wastewater rates for tiers 1 and 2 to continue assisting individualsexperiencing financial hardship due to the COVID-19 pandemic. These reductions are proposedto continue through FY2022, which will continue to improve the benchmark as compared to theresults of the 2020 Affordability Metrics Report.Affordability Metrics ReportPage 18 of 21
*Fiscal years 2023-2026 rates are subject to change and are shown on graph for illustration purposes only. Minimal rate increases in FY2024and FY2026 are not reflected in the graph.Affordability Metrics ReportPage 19 of 21
Metric #9: High Volume Residential Bill ComparisonThis metric provides the high-volume residential bill comparison using 10,000 gallons water and5,000 gallons wastewater discharge. Austin Water's residential rate structure is designed toprovide higher costs for higher volume use. At these high-volume levels, Austin Water is lesscompetitive with other cities than the average customer bill comparison results. At these highvolume levels, only one central Texas city, Kyle, is above Austin Water bills and the other majorTexas cities are all below Austin Water bills.For our residential CAP customer bills at the high-volume levels, the goal is to be below the 50thpercentile. Currently, AW’s residential CAP customers are ranked 7th out of 36 cities surveyed,which is just below the 50% level. This is an improvement compared to the results of the 2020Affordability Metrics Report where AW rank was 9th. For the residential CAP customer bills atthese high volumes, Austin Water residential CAP customers are higher than some major Texascities, except Houston, Dallas, and Fort Worth. At these high-volume levels, the CAP residentialbill is 49% of the non-CAP Austin Water customer bill. This represents a discount of 51% on billsfor our most vulnerable low-income residential CAP customers using these higher volumes. Thediscount provided is a waiver of all fixed fees and a discounted volumetric rate per 1,000 gallonsfor blocks 1 through 4, with only the block 5 rate for residential CAP customers being the sameas the rate for non-CAP residential customers.For our residential non-CAP average bills, AW’s goal is to be below the 75th percentile of all Texasand national cities surveyed over the next five years. Currently, Austin Water's averageresidential bill is slightly above the 75th percentile, ranking 29th out of 36 cities surveyed. This isan improvement in ranking from the 2020 Affordability Metrics Report. Over the next five years,Austin Water anticipates continued improvement within this benchmark given the projection ofno rate increases in FY2022, FY2023, and FY2025 with minimal rate increases projected in FY2024and FY2026.Affordability Metrics ReportPage 20 of 21
Affordability Metrics ReportPage 21 of 21
the refundings at reduced interest rates, the transaction results in debt service savings. AW's debt management strategies for debt defeasances and debt refundings have yielded 199.9 million in debt savings since 2016. Development Strategie s:In FY2014, Austin City Council approved AW to collect capital recovery