Transcription
Visualizing Cyber Security: Usable WorkspacesGlenn A. Fink*, Christopher L. North**, Alex Endert**, and Stuart Rose** Pacific Northwest National Laboratory** Virginia Polytechnic Institute and State UniversityABSTRACTThe goal of cyber security visualization is to help analysts increase the safety and soundness of our digital infrastructures byproviding effective tools and workspaces. Visualization researchers must make visual tools more usable and compelling than thetext-based tools that currently dominate cyber analysts’ toolchests. A cyber analytics work environment should enable multiple, simultaneous investigations and information foraging, as wellas provide a solution space for organizing data. We describe ourstudy of cyber-security professionals and visualizations in a large,high-resolution display work environment and the analytic tasksthis environment can support. We articulate a set of design principles for usable cyber analytic workspaces that our studies havebrought to light. Finally, we present prototypes designed to meetour guidelines and a usability evaluation of the environment.KEYWORDS: Cyber analytics; cyber security; visualization; usability; large, high-resolution displays; cognitive task analysis.INDEX TERMS: H.5.2 [User Interfaces]: Interaction styles, Prototyping, Screen design, User-Centered Design1INTRODUCTIONCyber analysts who defend our computer infrastructures useprimitive, command-line tools that are ineffective at the high volume and velocity of the data they must process. They have resisted using visualizations, partly because no visualization has yetmet their complex needs. We believe this is because their tasks,work environments, and requirements have not yet been studiedsufficiently. We need more user-centered design in the solutionswe offer. Large displays have been valuable in other applicationswith massive data [1], and we suspect that they can be helpful inthis application, too.Cyber analytics is a new science of analysis for understandingthe behavior of computers and computer networks from the datathey generate—discerning the story hidden inside massive cyberdata. Many job descriptions include cyber analytic tasks, such assystem administration, cyber security, and design and maintenance of computer infrastructures. In this paper, we concentrateon cyber analysis for securing enterprises and large infrastructuresof related organizations. We found the behaviors of the cyberanalysts we studied were distinct from behaviors of analysts inother domains such as intelligence analysis.For cyber security professionals, a usable workspace shouldsupport multiple, simultaneous, open-ended investigations. Separate tasks that arise from distinct tip-off points may eventuallyconnect, implying the need for an overview of all active tasks andtheir relationships. Analysts desire to find connections that pointGlennFink Glenn.Fink@pnl.gov ,ChrisNorth north@cs.vt.edu , Alex Endert aendert@cs.vt.edu , StuartRose Stuart.Rose@pnl.gov to the sources of threats to the system they are defending. Usingthe analogy of information foraging [2], cyber analysts are tracking big game. Individual clues are only valuable if they supportother clues that point to the same root cause. To acquire multiple,complementary information items, cyber analysts rapidly switchbetween analytic inquiries, multi-tasking and refining or broadening queries as they investigate potential leads.Analysts need tools that interoperate. Their tools (and queries)are highly specialized, and they spend much of their time joiningdata tables and translating information between tools. Often thestory they seek is hidden within complex correlations that no single view adequately reveals.This paper contains the results of our study of cyber securityanalysts, our proposed solutions to selected problems, and users’reactions to our solutions. We identify lessons learned and present a set of design principles for usable cyber analytics workspaces. Our goals were to identify sensemaking processes in cyberanalytic work and critical usability issues in cyber analytics workspaces, and to elicit cyber analysts’ ideas about how large, highresolution displays can help them work more effectively. We observed cyber analysts using large displays with a sample problem.Then we created mockups that identify effective uses of largedisplays in cyber analytics. We sought feedback on our prototypesfrom the users who participated in our study.2RELATED WORKMany visualizations for cyber security data are special-purposerepresentations of a particular kind of data. Few tools supportinteroperability with other applications and utilities. Most toolsare neither fast enough nor flexible enough for cyber analysts.There are visualizations [3][4][5] for packet-headers, networkflows, system log files, IDS alerts, etc. Optimizing a tool for onetype of data separates the tool from the context of an overall investigation. Unless a visualization tool fits into the broad contextof the overall investigation it will limit its utility to the analyst.For instance, a cyber analyst might find some interesting alerts viaa Snort IDS alert visualization and then wish to investigate thenetwork flows, packets, host log entries, application logs, etc., thatare related to these alerts. Most visualizations do not support thiskind of rapid, open-ended foraging activity.Snap-together visualization [6] provides a flexible visualizationsystem of coordinated views that links legacy tools at the database(relation-query) level. Thus a user-defined series of visualizationscan be driven from direct interaction with any visualization in theseries. Snap would provide the power and flexibility of databaseand command-line tools, but it has not been applied to cyber analytics. We believe that a coordinated visualization system thatinterprets interactions and coordinates views relationally is anessential building block of a usable cyber analytic workspace.Displays of the size we used in our study are not in broad use,so it is not surprising that many visualizations are not optimizedfor this environment. Mitigations like tabbed windows that helpconserve space in small displays are counterproductive in a largedisplay. To make use of these displays, we must develop newwindow and display management techniques.
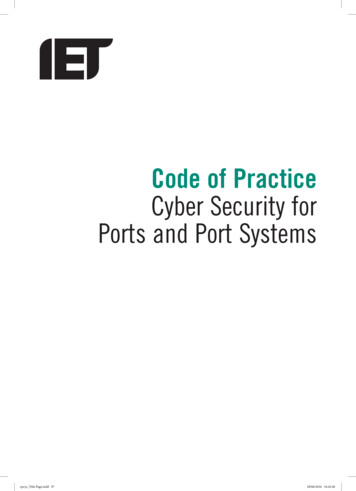
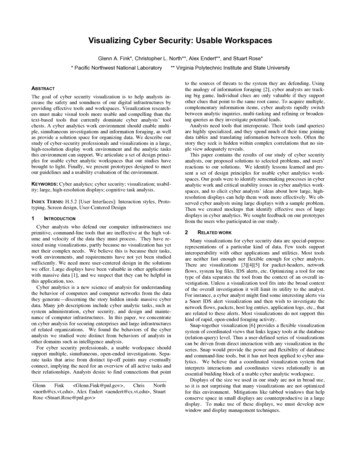
3CYBER ANALYST ETHNOGRAPHIC STUDYWe interviewed eight cyber analysts at a major government laboratory to find out how large, high-resolution displays can helpsolve important problems in analysis. Three interviewees werestrategic analysts whose job included understanding threats to theorganization, four were tactical defenders whose job was primarily to protect their machines and networks from attacks in realtime [7], and one was a developer with experience in tactical cyber analytics. Strategic analysts are accustomed to accessingfeeds of compressed network data from multiple installations via aSQL database. Their objectives include understanding the adversaries and broadly characterizing the threat. In contrast, tacticalanalysts access a wide variety of information from numeroussources using many different tools. Tactical analysts’ objectivesinclude maintaining situational awareness and rapid remediationof security problems.We used a large, tiled display made of eight thirty-inch panelsarranged in two stacked rows (Figure 1). The total display areawas nearly 33 megapixels in volume and was four to six timeslarger than the displays the analysts were accustomed to using.Figure 1: Our 33 MPixel display setupTo provide a framework for talking about displays and visualizations, we presented analysts with generic visualizations of Netflow and Snort alert data using SpotFire (http://spotfire.tibco.com)on the large screen. We also presented a cyber security scenarioderived from the upcoming 2009 VAST challenge data set [8] toseveral of the analysts in each category. We used these exhibits asmedia for conducting semi-structured interviews.The analysts told us about their duties, the tools they use, andhow they would use a large display. Some were enthusiastic aboutthe display; others were openly skeptical. Some liked the idea ofvisualizations, while others thought of visualizations as a waste oftime. One analyst was particularly critical of the visualizations heknew about. While describing how visualizations, “get in the wayof the data,” and are “good for people who want to be spoon-fed,”he casually noticed an interesting feature in a scatterplot visualization. He said, “that’s interesting,” drew closer and said, “Wow,that’s very interesting!” Then he went back to Excel and thecommand line to quantify exactly why it was interesting. Thisfeature turned out to be the solution to the problem he had beenworking at solving for two hours.3.1Why do cyber analysts dislike visualizations?Many of the talented analysts we interviewed, prefer the command line because of its unparalleled flexibility and expressivepower. While high-end graphics workstations with speedy processors, and large amounts of online storage make visualization ofcyber data viable, not all cyber analysts embrace visualization.Visualizations of cyber data frequently do not interoperate efficiently with other applications and utilities. Cyber analysts reportthat visualizations waste time because they require so much effortto import and export data with other tools. The visualizations thatfrustrate them display particular types of data in specific formats,and were rigidly designed to support preconceived workflowsrather than open-ended investigation. Many visual tools weredesigned to be a monolithic collection of all possible functionality(for example, [9][10][11]). Rather than text-based input and output, many tools use proprietary data formats that further limitinteroperability. In contrast, many of the text-based tools werebuilt on the highly interoperable UNIX model of “small is beautiful” and “do one thing well.” Analysts can build complex pipelines that connect the output of one tool to the input of the next.While visualizations provide useful information to analysts, theyavoid using them because of the frustration of noninteroperability.The cyber defenders we interviewed distrust visualizations thathide or smooth the underlying data. Access to the source data iscritical, but even with details on demand, many seemed morecomfortable looking at the actual data line by line. Another problem is that they want to be able to filter, join, and transform thedata without losing or altering the original. Visualizations seldomallow flexible manipulation of data, and they can give a feeling ofdistance and lack of control. One user feared he would irrevocablyalter the source data by manipulating the visualization.Cyber defenders distrust automated reasoning about their datain general because they are accustomed to poor performance ofintrusion-detection systems (IDS). The number of false positivesemitted by fielded IDS is truly staggering [12], and cyber attackers specialize in adapting their methods to produce false negatives[13]. The defenders we interviewed rely on their own experience,domain knowledge, and hunches over any automated warningsystem. Cyber security is essentially a human-on-human adversarial game played out by automated avatars. Human cyber attackerssucceed by learning to outwit defensive measures, and they oftendon’t follow the rules. For instance, pornographers use their customers as free labor to beat the defenses of sites that useCAPTCHAs (Completely Automated Public Turing test to tellComputers and Humans Apart) [14]. Cyber defenders havelearned the hard way that automated detection technologies areunable to defeat determined and creative human attackers. Thus,visualizations that simplify the real, messy data are suspect. It isthe simplification, not visualization itself that is untrustworthy,but the two are often conflated.Cyber domain experts from this and previous studies [15] oftenconsider visualizations to be gentle training for aspiring defenderswho have not yet gained sufficient knowledge to handle raw data.Experts consider the ability to read and manipulate massivestreams of textual cyber data as a hallmark of their expertise. Although these individuals are often very talented, unfortunately, asone of our interview subjects admitted, “We usually don't find thebad guys until after the fact.”When the analysts we interviewed would find the informationthey needed in a visualization, they would cross correlate it withother data manually. After noticing an important feature in a visualization of the VAST 2009 challenge data set, one analyst immediately switched to Excel to see exactly when the suspiciousevents occurred. The visualization was showing a join of the network activity and building access tables by person, but time wasnot shown. The analyst had selected several outliers, but the visualization (prototyped in SpotFire) had no way to take the selecteddata items and visually compare the periods of time when they
occurred. So the user switched to a different tool. This lack offlexibility makes visualizations an interesting curiosity, but useless for practical, open-ended investigations.3.2Huge volume and velocity of cyber dataAnother reason cyber defenders do not use visualizations is thatthey typically cannot handle the amount of data that they mustanalyze. For example, the U.S. Department of Energy (DOE) is awidely dispersed enterprise with over 100 sites and approximately500,000 computers. This enterprise yields an estimated 500 million events per day from sources distributed across North America. In the near future the number of daily log events generated isexpected to approach several billion. Contrast this need with theabilities of visualizations that strain to produce pictures of a million items [16] and are unable to do this in real time with streaming data. DOE analysts need a national perspective within secondsto minutes of an event to maintain situational awareness. Even ifcurrent visualizations could keep up, there would not be enoughpixels on the typical screen to handle this much data.Strategic analysts we interviewed reported having to analyzeabout 500,000 new NetFlow records daily in their individual assignments. They would also analyze trends by comparing currenttraffic with entries in a huge historical database. Tactical analystsdealt with a much wider variety of data types including packetheader data, host log files, vulnerability scanner reports, and external information from numerous sources. Thus, it was muchmore difficult to quantify an average amount of data that tacticalanalysts dealt with daily. One analyst reported typically getting toonly 25 to 30 percent of the investigations he wanted to achieve ina given day. Analysts expect the data volume to increase by several orders of magnitude in the future.One tactical analyst described how he begins his daily routineby examining a collection of blogs and websites to find out thenew vulnerabilities that developed during the night. Being inNorth America, he found it helpful to examine the reports fromEurope because new attacks often hit them first since they areahead in the day. From these reports he identifies a list of approximately 50 threats that he needs to examine that day. Heprioritizes this list to determine the top 10 that must be addressed.Of these, he is usually able to tackle the top 3-5 during the day.Slow database access, update, and retrieval causes slow refreshon visualizations, leading to user frustration. Frustrated users saidthings like, “[It’s] quicker to query!” and “I’d rather use grep.”Partly this could be alleviated by better database management;e.g., via query previews and incremental return of results. Butslow databases increase the need for a work environment thatsupports multi-tasking. As the user waits for a query to finish, shemay be browsing the Internet looking for more information on avulnerability, or perhaps researching compatibility issues othershad installing patches. Then, when the query finishes, the usershould be alerted to draw her attention back to that task.The most commonly used analytical tool was Microsoft Excel.Many analysts used Excel PivotTables to summarize large datasets. Because Excel 2003 PivotTables were limited to 65,536rows, analysts examined their data in small chunks. Several upgraded to Excel 2007 that allows a million rows in a PivotTable.Other analysts preferred to use databases to analyze data. In eithercase, the true limiting factor was the speed of access.One cyber security analyst used Microsoft Excel’s conditionalformatting to display the numbers of successful connections madeby pairs of IP addresses as a colored heat map. He used the map toidentify unique pairings of IP addresses and connection patternsindicative of botnet activity. The data-size limitations of Exceland the encumbrances it presents to import and manipulate thedata are a price he is willing to pay to create visual patterns that hecan quickly recognize.Visualization designers must consider carefully how much datato store, how long to store it, and how to provide timely access todata that is needed. Perhaps an adaptive strategy that predictivelyfetches data associated with features like the ones the user hasmost recently investigated would help. Unfortunately, the hugevolume and velocity of the data cyber analysts must deal withcauses them to have to investigate in real time or risk losing thedata forever. For example, when analysts identify a communication pattern they need to investigate more closely, they must immediately remotely log in to the affected machine to examinevarious transient details such as current processes, performancestatistics, and file system status, which are not logged [5]. Thus,they are likely to miss transient indicators of the problems theyare investigating.3.3Diversity of data sources challenges toolsCyber analysts draw information from a variety of internal andexternal sources to create a context to help them interpret individual events and sequences of events. External sources include newsstories, announcements from vendors, official bulletins, vulnerability clearinghouses, and social media like blogs, wikis, Twitter,Facebook, etc. Internal sources include network flows, packettraces, host and application log files, logs from firewalls, IDSs,special host-based monitoring software, and reports from vulnerability scanners, etc. In large hierarchies of organizations, all defenders generally have access to external data sources, butdefenders outside a particular site may not have access to datasources internal to that site. Strategic defenders who are responsible for multiple sites may not be interested in any more than highlevel network flow records and IDS alert data since they would beoverwhelmed if the internal data from all their sites were available. Additionally, internal data are often very sensitive and maybe proprietary to the originating organizations.Pulling information from online free-form text sources to use asa query for a visualization is another task that analysts expressedinterest in. For example, an analyst might ask, “show me any ofmy database servers that made web responses on port 1311 to ahost listed as ‘bad’ in an official bulletin.” Such queries are easyto frame verbally but they require a great deal of tool flexibility.One reason cyber analytics is so difficult is that separate datasources are difficult to join in an absolute time sequence. First,sensors on separate machines may not be time synchronized. Second, some alerts are time-stamped when an event is triggered;others receive a timestamp only after a series of events has occurred. Finally, some alerts are logged without any timestamp,making them extremely difficult to join with other data sources.3.4Need to have direct access to the dataTo the cyber analysts we interviewed, visualizations hide whatis going on with the data. They want to know why the visualization shows what it shows. Being able to drill down and get asmuch detail as possible when needed is a critical requirement.When using visualizations in our study, analysts would typically investigate spikes (or other irregularities) to determine whatcaused the feature. Unfortunately, in the interest of efficiency,many visualizations do not store all the data or may overaggregate, effectively smoothing out “noisy” data. But the adversary seeks to hide in the noise, and over-aggregation contributesto his camouflage.Most cyber analysts have been exposed to poorly designedvisualizations that prejudice them against all visualization. Commonly cited examples are the simplistic visual charts that accompany many of IDS software systems. These charts over-aggregatethe data and reveal only the dominant patterns in IP traffic.Sometimes that is useful for seeing major spikes in traffic, but thedevil they seek is quite literally hidden in the omitted details.
Such charts often provide extremely limited interactivity so analysts cannot drill down to investigate.Other cited examples of poorly designed visualizations arethose that are generic data visualization tools and not designed forthe specific nuances of cyber security. For example, viewing textual values of cyber data is extremely important in certain cases.We observed cyber analysts scanning rows and columns of data intextual spreadsheet format for specific sets of values. Cyber analysts are very skilled at recognizing specific IP address octet values, specific IP port numbers, or specific countries of origin. Forexample, in cyber security there is a big difference between themeaning of port 80 and port 81, but in a generic scatterplot ofpacket header data where port number is visually encoded ormapped to an axis, these two ports may be visually indistinguishable. Displaying values when mousing over a dot in the plotwould require the analyst to hover over every dot in the vicinity tocheck its actual value. Simply visually scanning a column of textvalues or using grep is actually much faster. Embedding textvalues directly into the visualization could be a potential solutionon large displays that offer more space.3.5Quest for a queryAs we observed cyber analysts in action, we began to refer totheir general approach as the “quest for a query.” When they investigate an incident, they proceed through a complex analyticprocess of data foraging and sensemaking to identify the suspicious phenomenon. They explore the data in a variety of ways,essentially looking for a descriptive “query” that returns only thedata that concerns the phenomenon that they are investigating.The query must have acceptable degrees of precision and recall sothat they can associate the query with a named phenomenon like“users who accessed their computers during odd hours.”Thus, an important product of their analysis is the set of datathat represents the occurrence of a phenomenon. However, aneven more important product is the “query” itself, the process theyused to find the data. In some cases, the query is directly identified at the end of their process, perhaps as a final SQL query. Butmore often, the query is a record of the process an analyst mustundertake to obtain the same results in another instance of thesame problem. That is, the long sequence of interactions theyperformed to analyze (process, filter, sort, visualize, reorganize,etc.) the data essentially forms the query. The process is theproduct. This observation emphasizes the importance of capturing the interactive process and reformulating it into query spacethat can be reused and shared.We believe this query-seeking behavior is related to specifyingsignatures that can be used to automatically find suspect activityor to filter out known safe activity. Finding reusable queries thatbecome part of their domain knowledge is a key goal of cyberanalysts that makes them more effective. Once a rule is developed for a specific threat, it can protect the analyst’s network fromthat threat forever. However, it can also be reused to assist indeveloping new rules for similar threats, such as with virus derivatives, thereby enabling the analyst to rapidly adapt to the constantly changing cyber battlefield. Maintaining rule sets is acommon problem for analysts. Rule sets grow large and individualrules become out-of-date quickly. Analysts may not be motivatedto share rules because they represent the hard-earned expertisethat is an analyst’s livelihood.Visualizations could become more effective tools for cyber analysts if they took advantage of this query-seeking behavior toautomatically generate queries based on the features the analystspent the most time investigating. Some of the cyber analysts wetalked to were SQL experts, not by desire or interest, but by ne-cessity. We believe we could better serve these users by providingtools that help frame queries through natural interactions with avisualization rather than via manual SQL statements [17].A problem with command-line queries is that they force theanalyst to formalize their hypotheses too soon. At the beginningof an investigation when there is much uncertainty, analysts arefrequently unsure of what to query and need more exploratorymeans. Visualization tools can support a form of ‘incrementalformalism’ [18][19] that gives analysts the opportunity to beginwith informal hypotheses and gradually increase the rigor of theirquery until the security threat is clearly identified. An example ofincremental analysis is a tool called ProSPECT that enables analysts to arrange data sources, marshal data that is relevant to theproblem at hand, and create and analyze multiple competing hypotheses that are supported or refuted by the data [20][21].3.6Long sequences of activitiesFrequently, the quest for just the right query (with acceptablelevels of observed precision and recall) takes analysts through along series of views of the data. But when this process takeshours, or even days to accomplish, they easily forget the steps thathelped them arrive at their conclusion. Without a clear recollection of the steps, it is hard for the analyst to report on or sharetheir process with others.For example, analysts that used SQL queries frequently iteratedthrough many versions of a query while refining it. For versioncontrol, they would label resulting table views incrementally,helping them to backtrack and remember how they got to theirfinal query. Unfortunately, the views do not keep a history of thequeries used to create them, and very few analysts write notesabout their queries, so other forms of process tracking are necessary. One analyst pointed out that when he reuses a query he created in the past, he frequently forgets why he made the query ashe did. By looking at a query history, he could reconstruct histhought process and remember the reasoning.Similarly, the analysts that use Excel frequently save versionsof a dataset as they try different pivot tables. However, they oftenforget which strategies they have already tried and cannot easilyreturn to previous results. Worse, most of the analysts used multiple tools, and tracking processes across them was difficult.Recording query development history would allow an analyst tolearn from his/her own mistakes and to help others avoid wastingeffort on unproductive paths. A large display such as the one weused could allow presentation of these steps by taking snapshotsas windows changed. But producing a record that spans multipleactivities, times, and tools is difficult. Command-line users frequently use their command history to repeat variations on previous actions, but no analogous method exists that spans the manytools available to cyber analysts.3.7Many Windows and Multi-taskingEach investigation typically involves many windows, and analysts typically multi-task among several open investigations. Thetypical analyst workstation we saw in our study had one or twomoderate-resolution displays with 20 to 40 windows open at atime representing multiple active investigations. This meant thatmore windows were covered or minimized than were visible atany given time. One analyst cited a typical scenario by saying,“I’ve pulled up an Excel file and I’ll look, and say ‘I don’t understand what I’m looking at,’ and that’s because it’s another case Istarted two days ago, and it’s just the wrong window or tab.”Most of them had a dual screen system, which they complainedwere not nearly large enough. They typically used one screen as
their primary workspace for analysis tools, and the other for reference or awareness tools. But the layering of windows affords nospatial memory of where a window was located. With a largedisplay, after a study, we would conduct the post interview andblack out the screen. We found it was common for analysts topoint to areas of the black screen and say things such as, “when Iwas working with the prox data, over here ” demonstrating to usthat they had naturally organized their work space and remembered where they had put different data sources.Some windows were awareness tools such as security alertwebsites that they frequently referred to; others were tools thatthey commonly used during most analyses, such as DNS lookup.These reference windows were left open for easy occasional access. Other windows were more transient with data-analysis toolspertinent to the current investigation. Some analysts said they hadto constantly flip through several reference alert windows or tabsthroughout the day to avoid missing alerts. Another analyst described a situation in which he had to open many windows tosimultaneously log in to a many remote hosts to perform administration tasks and monitor performance.Analysts had difficulty organizing these windows effectively ontheir dual-screen workstations. They wanted to be able to organizethe windows for each analysis into a separate group, or “case.”Some applications used tabs to re
ples for usable cyber analytic workspaces that our studies have brought to light. Finally, we present prototypes designed to meet our guidelines and a usability evaluation of the environment. KEYWORDS: Cyber analytics; cyber security; visualization; usabil-ity; large, high-resolution displays; cognitive task analysis.