Transcription
NORTHAMERICAFIT-OUTCOST GUIDEOccupier Projects 2016/17 Edition
TABLE OF CONTENTSExecutive Summary // 2Market Overview: Where’s the top? // 4Benchmarking Guidelines // 6Guide Assumptions // 8Regional Market Summaries // 9GWS Account Summaries // 35
EXECUTIVE SUMMARYBY THE NUMBERS143Average cost (USD ) per rentable square footto build office space in North America.The most expensive market in North America is San Francisco,averaging USD 223/SF. This is just slightly higher than New York City atUSD 221/SF. The least expensive market is Indianapolis (USD 59/SF).24,395The average cost per seat ( USD) is calculated by utilizing the total number of‘seats’ (office or cubicle) as the denominator and total cost as the numerator.171Average number of square feet per personor ‘seat’, also defined as space density. 2016 CBRE CONFIDENTIAL & PROPRIETARY
DATA SETDATA COLLECTED REPRESENTS 2016 COSTSInflation applied to 2015 data set196 SAMPLES36 GWS Accounts33 LMAs43 Markets18 IndustriesANALYSIS INCLUDES:Average Office Costs – Cost Category Breakdown & Total CostOffice Costs – High to LowCost RatiosCost per SeatSpace Plan UsageSchedule: Build Time – Minimum and MaximumPROJECT MANAGEMENT NORTH AMERICA FIT-OUT COST GUIDE 3
MARKET OVERVIEWWHERE’STHE TOP?The last twelve months have seen an already buoyant market continue to show strongsigns the boom isn’t over just yet.Whilst some markets have softened slightly from the highs of the proceeding twelvemonths, there is still enough volume of work that construction costs are merely increasingat a steadier rate compared to the sharp uptick experienced from 2014 to 2015.However, some markets are extremely hot with San Francisco, Silicon Valley and thePacific North West leading the country in market escalation. These particular marketshave a wealth of work with the technology sector and are building at rapid rates. Thissector has a glut of large project opportunities and these projects are sapping the available labor and driving up construction costs across all sectors.In the New York market that is typically at the forefront of construction escalation due tothe large amount of capital being spent year over year, there has been much speculationas to where the top of the market is. Whilst most indicators point to a slowdown, construction opportunities remain plentiful and the labor markets tight, keeping New York’s costsclimbing in line with the expected averages. The top does not seem to be in sight.As far as Commercial Tenant Improvement trends, there has been a visible increase inthe amount of densification projects similar in the way CBRE’s office 360 initiative haschanged the aesthetic, function and footprint of our own spaces. The trend of benching,plug and play desks and a move away from large overbearing cubes and offices isaltering the way construction capital is being spent as companies take on less leasedspace and decrease space per desk and per employee. 2016 CBRE CONFIDENTIAL & PROPRIETARY
MARKET OVERVIEWCompanies are saving capital through smaller space leases, but as far as constructioncosts go, the dollars are often just switching cost centers as more people in a smallerarea drives up the construction costs to heat and cool whilst furniture costs are reduceddue to the move from cubes and single office furniture to benches. These tradeoffs maynot often increase the project total, but often mean higher costs per square foot as moreprogram and scope is packed into a reduced rentable square footage.This trend of densification is very much symbolic of the mobile and flexible workforceand “model breakers” such as WeWork, the technology sector and the start-up culture.As companies become paperless and the tether to the desk is being cut, this trend isbeing taken on by many sectors, including law firms and financial services firms whotraditionally have always had larger, denser and more expensive spaces.For the forthcoming year, it is recommended that construction escalation be carried forfuture projects that are not imminent and with long design phases. Local market pressuresshould be factored whenever entering different market places. We are not at the top yet.Andrew SumnerDirectorCost ConsultancyPROJECT MANAGEMENT NORTH AMERICA FIT-OUT COST GUIDE 5
BENCHMARKING GUIDELINESINTERPRETATION FORINDIVIDUAL USEBenchmarking is an excellent way to understand the potential cost of a constructionproject ahead of formally developing estimates and beginning construction. When usingbenchmarking, there is always a duty of care the user needs to take when analyzing andinterpreting the data for individual use. Guidelines to consider, when using a documentsuch as this, have been outlined below.1. BE COGNIZANT OF LOCATION. As the cost guide demonstrates, there are somelarge regional differences. It is always important to try and narrow the range byworking with historical data from the particular location.2. THINK ABOUT INDUSTRY SECTOR. Sector is equally important. Law Firms,Banking and Finance and large Tech clients tend to be at the top end of the spectrum, while Industrial and more generic office space leans toward the lower end. Itis vital to understand where on the spectrum, or where in the range, your particularindustry falls.3. UNDERSTAND THE MARKET. The benchmarks provided in this Cost Guide donot accommodate for the current bidding climate. Markets such as Seattle, SanFrancisco, New York and Portland are some of the most volatile bidding climatestoday. With the “opportunity escalation” in these markets, bids are coming in muchhigher than expected; therefore, even the most accurate benchmarking may nothold for the market nuances. 2016 CBRE CONFIDENTIAL & PROPRIETARY
BENCHMARKING GUIDELINES4. LEARN THE BUSINESS REQUIREMENTS. A client’s business requirements willalways be the number one variable. When trying to narrow the cost range for aclient, bear in mind aesthetic factors that may significantly move the price pointneedle.5. OPERATE WITHIN A RANGE. Trying to get to an exact cost per square footwithout having any drawings is virtually impossible – don’t try! Use a range to getcomfortable with the potential fit-out cost.6. BE AWARE OF ECONOMIES OF SCALE. Economies of scale are always in playwhen looking at cost per square foot. A 10,000 RSF project, on average, will generally be higher than a 50,000 RSF project because the cost is amortized over alarger square footage.7. RSF VERSUS USF. Loss factor on RSF varies from building to building and fromstate to state. For the purpose of this cost guide, all data is reported in RSF. Nonational nuances have been factored.Ultimately, the benchmarking provided in this document will help guide the budgetdevelopment process. It is an educated starting point. Final budget estimates need to bevetted and created once scope is clarified and detailed variables are defined.PROJECT MANAGEMENT NORTH AMERICA FIT-OUT COST GUIDE 7
GUIDE ASSUMPTIONSNORTH AMERICA ONLYThe rentable square footage is 20,000 RSF for an assumed leasedasset in a new location for the client. The space is a non-customerfacing corporate commercial office environment.The main data room is 500 RSF within the client space withsupplemental cooling, but excluding backup UPS or generator.Work is completed with single shifts in regular time. The landlord hasprovided a ‘warm dark shell’ which is defined as: Clear space, no demolition required Includes fire wet pipe sprinkler horizontal distribution throughout Flat floor, no raised flooring Floor main electrical panels Floor main mechanical cooling with duct headers to core walls Finished restrooms for Men & Women matching building standard Exterior blinds matching building standard Wall board applied to interior of exterior and core walls 2016 CBRE CONFIDENTIAL & PROPRIETARY
REGIONALMARKETSUMMARIES
OFFICE COSTS BY CATEGORYIncludes both GWS Accounts and LMAs3%1%5%5%Construction(HardDesignand CA(SoftCostsCosts)FF & ECostsMoveITFees26%FeesIT60%FF& ECostsMoveConstruction(HardDesign and CA(SoftCostsCosts)AVERAGE OFFICE COST/SF BY MARKETIncludes both GWS Accounts and LMAsDesign & CA(soft costs)Construction(hard costs)FF&EITFeesMoveCostsTOTALCOST/SFAtlanta 6.13 70.77 34.39 2.00 4.25 0.86 118.40Austin 8.63 102.86 27.76 1.25 3.42 1.46 145.38Birmingham 4.17 46.51 25.00 1.52 2.61 1.91 81.72Boston 11.64 115.39 40.84 8.24 3.54 3.78 183.43Calgary 4.78 81.91 24.83 6.97 4.43 2.18 125.10Carolinas 4.81 76.97 43.50 11.50 3.11 2.49 142.39Chicago 11.45 114.56 29.52 3.33 3.43 1.61 163.90Cincinnati 2.46 40.09 22.69 2.16 1.13 0.37 68.89Columbus 5.17 43.00 22.33 5.10 2.17 2.83 80.60Dallas 5.23 61.54 41.12 7.28 3.63 2.06 120.86DC 8.04 96.25 35.14 12.07 2.16 1.09 154.75MarketPROJECT MANAGEMENT NORTH AMERICA FIT-OUT COST GUIDE 11
Design & CA(soft costs)Construction(hard costs)FF&EITFeesMoveCostsTOTALCOST/SFDenver 4.83 63.08 37.40 12.28 3.11 1.21 121.92Detroit 6.12 57.44 47.72 6.50 3.00 1.78 122.55Florida 6.36 63.03 32.23 10.78 3.21 1.77 117.38Hartford 2.03 80.52 21.27 0.60 5.17 2.72 112.31Houston 5.90 58.29 58.80 10.83 2.37 2.30 138.49Indianapolis 1.22 26.47 25.00 2.07 3.89 0.84 59.49Kansas City 4.24 58.38 22.73 2.10 2.07 1.21 90.72Little Rock 8.45 52.71 32.97 5.92 2.87 0.05 102.97Los Angeles 8.43 104.31 41.69 12.72 6.40 3.30 176.86Memphis 3.75 54.50 26.00 2.40 1.29 0.86 88.80Milwaukee 4.31 55.19 24.08 4.01 2.74 2.96 93.30Minneapolis 3.53 44.76 27.15 8.03 4.43 0.49 88.40Montreal 5.59 58.18 63.93 4.02 2.58 3.98 138.28Nashville 5.08 62.96 33.43 5.83 3.04 2.69 113.03New Jersey 9.01 107.75 34.58 17.82 6.85 3.24 179.26New Mexico 5.15 38.98 28.28 18.28 4.67 0.00 95.37 14.03 153.08 44.77 4.40 2.23 2.49 221.01Oklahoma 2.94 59.56 9.99 2.70 0.00 2.56 77.75Orange County 8.25 161.00 35.00 6.50 1.35 1.50 213.60Ottawa 3.76 36.38 27.75 2.51 3.37 0.77 74.52Philadelphia 5.29 85.85 45.04 4.21 4.94 0.80 146.12Phoenix 5.78 59.26 31.12 7.59 2.42 1.79 107.95Pittsburgh 5.40 72.07 31.34 2.12 2.69 1.05 114.67Portland 13.62 135.03 42.90 5.00 2.35 0.59 199.49San Diego 11.04 88.53 35.87 9.51 7.06 1.63 153.66San Francisco 11.97 147.11 44.94 13.28 3.88 1.75 222.92Saskatoon 4.96 88.87 23.41 0.00 5.46 0.40 123.09Seattle 9.67 111.32 32.08 13.43 4.43 1.47 172.40St Louis 9.50 96.93 40.00 10.00 5.48 2.50 164.41Toronto 7.39 71.75 31.76 3.78 3.82 2.55 121.06Vancouver 13.10 86.78 36.95 0.00 7.34 0.69 144.86Winnipeg 5.33 70.81 17.30 2.91 3.90 6.82 107.06MarketNYC 2016 CBRE CONFIDENTIAL & PROPRIETARY
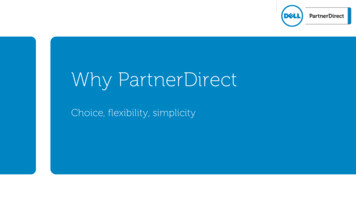
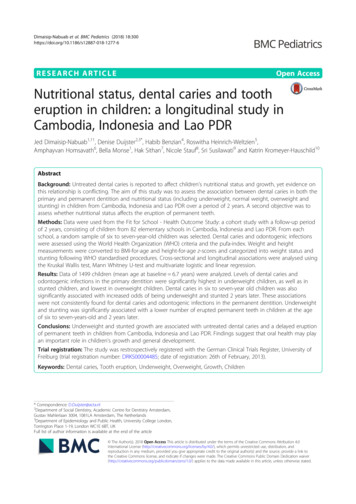
AVERAGE OFFICE COST/SF BY MARKETIncludes both GWS Accounts and LMAsThe North American analysis included forty-two (43) cities or regions where the cost analysis wascompleted. The chart below shows the cost distribution across these markets in alphabetical orderranging from a low of USD 59.49 per rentable square foot (RSF) in Indianapolis to a high ofUSD 222.92 per RSF in San Francisco. 250 200 100 aHartfordHoustonIndianapolisKansas CityLittle RockLos eNew JerseyNew MexicoNYCOklahomaOrange an DiegoSan FranciscoSaskatoonSeattleSt LouisTorontoVancouverWinnipegCOST PER SF (USD) 150Design & CA (Soft Costs)Const (Hard Costs)FF & EITFeesMove CostsPROJECT MANAGEMENT NORTH AMERICA FIT-OUT COST GUIDE 13
0 221.01 222.92NoCal 250NY 173.21 157.08 151.12 200SoCalNorthwestNortheast 125.60 50Canada 100 122.75 119.91 115.82 106.38 150South CentralSoutheastMidwestSouthwestCOST PER SF (USD)AVERAGE OFFICE COST/SF BY REGIONAL MARKETIncludes both GWS Accounts and LMAs: Low to High 2016 CBRE CONFIDENTIAL & PROPRIETARY
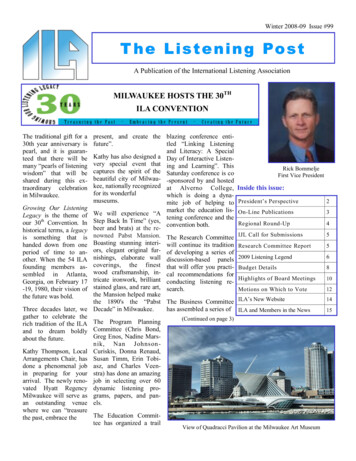
200AVERAGECOST PER SF: 143.04 150 1000 59.49 68.89 74.52 77.75 80.60 81.72 88.40 88.80 90.72 93.30 95.37 102.97 107.06 107.95 112.31 113.03 114.67 117.38 118.40 120.86 121.06 121.92 122.55 123.09 125.10 138.28 138.49 142.39 144.86 145.38 146.12 153.66 154.75 163.90 164.41 172.40 176.86 179.26 183.43 199.49 213.60 221.01 222.92 minghamMinneapolisMemphisKansas CityMilwaukeeNew MexicoLittle hiaSan DiegoDCChicagoSt LouisSeattleLos AngelesNew JerseyBostonPortlandOrange CountyNYCSan FranciscoCOST PER SF (USD)AVERAGE OFFICE PROJECT COST/SF BY CITY MARKETIncludes both GWS Accounts and LMAs: Low to High 50PROJECT MANAGEMENT NORTH AMERICA FIT-OUT COST GUIDE 15
OFFICE COST/SF BY MARKETIncludes both GWS Accounts and LMAsThe tables below provide the maximum, minimum and average cost per RSF in US dollars. Somemarkets received multiple inputs from different GWS accounts within the same local market whichled to the range of figures. For example, a West coast San Francisco based GWS account may haveprovided input relative to an Atlanta project, therefore the data was assessed as an Atlanta lanta 185.40 66.78 118.40Minneapolis 108.53 68.26 88.40Austin 178.06 121.50 145.38Montreal 198.54 78.01 138.28 81.72 81.72 81.72Nashville 141.47 96.57 113.03Boston 248.00 147.32 183.43New Jersey 227.25 128.03 179.26Calgary 125.10 125.10 125.10New Mexico 95.37 95.37 95.37Carolinas 183.60 107.63 142.39NYC 279.00 183.64 221.01Chicago 309.00 130.43 163.90Oklahoma 77.75 77.75 77.75Cincinnati 87.12 50.66 68.89 213.60 213.60 213.60Columbus 91.95 70.65 80.60OrangeCountyDallas 158.61 91.13 120.86Ottawa 74.52 74.52 74.52DC 214.60 80.74 154.75Philadelphia 186.81 95.85 146.12Denver 158.54 71.60 121.92Phoenix 143.36 63.30 107.95Detroit 146.08 104.79 122.55Pittsburgh 175.00 66.42 114.67Florida 179.52 70.46 117.38Portland 199.49 199.49 199.49Hartford 139.85 78.64 112.31San Diego 210.53 88.84 153.66Houston 195.24 115.31 138.49San Francisco 269.75 111.65 222.92Indianapolis 59.49 59.49 59.49Saskatoon 128.29 117.90 123.09Kansas City 118.41 70.49 90.72Seattle 249.00 107.05 172.40Little Rock 102.97 102.97 102.97St Louis 216.00 112.81 164.41Los Angeles 210.03 145.21 176.86Toronto 192.41 71.57 121.06Memphis 102.54 75.05 88.80Vancouver 164.76 115.87 144.86Milwaukee 109.39 77.20 93.30Winnipeg 107.06 107.06 107.06MarketBirminghamMarket 2016 CBRE CONFIDENTIAL & PROPRIETARY
artfordHoustonIndianapolisKansas CityLittle RockLos eNew JerseyNew MexicoNYCOklahomaOrange an DiegoSan FranciscoSaskatoonSeattleSt LouisTorontoVancouverWinnipegCOST PER SF (USD)OFFICE COST PER SF BY MARKET: HIGH TO LOWIncludes both GWS Accounts and LMAs 350 300 250 200 150 100 50PROJECT MANAGEMENT NORTH AMERICA FIT-OUT COST GUIDE 17
COST RATIOS: RELATIVE COST TO DENVERIncludes both GWS Accounts and LMAsMany clients require office sites across the country and internationally. A common question is therelative cost of one site to another site. This is where the external factors begin to have significantimpact to project costs. A client can be requiring the same type of space, aligned with their designstandards, but should not assume the similar cost factors. Our CBRE exercise selected Denver as thebaseline equaling 1.00 with the average cost per RSF at USD 121.92. All other markets were thenassessed on the average cost per RSF against Denver to create a ‘Cost Ratio: Relative Cost to Denver’.This chart presents a useful radar diagram of relative wa1.83Orange n1.50New Jersey1.61.47Los 11.450.571.410.491.4Memphis0.73Kansas City0.730.74St Louis1.35Chicago0.771.21.340.840.21.01.26San uverWinnipeg0.891.19AustinLittle Rock0.880.4PhiladelphiaNew DenverTorontoDallas 2016 CBRE CONFIDENTIAL & PROPRIETARY
AVERAGE OFFICE COST PER SEAT BY REGIONAL MARKETIncludes both GWS Accounts and LMAs: Low to High 43,940 50,000 36,527 45,000 40,000 28,744 28,651 23,507 22,661 20,444 16,458 20,000 15,767 25,000 19,449 30,000 15,000 10,000NYNoCalNortheastSoCalNorthwestSouth CentralSoutheastCanada0Southwest 5,000MidwestCOST PER SEAT (USD) 35,000PROJECT MANAGEMENT NORTH AMERICA FIT-OUT COST GUIDE 19
AVERAGECOST PER SEAT: 30K 24,395 20K 10K0 8,311 8,879 9,126 10,282 13,075 14,180 14,273 14,690 14,757 14,853 16,361 17,505 17,832 18,047 18,361 18,912 19,198 19,520 19,764 19,971 20,251 22,960 22,968 23,449 23,641 23,650 23,727 23,842 24,058 24,249 24,328 25,145 25,769 26,954 28,211 28,877 29,159 30,772 31,948 34,300 36,527 40KCincinnatiIndianapolisNew ancouverDenverSan DiegoKansas dAtlantaNew JerseyLos AngelesLittle RockBostonAustinSt LouisDCPhiladelphiaSan FranciscoNYCOrange CountyCOST PER SEAT (USD) 50K 43,940 52,741AVERAGE COST PER SEAT BY MARKETIncludes both GWS Accounts and LMAs: Low to High 60K 2016 CBRE CONFIDENTIAL & PROPRIETARY
artfordHoustonIndianapolisKansas CityLittle RockLos eNew JerseyNew MexicoNYCOklahomaOrange an DiegoSan FranciscoSaskatoonSeattleSt LouisTorontoVancouverWinnipegSEATSSPACE PLAN USAGE BY MARKETIncludes both GWS Accounts and LMAs25020015010050WorkstationOfficeBench / Hotel SeatPROJECT MANAGEMENT NORTH AMERICA FIT-OUT COST GUIDE 21
SPACE PLAN USAGE: DENSITY BY REGIONAL MARKETIncludes both GWS Accounts and LMAs: Low to High154CanadaSQUARE FEET134150149158161NoCalSouthwest16219 4South rthwest0Southeast50 2016 CBRE CONFIDENTIAL & PROPRIETARY
58157154153149149200228219247247250Little RockKansas CityOklahomaOrange askatoonMilwaukeeDenverSt CarolinasMemphisSan FranciscoBirminghamDallasBostonVancouverFloridaNew JerseyLos AngelesIndianapolisSan olumbusCincinnatiPortlandDetroitNew MexicoSQUARE FEET274269SPACE PLAN USAGE: DENSITY BY MARKETIncludes both GWS Accounts and LMAs: Low to High300AVERAGEDENSITY:1 person/171 SF50PROJECT MANAGEMENT NORTH AMERICA FIT-OUT COST GUIDE 23
SCHEDULE: AVERAGE BUILD TIME IN MONTHS BY MARKETIncludes both GWS Accounts and LMAs by marketThe schedules provided in the charts below define the average build time in months. It is the length oftime from construction start to substantial ryMinneapolisNew MexicoColumbusSeattleSt LouisChicagoHoustonPittsburghKansas CityNew ianapolisLittle RockLos AngelesMemphisNashvilleOklahomaOrange San DiegoSan FranciscoPhoenixNYCMilwaukeePortlandMontreal 2016 CBRE CONFIDENTIAL & PROPRIETARY
CANADAMETRICAVERAGEHIGHLOWCost / SF TOTAL (USD ) 125.60 198.54 71.57Cost / Seat (USD ) 19,449 34,210 7,12515491267Space Density (1 person per xxx SF)With the exception of Calgary, average construction schedule cycle times are longer inCanada than most US markets.Average Office Project Cost by Market 160 144.86 138.28 140 125.10 123.09 120 121.06COST PER SF (USD) 107.06 100 80 74.52 60 40 innipegPROJECT MANAGEMENT NORTH AMERICA FIT-OUT COST GUIDE 25
MIDWESTMETRICAVERAGEHIGHLOWCost / SF TOTAL (USD ) 115.82 309.00 50.66Cost / Seat (USD ) 15,767 61,800 6,66613471200Space Density (1 person per xxx SF)The Midwest is the least expensive market as it relates to cost per seat. This correlates tothe statistics showing that this region designs space with the highest density, on average.Average Office Project Cost by Market 180 163.90 160 140 122.55COST PER SF (USD) 120 100 93.30 88.40 80.60 80 68.89 59.49 60 40 waukeeMinneapolis 2016 CBRE CONFIDENTIAL & PROPRIETARY
NORTHERN CALIFORNIAMETRICAVERAGEHIGHLOWCost / SF TOTAL (USD ) 222.92 269.75 111.65Cost / Seat (USD ) 36,527 66,107 14,82316175267Space Density (1 person per xxx SF)San Francisco has the highest build-out cost in North America.Average Office Project Cost by Market 250 222.92COST PER SF (USD) 200 150 100 500San FranciscoPROJECT MANAGEMENT NORTH AMERICA FIT-OUT COST GUIDE 27
NORTHEASTMETRICAVERAGEHIGHLOWCost / SF TOTAL (USD ) 151.12 248.00 66.42Cost / Seat (USD ) 28,744 49,698 9,49619753364Space Density (1 person per xxx SF)The Northeast has one of the lowest space densities in North America.Average Office Project Cost by Market 200 183.43 179.26 180 154.75 160 146.12COST PER SF (USD) 140 120 114.67 112.31 100 80 60 40 200BostonDCHartfordNew JerseyPhiladelphiaPittsburgh 2016 CBRE CONFIDENTIAL & PROPRIETARY
NORTHWESTMETRICAVERAGEHIGHLOWCost / SF TOTAL (USD ) 157.08 249.00 71.60Cost / Seat (USD ) 23,507 56,563 8,85014964339Space Density (1 person per xxx SF)Average Office Project Cost by Market 250 199.49 200COST PER SF (USD) 172.40 150 121.92 100 500DenverPortlandSeattlePROJECT MANAGEMENT NORTH AMERICA FIT-OUT COST GUIDE 29
NEW YORKMETRICAVERAGEHIGHLOWCost / SF TOTAL (USD ) 221.01 279.00 183.64Cost / Seat (USD ) 43,940 111,155 19,53119878500Space Density (1 person per xxx SF)New York has the second highest build-out cost and the highest cost per seat in NorthAmerica. The high cost per seat correlates to the low space density.Average Office Project Cost by Market 250 221.01COST PER SF (USD) 200 150 100 500New York City 2016 CBRE CONFIDENTIAL & PROPRIETARY
SOUTHERN CALIFORNIAMETRICAVERAGEHIGHLOWCost / SF TOTAL (USD ) 173.21 213.60 88.84Cost / Seat (USD ) 28,651 52,741 12,005162118247Space Density (1 person per xxx SF)Average Office Project Cost by Market 250 213.60 200COST PER SF (USD) 176.86 153.66 150 100 500Los AngelesOrange CountySan DiegoPROJECT MANAGEMENT NORTH AMERICA FIT-OUT COST GUIDE 31
SOUTH CENTRALMETRICAVERAGEHIGHLOWCost / SF TOTAL (USD ) 122.75 216.00 70.49Cost / Seat (USD ) 22,661 46,191 12,048194118476Space Density (1 person per xxx SF)Average Office Project Cost by Market 180 164.41 160 145.38 138.49 140 120.86COST PER SF (USD) 120 102.97 100 90.72 77.75 80 60 40 200AustinDallasHoustonKansas CityLittle RockOklahomaSt Louis 2016 CBRE CONFIDENTIAL & PROPRIETARY
SOUTHEASTMETRICAVERAGEHIGHLOWCost / SF TOTAL (USD ) 119.91 185.40 66.78Cost / Seat (USD ) 20,444 45,651 6,13916971333Space Density (1 person per xxx SF)Average Office Project Cost by Market 160 142.39 140COST PER SF (USD) 120 118.40 117.38 113.03 100 88.80 81.72 80 60 40 lePROJECT MANAGEMENT NORTH AMERICA FIT-OUT COST GUIDE 33
SOUTHWESTMETRICAVERAGEHIGHLOWCost / SF TOTAL (USD ) 106.38 143.36 63.30Cost / Seat (USD ) 16,458 28,806 7,72115867286Space Density (1 person per xxx SF)The Southwest has the lowest average build-out cost in North America.Average Office Project Cost by Market 120 107.95100 95.37COST PER SF (USD)806040200New MexicoPhoenix 2016 CBRE CONFIDENTIAL & PROPRIETARY
GWSACCOUNTSUMMARIES
AVERAGE OFFICE COST/SF BY GWS ACCOUNTDesign & CA(soft costs)Construction(hard costs)FF&EITFeesMoveCostsTOTALCOST/SFClient 01 7.95 98.27Client 02 7.31 84.75 55.59 9.49 0.00 4.10 175.40 64.06 11.18 2.12 4.92 174.34Client 03 5.98 75.15 40.68 19.66 9.31 1.06 151.84Client 04 8.67 96.90 35.70 5.10 7.14 5.10 158.61Client 05 6.94 66.57 25.19 11.57 3.61 2.49 116.36Client 06 12.33 129.00 49.33 0.00 1.11 3.00 194.77Client 07 8.55 108.99 35.20 19.13 0.00 0.26 172.12Client 08 9.05 96.32 39.98 0.00 0.00 1.96 147.32Client 09 10.00 120.00 50.00 0.00 5.40 0.00 185.40Client 10 4.61 53.41 50.57 15.87 5.17 2.56 132.19Client 11 12.00 166.00 60.00 5.00 3.00 4.00 250.00GWS AccountClient 12 3.96 32.42 71.53 3.26 2.20 1.28 114.65Client 13 10.00 115.00 23.00 25.00 7.00 5.00 185.00Client 14 25.33 222.00 26.33 0.00 3.00 0.00 276.67Client 15 5.33 70.81 17.30 2.91 3.90 6.82 107.06Client 16 13.62 135.03 42.90 5.00 2.35 0.59 199.49Client 17 6.06 57.66 37.40 6.10 3.45 1.79 112.45Client 18 7.60 57.00 38.00 0.00 0.00 3.80 106.40Client 19 10.96 152.18 37.85 11.48 5.00 2.50 219.96Client 20 9.00 127.00 35.00 0.00 8.00 6.00 185.00Client 21 10.12 62.72 32.85 17.25 7.83 2.80 133.57Client 22 13.74 115.90 40.85 1.49 2.79 1.11 175.88Client 23 15.00 90.00 80.00 20.00 6.00 5.00 216.00Client 24 4.68 74.47 39.39 0.00 0.00 2.32 120.85Client 25 7.63 87.21 35.22 15.26 10.58 2.99 158.88Client 26 5.04 77.11 31.00 69.29 6.36 0.00 188.80Client 27 5.95 92.35 14.50 9.80 6.39 1.50 130.49Client 28 5.96 57.47 39.24 8.52 8.90 2.25 122.33Client 29 3.19 43.61 31.24 1.91 0.00 2.93 82.88Client 30 5.17 43.00 22.33 5.10 2.17 2.83 80.60Client 31 5.29 118.89 40.30 8.06 2.01 2.01 176.57Client 32 6.74 99.46 34.97 15.46 5.49 0.88 162.99Client 33 2.49 68.72 20.73 1.11 4.58 2.44 100.06Client 34 2.11 40.88 26.17 5.44 0.78 1.44 76.81Client 35 12.05 112.55 34.27 23.71 14.38 1.61 198.56Client 36 10.10 147.29 55.11 6.89 3.50 1.10 224.00PROJECT MANAGEMENT NORTH AMERICA FIT-OUT COST GUIDE 37
0OVERALLAVERAGES(USD) 7.92Design & CA (Soft Costs) 90.32Const (Hard Costs) 39.96FF & EIT 14.18 4.83FeesClient 36Client 35Client 34Client 33Client 32Client 31Client 30Client 29Client 28Client 27Client 26Client 25Client 24Client 23Client 22Client 21Client 20Client 19Client 18Client 17Client 16Client 15Client 14Client 13Client 12Client 11Client 10Client 09Client 08Client 07Client 06Client 05Client 04Client 03Client 02Client 01COST PER SF (USD)AVERAGE OFFICE COST/SF BY GWS ACCOUNT 300 250 200 150 100 50Move Costs 2.77 2016 CBRE CONFIDENTIAL & PROPRIETARY
0 133.57 224.00 219.96 276.67 250.00 300Client 14Client 11Client 36 250Client 19 216.00 199.49Client 23 198.56Client 16 194.77Client 35Client 06 188.80 185.40Client 26Client 09 176.57Client 31 185.00 175.88Client 22 185.00 175.40Client 01Client 20 174.34Client 02Client 13 172.12Client 07 162.99 158.88Client 25Client 32 158.61Client 04 151.84AVERAGE COSTPER SF:Client 03 147.32 132.19Client 21 155.39Client 08 130.49Client 10 122.33Client 27Client 28 116.36 120.85 114.65Client 05 150Client 24 112.45Client 12 107.06Client 15Client 17 106.40Client 18 100.06 82.88Client 33Client 29 50 80.60 200Client 30 76.81 100Client 34COST PER SF (USD)AVERAGE OFFICE PROJECT COST/SF BY GWS ACCOUNTLow to HighPROJECT MANAGEMENT NORTH AMERICA FIT-OUT COST GUIDE 39
0BANKING ANDFINANCE AVERAGE: 159.10HEALTHCAREAVERAGE: 158.24INSURANCEAVERAGE: 149.41SCIENCE &TECHNOLOGYAVERAGE: 180.56 133.57 80.60 76.81Client 30Client 34 82.88Client 29Client 26Client 23 224.00 216.00 188.80 185.00Client 21 185.40Client 20Client 07Client 09 175.40 172.12Client 01 199.49 175.88 106.40 112.45 107.06 147.32 174.34 185.00 198.56Client 22Client 18Client 17Client 16Client 15 100.06 130.49 158.88 158.61 162.99 176.57 219.96 276.67 250.00 300Client 14Client 33Client 08Client 02Client 27Client 25Client 13Client 04Client 36Client 35Client 32Client 31 122.33 114.65Client 28 50 120.85 100Client 24Client 19Client 12 194.77 250Client 11 151.84 132.19 150Client 10 116.36 200Client 06Client 05Client 03COST PER SF (USD)AVERAGE OFFICE PROJECT COST/SF BY INDUSTRYGWS Accounts OnlyOTHERAVERAGE: 139.32 2016 CBRE CONFIDENTIAL & PROPRIETARY
55,014 52,394 60KClient 14Client 26 43,200 41,66350KClient 23Client 09 38,620 37,775Client 36 37,000Client 08 35,019 33,147Client 13Client 07 32,00940KClient 19Client 35 30,085 29,397Client 01 28,855Client 12 26,056Client 06 24,762 24,328Client 20 24,117Client 16AVERAGE COSTPER SEAT: 24,781Client 02 23,518 21,856Client 03 20,819Client 32Client 24 20,661 19,826Client 22 19,531Client 04Client 17 19,510Client 11 18,417 17,753Client 31Client 29Client 21 17,075 16,162Client 10Client 33 15,934Client 28 14,999 14,180Client 27 14,04620KClient 15 12,86630KClient 34 12,667Client 05 10,282Client 18 10,184 0Client 3010KClient 25COST PER SEAT (USD)AVERAGE OFFICE COST PER SEAT BY GWS ACCOUNTLow to HighPROJECT MANAGEMENT NORTH AMERICA FIT-OUT COST GUIDE 41
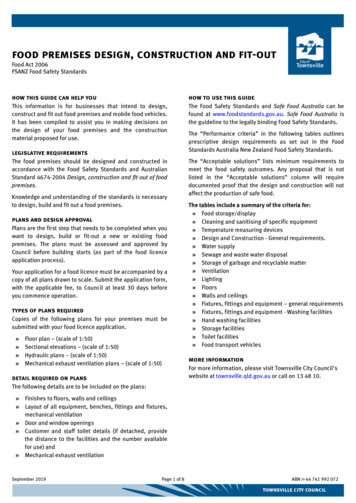
SPACE PLAN USAGEOver the past few years, the trend has been to reduce the number of assigned or designated seatingand move toward flexible workspaces. Generally, clients supported by the LMA business tend to designspaces with more flex or hotel seating as compared to the GWS clients.Overall Space Usage Plan18.7%HotelWorkstation/ Bench SeatOffice14.2%67.0%GWS Accounts Space Usage PlanWorkstationHotel / Bench SeatLMA Space Usage Plan13.3%24.2%14.0%72.6%HotelWorkstation/ Bench SeatHotelWorksta/OfficeOfficeWorkstationHotel / Bench Seat14.4%61.4% 2016 CBRE CONFIDENTIAL & PROPRIETARYWorkstaHotel /
0BANKING AND FINANCEWorkstationHEALTHCAREOfficeINSURANCESCIENCE &TECHNOLOGYClient 34Client 30Client 29Client 26Client 23Client 21Client 20Client 09Client 07Client 01Client 22Client 18Client 17Client 16Client 15Client 14Client 33Client 08Client 02Client 27Client 25Client 13Client 04Client 36Client 35Client 32Client 31Client 28Client 24Client 19Client 12Client 11Client 10Client 06Client 05Client 03SEATSSPACE PLAN USAGE BY GWS ACCOUNTSummarized by Industry35030025020015010050OTHERBe
when looking at cost per square foot. A 10,000 RSF project, on average, will gen-erally be higher than a 50,000 RSF project because the cost is amortized over a larger square footage. 7. RSF VERSUS USF. Loss factor on RSF varies from building to building and from state to state. For the purpose of this cost guide, all data is reported in RSF. No