Transcription
Global Protocol forCommunity-Scale GreenhouseGas Emission InventoriesAn Accounting and Reporting Standard for Cities
Lead AuthorsWee Kean FongMary SotosMichael DoustSeth SchultzAna MarquesChang Deng-BeckWorld Resources InstituteWorld Resources InstituteC40 Cities Climate Leadership GroupC40 Cities Climate Leadership GroupICLEI - Local Governments for SustainabilityICLEI - Local Governments for SustainabilityContributing Author sAlex KovacPankaj BhatiaBrooke RussellEmily MorrisMaryke van StadenYunus ArikanAmanda EichelJonathan DickinsonRishi DesaiDan HoornwegWorld Resources InstituteWorld Resources InstituteC40 Cities Climate Leadership GroupC40 Cities Climate Leadership GroupICLEI - Local Governments for SustainabilityICLEI - Local Governments for SustainabilityBloomberg PhilanthropiesColumbia UniversityOliver WymanUniversity of Ontario Institute of TechnologyAdvisory Commit teePankaj Bhatia, ChairSeth SchultzYunus ArikanStephen HammerRobert KehewSoraya SmaounMaria Varbeva-DaleyKyra Appleby and Larissa BullaAlvin MeijiaAdam SzolyakMichael SteinhoffJunichi FujinoKiyoto TanabeYoshiaki IchikawaJan Corfee-MorlotChristophe NuttallSergey KononovMatthew LynchCarina Borgström-HanssonJean-Pierre TabetFarhan HelmyRagnhild HammerInes LockhartLeah DavisYuuko NishidaVictor Hugo ParamoAmanda EichelShirley RodriguesStefan DenigWorld Resources InstituteC40 Cities Climate Leadership GroupICLEI - Local Governments for SustainabilityThe World BankUnited Nations Human Settlements Programme (UN-HABITAT)United Nations Environment Programme (UNEP)British Standards Institution (BSI)CDPClean Air AsiaEU Covenant of MayorsICLEI – Local Governments for Sustainability USAInstitute for Global Environmental Strategies and NationalInstitute for Environmental Studies (IGES/NIES)Intergovernmental Panel on Climate Change (IPCC)International Organization for Standardization (ISO)Organisation for Economic Co-operation and Development (OECD)R20 Regions of Climate ActionUnited Nations Framework Convention on Climate Change (UNFCCC)World Business Council for Sustainable Development (WBCSD)World Wide Fund for Nature (WWF)French Agency for Environment and Energy Management (ADEME)Indonesia Climate Change Center (ICCC)City of Arendal, NorwayCity of Buenos Aires, ArgentinaCity of London, UKCity of Tokyo, JapanMexico City, MexicoBloomberg PhilanthropiesChildren’s Investment Fund Foundation (CIFF)Siemens
Table of ContentsForeword7Executive Summary8Pa r t I : I n t r o d u c t i o n a n d R e p o r t i n g R e q u i r e m e n t s1 Introduction2 Accounting and Reporting Principles3 Setting the Inventory Boundary4 Reporting RequirementsPa r t II : C a lc u l at i o n G u i da n c e by E m i s s i o n S o u rc e5 Overview of Calculating GHG Emissions6 Stationary Energy7 Transportation8 Waste9 Industrial Processes and Product Use10 Agriculture, Forestry and Other Land UsePa r t III : T r ac k i n g C h a n g e s a n d S e t t i n g G oa l s11 Setting Goals and Tracking Emissions Over Time12 Managing Inventory Quality and VerificationApp e n d i c e sA Survey of GHG standards and programsB Inventories for local government operationsC Methodology 71
Detailed Table of ContentsForeword7E x e c u t i v e S u m m a ry8Pa r t I : Introduc tion andReporting Requirements1 I n t r o d u c t i o n1.1 Cities and climate change1.2 Purpose of the GPC1.3 Who should use the GPC1.4 Using the GPC1.5 Relationship to other city protocolsand standards1.6 How this standard was developed1.7 Local government operations2 Acc o u n t i n g a n dR e p o r t i n g P r i n c i pl e s2.1 Accounting and reporting principles2.2 Notation keys1718192020205 O v e r v i e w o f C a lc u l at i n gGHG E m i s s i o n s5.1 Calculation methodology5.2 Activity data5.3 Sourcing activity data5.4 Emission factors5.5 Conversion of data to standard unitsand CO2 equivalent5.6 Managing data quality and uncertainty5.7 Verification4546474848505052532122232425263 Se t ting the In v entory Bou n dary 283.1 Geographic boundary293.2 Time period293.3 Greenhouse gases303.4 GHG emission sources303.5 Categorizing emissions by scope313.6 Other scope 3 emissions333.7 Boundaries for mitigation goals334 R e p o r t i n g R e q u i r e m e n t s4.1 The scopes and city-induced frameworks4.2 Reporting requirements4.3 Reporting recommendations4.4 GPC reporting frameworkPa r t II : C a lc u l at i o n G u i da n c eby E m i s s i o n S o u rc e34353840406 S tat i o n a ry E n e rg y6.1 Categorizing stationary energy sectoremissions by scope6.2 Defining energy source sub-sectors6.3 Calculating stationary fuelcombustion emissions6.4 Calculating fugitive emissions from fuels6.5 Calculating emissions from grid-suppliedenergy consumption547 T r a n s p o r tat i o n7.1 Categorizing transportation emissionsby scope7.2 Defining transport modes7.3 Calculating on-roadtransportation emissions7.4 Calculating railwaytransportation emissions7.5 Calculating waterbornenavigation emissions7.6 Calculating aviation emissions7.7 Calculating off-roadtransportation emissions702 Global Protocol for Community-Scale Greenhouse Gas Emission Inventories565657656671727379808182
Detailed Table of Contents 8 Wa s t e8.1 Categorizing wasteand wastewater emissions8.2 Defining Solid Waste typesand general calculation procedures8.3 Calculating emissionsfrom solid waste disposal8.4 Calculating emissionsfrom biological treatment of solid waste8.5 Calculating emissionsfrom waste incineration and open burning8.6 Calculating emissionsfrom wastewater treatment9 I n d u s t r i a l P r o c e s s e sand Produc t Use9.1 Categorizing IPPU emissions by scope9.2 Defining industrial processesand product uses9.3 Calculation guidancefor industrial processes9.4 Calculating product use emissions10 Ag r i c u lt u r e , F o r e s t ryand Other Land Use10.1 Categorizing AFOLU emissions by scope10.2 Defining AFOLU activities10.3 Calculating livestock emissions10.4 Calculating land use and land-usechange emissions10.5 Calculating emissions from aggregatesources and non-CO2 emissions sourceson land8485879094Pa r t III : T r ac k i n g C h a n g e sa n d S e t t i n g G oa l s11 S e t t i n g G oa l s a n d T r ac k i n gEmissions Over Time11.1 Setting goals and evaluating performance11.2 Aligning goals with the inventory boundary11.3 Tracking emissions over timeand recalculating 1711812 M a n ag i n g I n v e n t o ry Q ua l i t ya n d V e r i f i c at i o n12.1 Managing inventory quality over time12.2 Verification12.3 Parameters of verification12.4 Verification process144145146148149App e n d i c e sAOverview of GHG standards and programsBInventories for local government operationsCMethodology 65Recognitions167151157160122124The term “city” is used throughout this document to referto geographically discernable subnational entities, suchas communities, townships, cities, and neighborhoods.In this document, “city” is also used to indicate alllevels of subnational jurisdiction as well as localgovernment as legal entities of public administration.3
List of Tables and FiguresTa b l e sTable 1.1What parts of the GPC should I read?21Table 1.2GPC authors22Table 1.3GPC development process22Table 8.3Table 2.1Use of notation keys27Table 8.4 Default data for CO2 emission factors forTable 8.231Table 3.2Scopes definitions for city inventories31Table 4.1Inventory city information40Table 4.2GHG Emissions Summary41Table 4.3GHG Emissions Report42Table 4.4(a) Scope 2 emissions basedon market-based method44Table 4.4(b) Offset credit transactions44Table 4.4(c) Renewable energy productionOrder Decay method92Biological treatment emission factors95incineration and open burningTable 3.1 Sectors and sub-sectors of cityGHG emissions Comparing Methane Commitment to FirstTable 8.597CH4 emission factors for incinerationof MSW98Table 8.6 Default N2O emission factors for differenttypes of waste and management practices 99Table 9.1IPPU OverviewTable 9.2Example industrial processes106and product uses106Table 9.3Calculating mineral industry emissions107Table 9.4Calculating chemical industry emissions110Metal industry111or investments44Table 9.5Table 5.1Data collection principles48Table 9.6 Non-energy product uses of fuelsTable 5.2GWP of major GHG gases51and other chemical products112Table 5.3Data quality assessment53Table 9.7Non-energy product emissions113Table 6.1Stationary Energy Overview57Table 9.8Calculating emissionsTable 6.2Definitions of stationary energysource sub-sectorsfrom the electronics industry58workers quartersTable 9.960and corresponding IPCC references61corresponding IPCC references62sources on land63124125Table 11.1 Examples of city goal typesTable 6.7 An overview of reporting categorization forwaste-to-energy and bioenergy emissionsTable 10.4 Land use categories122Table 10.5 Aggregate sources and non-CO2 emissionsTable 6.6 Detailed sub-categories of energyindustries sub-sector119Table 10.3 Land use categories andTable 6.5 Overview of reporting guidance foroff-road transportation activities118Table 10.2 Livestock emission sourcesTable 6.4 Detailed sub-categories of manufacturingindustries and construction sub-sectorSubstitutes for ozone depleting substances 115Table 10.1 AFOLU OverviewTable 6.3 Definitions of temporary and permanent114and inventory need64Table 6.8 Reporting guidance for energy sources in140Table 11.2 Example of recalculation triggers143agriculture, forestry, and fishing activities 65Table 12.1 Example QA/QC procedures147Table 7.1Transportation Overview73Table A.1151Table 7.2Boundary types and scopes allocation78Table A.2 Review of existing standards on GHGScope definitions for corporate and cityaccounting and reportingTable 7.3 Comparing top-down and bottom-up154methodologies for on-road transportation 78Table A.3Comparison of emissions sources categories 156Table 7.4Railway types79Table C.1Methodology referenceTable 8.1Waste Overview874 Global Protocol for Community-Scale Greenhouse Gas Emission Inventories160
FiguresB ox esFigure 3.1 Sources and boundariesof city GHG emissionsBox 2.1Kampala data challenges2632Box 2.2Use of notation keys—Johannesburg27Figure 4.1Sources and scopes covered by the GPC37Box 3.1Scope 3 sources—King County33Figure 7.1ASIF framework74Box 4.2Reporting biogenic CO2 emissions39Figure 7.2Induced activity allocation76Box 6.1 The market-based method forFigure 7.3Methodology system boundaries77scope 2 accountingBox 6.2 Identifying electricity consumption data—Figure 8.1 Boundaries for importedand exported waste67Ekurhuleni Metropolitan Municipality86Figure 10.1 Overview of AFOLU emission sources119Figure 11.1 Example of a base year emissions goal138Figure 11.2 Example of a fixed-level goal138Figure 11.3 Example of a base year intensity goal13968Box 6.3 Local electricity grid emission factors—Waterloo RegionBox 7.169On-road calculation based on models—North Park75Figure 11.4 Example of a baseline scenario goal139Box 7.2 Reporting emissions from regionalFigure B.1158transport hubs—London83Waste and stationary energy emissions88Major steps for LGO inventoriesBox 8.1Box 8.3 Estimating emissions from wastewater directlydischarged into an open body of water100Box 9.1 Calculating emissions from product useusing a consumption-based approach115Box 11.1 Setting goals and tracking progress—New York City138Box 11.2 Adjustments to identify energy consumptionemissions net of energy production1425
E quatio n sEquation 5.1 Emission factor approach for calculatingEquation 10.6 CO2 emissions from land useGHG emissions48Equation 5.2Scaling methodology49Equation 10.7 GHG emissions from biomass burning 125Equation 8.1Degradable organic carbon (DOC)90Equation 10.8 CO2 emissions from limingestimate for solid waste sent to landfill 93Equation 8.3 Methane commitment estimatefor solid waste sent to landfill93Methane generation potential, L094Equation 10.10 Direct N2O from managed soils126127Equation 10.12 Direct N2O-N from managedinorganic soilsEquation 8.896Equation 10.15 N from animal manure applied to soils 128to soilsby grazing animals on pasture,range and paddock99and forage/pasture renewal101as a result of loss of soil C throughchange in land use or management102Equation 8.11 Indirect N2O emissions fromwastewater effluentof N volatilized from managed soilsEquation 9.1Calcination example107Equation 10.20 N2O from leaching/runoff fromEmissions from cement production108managed soils in regions whereEquation 9.3Emissions from lime production108leaching/runoff occursEquation 9.4Emissions from glass production108Equation 10.21 Indirect N2O emissionsEquation 9.5 CO2 emissions from non-energyEquation 10.2Equation 10.4 Annual N excretion ratesfrom manure management120131132Equation 10.23 CH4 emissions from rice cultivation133Equation 10.24 Adjusted daily emission factors133Equation 10.25 Adjusted CH4 emission scaling factors121121Equation 10.5 Carbon emissions from land useand land-use change131Equation 10.22 N losses due to volatilizationEquation 10.3 N2O emissions frommanure managementfrom manure management119CH4 emissions frommanure management130due to volatilization of N112Equation 10.1 CH4 emissions fromenteric fermentation130Equation 10.19 N2O from atmospheric deposition103Equation 9.2product uses129Equation 10.18 N mineralized in mineral soilsEquation 8.10 Organic content and emission factorsin domestic wastewater129Equation 10.17 N from crop residuesEquation 8.9 CH4 generation from wastewatertreatment128Equation 10.16 N in urine and dung deposited97N2O emissions from the incinerationof waste127Equation 10.14 N from organic N additions appliedEquation 8.7 CH4 emissions from the incinerationof waste12795Equation 8.6 Non-biogenic CO2 emissions fromthe incineration of waste125Equation 10.11 Direct N2O-N from managed soilsEquation 10.13 Direct N2O-N from urine and dungEquation 8.5 Direct emissions from biologicallytreated solid waste123Equation 10.9 CO2 emissions from urea fertilization 126Equation 8.2 First order of decay (FOD) modelEquation 8.4and land-use change1226 Global Protocol for Community-Scale Greenhouse Gas Emission Inventoriesfor organic amendments134
ForewordCities are integral to tackling the global challenge ofclimate change, as both a major source of greenhousegas emissions, and a major source of innovative climatesolutions. An estimated 70 percent of the world’s energyrelated greenhouse gas emissions come from cities,a number that is likely to continue to increase as twothirds of all people are expected to live in urban areasby mid-century. At the same time, cities are designingand implementing groundbreaking solutions to mitigateclimate change — promoting sustainable development andincreasing climate resilience while reducing emissions. Inorder to have maximum global impact, however, city leadersneed a standard by which to measure their emissionsand identify the most effective ways to mitigate them.The Global Protocol for Community-Scale GreenhouseGas Emission Inventories (GPC) offers cities and localgovernments a robust, transparent and globally-acceptedframework to consistently identify, calculate and report oncity greenhouse gases. This includes emissions releasedwithin city boundaries as well as those occurring outsidethem as a result of activities taking place within the city.The GPC establishes credible emissions accounting andreporting practices that help cities develop an emissionsbaseline, set mitigation goals, create more targeted climateaction plans and track progress over time, as well asstrengthen opportunities for cities to partner with otherlevels of government and increase access to local andinternational climate financing.Andrew SteerPresident and CEO, WRIThe GPC has already been adopted as a central componentof the Compact of Mayors, the world’s largest cooperativeeffort among mayors and city officials to reduce greenhousegas emissions, track progress and prepare for the impacts ofclimate change. Launched in September 2014, the Compactaims to undertake a transparent and supportive approach toreduce greenhouse gas emissions and address climate risk,in a manner consistent with – and complementary to – theinternational climate negotiation process under the UnitedNations Framework Convention on Climate Change.Urban areas are a logical setting for implementing andmeasuring climate action. Local governments can bemore nimble where regional or national governments aremore restricted by bureaucracy. Mayors, local councils andcommunity leaders understand local needs and constraints,which often results in bolder, more effective action beingtaken. They can track the performance of city services, guidechange in the community and set regulations that governland use, building efficiency, and local transportation.Thousands of cities are already taking action to reduceemissions and improve climate resilience. With the GPC,these cities and their advocates have a global standard totrack greenhouse gas performance and lead the way to amore sustainable future.Eduardo PaesC40 Chair and Mayor of Rio de JaneiroDavid CadmanPresident, ICLEI7
Executive Summary8 Global Protocol for Community-Scale Greenhouse Gas Emission Inventories
Executive SummaryCities are the global centers of communication, commerce and culture.They are also a significant, and growing, source of energy consumptionand greenhouse gas (GHG) emissions. A city’s ability to take effectiveaction on mitigating climate change, and monitor progress, depends on havingaccess to good quality data on GHG emissions. Planning for climate action beginswith developing a GHG inventory. An inventory enables cities to understand theemissions contribution of different activities in the community.IntroductionInventory methods that cities have used to date varysignificantly. This inconsistency makes comparisons betweencities difficult, raises questions around data quality, andlimits the ability to aggregate local, subnational, and nationalgovernment GHG emissions data. To allow for morecredible and meaningful reporting, greater consistencyin GHG accounting is required. The Global Protocol forCommunity-Scale Greenhouse Gas Emission Inventories(GPC) responds to this challenge and offers a robust andclear framework that builds on existing methodologiesfor calculating and reporting city-wide GHG emissions.The GPC requires cities to measure and disclose acomprehensive inventory of GHG emissions and to totalthese emissions using two distinct but complementaryapproaches. One captures emissions from both productionand consumption activities taking place within the cityboundary, including some emissions released outsidethe city boundary. The other categorizes all emissionsinto “scopes,” depending on where they physically occur.Separate accounting of emissions physically releasedwithin the city boundary should be used for aggregation ofmultiple city inventories in order to avoid double counting.The GPC is divided into three main parts: Part I introduces the GPC reporting and accountingprinciples, sets out how to define the inventory boundary,specifies reporting requirements and offers a samplereporting template9
Part II provides overarching and sector-specific accountingand reporting guidance for sourcing data and calculatingemissions, including calculation methods and equationsTable 1 Sectors and sub-sectors of city GHG emissionsSectors and sub-sectors Part III shows how inventories can be used to setmitigation goals and track performance over time, andshows how cities can manage inventory qualityNote, the term “city” is used throughout this documentto refer to any geographically discernable subnationalentity, such as a community, town, city, or province, andcovers all levels of subnational jurisdiction as well as localgovernment as legal entities of public administration.STATIONARY ENERGYResidential buildingsCommercial and institutional buildings and facilitiesManufacturing industries and constructionEnergy industriesAgriculture, forestry, and fishing activitiesNon-specified sourcesDefining an inventory boundaryand emission sourcesTo use the GPC, cities must first define an inventory boundary.This identifies the geographic area, time span, gases, andemission sources, covered by a GHG inventory. Any geographicboundary may be used for the GHG inventory. Dependingon the purpose of the inventory, the boundary can align withthe administrative boundary of a local government, a ward orborough within a city, a combination of administrative divisions,a metropolitan area, or another geographically identifiableentity. The GPC is designed to account for GHG emissions ina single reporting year and covers the seven gases covered bythe Kyoto Protocol (Section 3.3 in the report).GHG emissions from city activities shall be classified intosix main sectors: Stationary energy Transportation Waste Industrial processes and product use (IPPU)Fugitive emissions from mining, processing, storage, andtransportation of coalFugitive emissions from oil and natural gas systemsTRANS P ORTATIONOn-roadRailwaysWaterborne navigationAviationOff-roadWASTESolid waste disposalBiological treatment of wasteIncineration and open burningWastewater treatment and dischargeINDUSTRIA L P RO C ESSES AND P RODU C T USE ( I P P U )Industrial processesProduct useAGRICULTURE, FORESTRY AND OTHER LAND USE (AFOLU) Agriculture, forestry, and other land use (AFOLU)Livestock Any other emissions occurring outside the geographicLandboundary as a result of city activities. These emissionsare not covered in this version of the GPC but may bereported separatelyAggregate sources and non-CO2 emission sources on landOTHER S C O P E 3Table 1 breaks these six sectors down by sub-sector.10 Global Protocol for Community-Scale Greenhouse Gas Emission Inventories
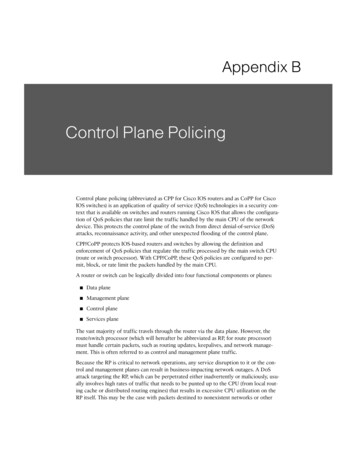
Executive SummaryCategorizing emissionsTable 2 Scopes definitions for city inventoriesActivities taking place within a city can generate GHGemissions that occur inside the city boundary as well asoutside the city boundary. To distinguish among them,the GPC groups emissions into three categories based onwhere they occur: scope 1, scope 2 or scope 3 emissions.Definitions are provided in Table 2, based on an adaptedapplication of the scopes framework used in the GHGProtocol Corporate Standard.The scopes framework helps to differentiate emissionsoccurring physically within the city (scope 1), from thoseoccurring outside the city (scope 3) and from the useof electricity, steam, and/or heating/cooling supplied bygrids which may or may not cross city boundaries (scope2). Scope 1 emissions may also be termed “territorial”emissions because they occur discretely within the territorydefined by the geographic boundary. Figure 1 illustratesScopeDefinitionScope 1GHG emissions from sources located withinthe city boundaryScope 2GHG emissions occurring as a consequenceof the use of grid-supplied electricity, heat,steam and/or cooling within the city boundaryScope 3All other GHG emissions that occur outsidethe city boundary as a result of activities takingplace within the city boundarywhich emission sources occur solely within the geographicboundary established for the inventory, which occur outsidethe geographic boundary, and which may occur across thegeographic boundary.Figure 1 Sources and boundaries of city GHG emissionsScope 3Scope 1in-boundarywaste &wastewateragriculture,forestry & otherland useout-of-boundarywaste &wastewaterScope 2other indirectemissionsstationary fuelcombustionindustrialprocesses &product entory boundary (including scopes 1, 2 and 3)Geographic city boundary (including scope 1)transmission plied energy from a regional grid (scope 2)11
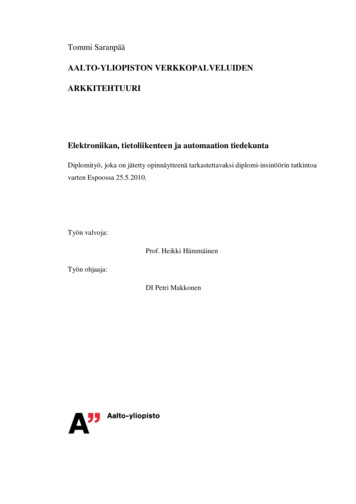
Aggregating city inventoriesThe GPC has been designed to allow city inventories to beaggregated at subnational and national levels in order to: Improve the data quality of a national inventory,particularly where major cities’ inventories are reported; Measure the contribution of city mitigation actions toregional or national GHG emission reduction targets; And identify innovative transboundary and crosssectorial strategies for GHG mitigation.Aggregation of multiple city inventories can be accomplishedby combining the scope 1 (territorial) emissions of citieswhose inventory boundaries do not overlap geographically.Reporting requirementsThe GPC requires cities to report their emissions by gas,scope, sector and subsector, and to add up emissionsusing two distinct but complementary approaches: Scopes framework: This totals all emissions by scope1, 2 and 3. Scope 1 (or territorial emissions) allowsfor the separate accounting of all GHG emissionsproduced within the geographic boundary of thecity, consistent with national-level GHG reporting. City-induced framework: This totals GHG emissionsattributable to activities taking place within thegeographic boundary of the city. It covers selectedscope 1, 2 and 3 emission sources representing the keyemitting sources occurring in almost all cities, and forwhich standardized methods are generally available.Chapter 4 of the GPC sets out reporting requirementsand explains how to add up emission totals. Citiesmay also report emissions based on relevant localor program-specific requirements in addition to therequirements of the GPC. GHG inventories should beupdated on a regular basis using the most recent dataavailable. The GPC recommends that cities update theirinventory on an annual basis, as it provides frequentand timely progress on overall GHG emissions.Table 3 summarizes the emissions sources and scopescovered by the GPC for both city-level and territorialreporting. Cities should aim to cover all emissions forwhich reliable data are available. To accommodatelimitations in data availability and differences in emissionsources between cities, the GPC requires the use ofnotation keys, as recommended in IPCC Guidelines,and an accompanying explanation to justify exclusion orpartial accounting of GHG emission source categories.The city-induced framework gives cities the option ofselecting between two reporting levels: BASIC or BASIC .The BASIC level covers scope 1 and scope 2 emissionsfrom stationary energy and transportation, as well asscope 1 and scope 3 emissions from waste. BASIC involves more challenging data collection and calculationprocesses, and additionally includes emissions from IPPUand AFOLU and transboundary transportation. Therefore,where these sources are significant and relevant for acity, the city should aim to report according to BASIC .The sources covered in BASIC also align with sourcesrequired for national reporting in IPCC guidelines.Tick marks in Table 3 indicate which emissions sourcesare covered by the GPC, and cells are colored to indicatetheir inclusion in city-level BASIC or BASIC totals and theterritorial total. Rows written in italics representsub-sector emissions required for territorial emissiontotals but not BASIC/BASIC . Gray cells in the scope2 column indicate emission sources that do not haveapplicable GHG emissions in that scope category. Emissionsources corresponding to the blank boxes in the scope3 column are not required for reporting, but may beidentified and disclosed separately under Other Scope 3.The GPC provides a sample reporting template that coversall reporting requirements. Cities may report GHG emissionsin a variety of additional formats depending on purpose andaudience, and may also disaggregate emissions by fuel type,municipal operations within each sector or sub-sector, etc.12 Global Protocol for Community-Scale Greenhouse Gas Emission Inventories
Executive SummaryFigure 2 Sources and scopes covered by the GPCSectors and sub-sectorsScope 1Scope 2Scope 3Residential buildingsüüüCommercial and institutional buildings and facilitiesüüüManufacturing industries and constructionüüüEnergy industriesüüüEnergy generation supplied to the gridüAgriculture, forestry, and fishing activitiesüüüNon-specified sourcesüüüFugitive emissions from mining, processing, storage, and transportation of coalüFugitive emissions from oil and natural gas systemsüS tat i o n a r y E n e r g yTRANS P ORTATIONOn-roadüüüRailwaysüüüWaterborne posal of solid waste generated in the cityüDisposal of solid waste generated outside the cityüBiological treatment of waste generated in the cityüBiological treatment of waste generated outside the cityüIncineration and open burning of waste generated in the cityüIncineration and open burning of waste generated outside the cityüWastewater generated in the cityüWastewater generated outside the cityüüüüüINDUSTRIA L P RO C ESSES AND P RODU C T USE ( I P P U )Industrial processesüProduct useüAGRI C U LTURE , FORESTRY AND O t h e r L AND USE ( AFO L U )LivestocküLandüAggregate sources and non-CO2 emission sources on landüOTHER S C O P E 3Other Scope 3 ü Sources covered by the GPC Sources required for BASIC reportingSources included in Other Scope 3S ources required for BASIC reporting Sources required for territorial total but not for BASIC/BASIC reporting (italics)N on-applicable emissions13
Calculating GHG emissionsPart II of the GPC provides overarching and sector-specificreporting guidance for sourcing data and calculatingemissions. Cities should select the most appropriatemethodologies based on the purpose of their inventory,availability of data, and consistency with their country’snational inventory and/or other measurement andreporting programs in which they participate. The GPCdoes not require specific methodologies to be used toproduce emissions data; rather it s
of MSW 98 Table 8.6 Default N 2 O emission factors for different types of waste and management practices 99 Table 9.1 IPPU Overview 106 Table 9.2 Example industrial processes and product uses 106 Table 9.3 Calculating mineral industry emissions 107 Table 9.4 Calculating chemical industry emissions 110 Table 9.5 Metal industry 111