Transcription
PA R T4Matching Supply and DemandThe management of capacity in service firms frequently presents a more difficult andmore expensive problem than in manufacturing. To determine capacity in manymanufacturing firms, one usually considers long run average demand. Inventory isfrequently used to compensate for annual seasonality or short term fluctuations indemand. In services, however, although the long run average must be considered,the short term is vital as well. Because of the perishable nature of service sector“inventory” such as airplane seats or hotel rooms, capacity plans must considerdemand by day of the week and even time of day—a level of detail that manufactur ers usually find irrelevant.Further, capacity planning mistakes are often more costly in services. Whencaught short on capacity many manufacturers simply “back order” a customer’srequest. In many services, though, back orders simply cannot exist—quite literally,“the ship has sailed” for a cruise operator. Not having what the customer wantswhen she arrives can mean either a one time lost sale to the competition, or possi bly the defection of the entire stream of future sales of that customer and whoeverelse she chooses to tell about her experience.Many strategic and tactical decisions must be made concerning services capac ity. A “one size fits all” strategy will not work. Even though it may be in the strate gic interest of one airline to tightly match capacity to demand by heavily overbookingflights, another airline might be most profitable flying at far below capacity on aver age. Many of the qualitative aspects of these topics were covered in Chapter 2. Thispart of the book looks at putting those general strategies into action.
CHAPTER12Yield ManagementLEARNING OBJECTIVESIUnderstand the need foroverbooking.IUse three different methodsto calculate an overbookinglevel.The material in this chapter prepares students to:IDetermine how to allocateservice capacity amongcustomer groups.IUnderstand the intricaciesof pricing for a capacityconstrained service.C APACITY S TRATEGIESCapacity planning for many service firms can be far more difficult than for manufac turers. Manufacturers can set capacity by looking at long run average demand. Formany service firms, however, long run averages become somewhat meaninglesswhen capacity must react to general seasonality, daily demand variations, and time of day demand fluctuations. If the average manufacturer found out that most endconsumers bought its product between 2 P.M. and 3 P.M., this knowledge wouldn’tchange its capacity strategy at all, but it would be important information for manyservice firms.Capacity decisions in service firms are not only more complex than in manufac turers, but can be more important as well. Manufacturers deal with short termimbalances in production and demand by either carrying inventory or creating abackorder list for later shipment. In most services, the “inventory” of capacity isemployee time, or a fixed asset not being used, such as a hotel room or an airplaneseat, so excess inventory cannot be stored for later use. Backorders quite often can not occur: Imagine a sales clerk at a department store stating that he will be able tospeak with a customer by next Tuesday. Consequently, a temporary imbalance insupply and demand can result in either idle employees and resources if demand issmaller than supply, or lost sales to the competition if demand is larger than supply.(Service firms that can use physical inventory are discussed in Chapter 13.)These factors turn simple tactical decisions into strategic ones. Consider thissimple example of the basic strategic direction for service capacity. An ice cream par lor experiences the following demand for ice cream cones:234
CHAPTER 12Yield ManagementWeekdaysSaturdaySunday235100 – 300500 – 1,500500 – 1,100For the manufacturer supplying the cones, capacity is a simple matter: It calcu lates average weekly demand:5(200) 1,000 800 2,800 conesIt makes 2,800/7 400 cones every day, and carries a small inventory of extracones for the busier days. For the service provider who fills cones as customers walkin, however, simple arithmetic no longer applies. A strategic decision must be made.The ice cream parlor manager may use one of the four basic strategies outlined next.1When considering these strategies, assume that one employee can make 100 conesper day.1. Provide: Ensure sufficient capacity at all times. To carry out a provide strat egy, one would want to always have enough people to handle the maximumdemand, so the firm would have 15 employees working on Saturday, 11 onSunday, and 3 the rest of the week. It is usually difficult to employ significantnumbers of part timers, so this strategy would employ enough full timeemployees to meet those numbers. This strategy is associated with a high service quality generic strategy, but it is also high cost, and would result in sig nificant idle time for employees. Businesses with these characteristics includehigh margin sales (e.g., jewelry, luxury automobiles) and those with wealthyindividuals as clients (e.g., chauffeuring, private banking). Also, firms thatcompete on delivery speed (often called “time based” competitors) shouldadopt this approach.2. Match: Change capacity as needed. This strategy would use ten employeeson Saturday, eight on Sunday, and two the rest of the week, with the excessSaturday and Sunday employees strictly part timers. This approach balancesservice quality and costs and is representative of a large number of firms,including most mid and low priced restaurants and telemarketing firms.3. Influence: Alter demand patterns to fit firm capacity. Here, pricing, market ing, or appointment systems flatten demand peaks to conform to capacity. Itis most common in high capital intensive services such as airlines and hotels,but highly paid professionals such as medical doctors and lawyers also com monly use it.4. Control: Maximize capacity utilization. If only full time employees could beused, five days per week, this strategy would have just two employees whoseschedules overlapped on weekends. The generic strategy behind this option isto compete on cost by driving employee idle time to zero. It is often used in thepublic sector (e.g., driver’s license bureaus) and low margin services, as wellas situations where high priced employees want to maximize their utilization.Many physicians deliberately schedule patient appointments so tightly that acrowd is always in their waiting room. This strategy is willing to sacrifice salesat busy times to ensure the service functions efficiently all the time.To assist in crafting these strategies, a host of specific tactics can be used to man age supply and demand (an in depth discussion of these issues can be found inKlassen and Rohleder, 2001). Supply management tactics include the following:1. Crandall and Markland (1996).
236PA R T 4 Matching Supply and DemandWorkshift scheduling. The unevenness of customer demand throughout aday means utilizing creative work schedules, such as nonuniform startingtimes, and workdays that have variable work hours. Work scheduling softwareis available to help construct flexible solutions within a match strategy.Increasing customer participation. A traditional method for a control strat egy cuts total labor by encouraging customers to participate in serving them selves. For example, many fast food restaurants use a semi control strategyin which customers pour their own fountain drinks and procure their owncondiments.Adjustable (surge) capacity. “Surge” capacity means capacity that can beavailable for a short period of time. By cross training personnel for differentjobs, a company can flexibly shift personnel temporarily to increase thecapacity of any one position. Because cross training is expensive to under take, and cross trained personnel are more expensive to retain, it is an appro priate approach within a provide strategy.Sharing capacity. Capacity can often be shared between departments orbetween firms for personnel or equipment that is needed only occasionally. Forexample, small business incubators often contract with dozens of businesses toshare the same secretarial, accounting, and office management team.Several tactics can be used to manage demand as well. Partitioning demand. It is not unusual for some components of demand to beinherently random, while some are fixed. This approach melds the more mal leable demand around the tendencies of the random demand. That is, if it isknown that more walk in business generally comes in from 11 A.M. to 1 P.M.,then schedule appointments either before or after that time. This approachworks primarily for provide and match strategies.Price incentives and promotion of off peak demand. This highly commonmethod works in an influence strategy, which many of us see in our telephonebills. It is also commonly used in restaurants (“early bird” specials), hotels(both off season and day of week pricing), resorts, and so on.Develop complementary services. The way to avoid the inevitable season ality of many services is to couple countercyclical services together: Heatingand air conditioning repair, ski slopes in winter and mountain bike trails inthe summer. Unfortunately, this approach remains only a theoretical con struct for most services.Yield management. Yield management combines three techniques: (1) over booking, (2) assigning capacity amounts to different market segments, and (3)differential pricing in different market segments. It is used extensively bymany industries and is the subject of the remainder of this chapter.Y IELD M ANAGEMENTConsumers encounter examples of what is called yield management constantly. A lit tle knowledge about how these systems work can make life easier, or at least lessexpensive. Some practical examples of dealing with a yield management systeminclude overbooking at a car rental agency. Even though you “confirmed” yourreservation, it still pays to show up early in the day to get a car; sometimes thosewho show up late are out of luck. If you are a little more flexible about which daysyou fly, an airplane ticket may cost several hundred dollars less. The airline flight
CHAPTER 12Yield Managementyou are trying to book a seat on may be full today, but be patient and keep trying;tomorrow a seat may be available, even without others’ cancellations. A hotel thatsays no room is available for you on Thursday night may suddenly find a room forThursday if you add that you are staying Friday.These situations occur because of yield management systems. The application ofyield management practices often leave customers and employees puzzled. Thischapter introduces the reasoning and techniques of yield management. Even if youdo not work in an industry where yield management is practiced, this material willat least help you be a better consumer.The term yield management itself is a bit of a misnomer because these techniquesare not directly concerned with managing “yield” but are really concerned with man aging revenue. Consequently, the set of techniques described in this chapter is some times called revenue management or perishable asset revenue management.The purpose of yield management techniques is to sell the right capacity to theright customer at the right price. Not every firm can use these techniques, but manycapital intensive services can and do use them heavily. The main business require ment for using the techniques of this chapter is having limited, fixed capacity. Manyother business characteristics make yield management more effective: Ability to segment marketsPerishable inventoryAdvance salesFluctuating demandAccurate, detailed information systemsThese characteristics increase the complexity of a business and the profit poten tial from applying yield management.Industries that currently fully utilize yield management techniques aretransportation oriented industries, such as airlines, railroads, car rental agencies,and shipping; vacation oriented industries, such as tour operators, cruise ships,and resorts; and other capacity constrained industries, such as hotels, medicine,storage facilities, and broadcasting (selling commercial time). Many other indus tries can partially use these techniques.Yield management is a relatively young science. Airlines are credited with theinvention of most of these techniques, especially Sabre, formerly with AmericanAirlines (see the Service Operations Management Practices: Yield ManagementIncreases Revenue 1 Billion/Year at American Airlines). However, the airlines did notdevelop most of these systems until a few years after the industry was deregulatedin 1978, and the techniques only began to spread to other industries in the 1990s.A yield management system consists of three basic elements:1. Overbooking (accepting more requests for service than can be provided)2. Differential pricing to different customer groups3. Capacity allocation among customer groupsEach of these elements will be discussed in turn, then some practical implemen tation issues will be addressed.OVERBOOKINGThe need for overbooking is clear. Customers are fickle and do not always show up,so firms that overbook make far more money than those that don’t. American Airlines237
238PA R T 4Matching Supply and DemandSERVICE OPERATIONS MANAGEMENT PRACTICESYield Management Increases Revenue 1 Billion/Year at American AirlinesIt can be challenging to turn a profit in the air line business, with margins usually in the 1%to 5% range. Once flights are scheduled, costsare essentially fixed, and they can only hope tofill part of the plane with customers who aren’tas fussy about price. Yield management got itsstart at American Airlines when the industrywas deregulated. New startups PeopleExpressand World Airways were offering one wayfares from New York to San Francisco for 99—less than half the regulated fare. Withtheir higher operating costs, the traditional air lines like American couldn’t exist at suchprices, because even a full load of 99 passen gers would mean losses. Through its Sabreunit, American responded by inventing yieldmanagement. They matched the low fares, butallowed only a portion of their planes to befilled by them, while the newcomers sold everyseat for the same price.In a few years most of the upstarts wereout of business, and yield managementbecame more sophisticated. The founder ofPeopleExpress, Don Burr, claimed that thesuperior yield management abilities of theircompetitors caused their demise (Cross,1997, p.125). American estimates that itsyield management system currently adds 1billion per year in revenue. For American,whose annual profits are rarely above thatfigure, yield management is the differencebetween profitability and bankruptcy.The CEO of American Airlines, BobCrandall, said that “Yield management is thesingle most important technical development intransportation management since . . . deregu lation” (Cross, 1997, p.127).Source: Adapted from Cook (1998).estimated that their overbooking system garners them an additional 225 million inprofit annually (Smith, Leimkuhler, and Darrow, 1992).If airlines did not overbook, planes that are now full would fly an average of 15%empty. “No shows cost the world’s airlines 3 billion annually, even after efforts tominimize the revenue loss by overbooking” (Cross, 1997, p. 146). No shows forrestaurant reservations average about 10%, with some reporting 40% no shows dur ing the Christmas holidays. It has been reported that rental car no shows in theFlorida market reached 70% of reservations. Of course, the alternative to overbook ing is to simply charge the customers whether they show up or not. Unfortunately,that approach failed in restaurants and auto rental businesses, and other businessesdiscarded it out of hand. Consumer resistance was high: Imagine missing your planeflight due to traffic, only to be told, “The seat you paid for is in the sky, the ticket youhave is worthless. The next flight out will cost you another 500, even though theyhave empty seats on that one.” So the question for many businesses is not whether tooverbook, but rather, how much to overbook.
CHAPTER 12Yield ManagementTo demonstrate some mathematical methods to help determine the level of over booking, consider the following example.EXAMPLE 12.1: The Hotel CaliforniaThe Hotel California found that it frequently turned down a customer in the lobbybecause a room was reserved for a customer who never showed up. The manager,felt that the hotel’s policy of overbooking should be examined.The average room rate was 50 per night, but the hotel could not collect theroom rate from the no show customers. If no overbookings were allowed, each no show would in reality cost the hotel 50. If it overbooked too much and filled up earlyin the night, customers with reservations who arrived later to find no rooms availablewould be most unhappy. About 10% of those customers did not cost the hotel anymoney; they merely muttered menacingly and walked out. Another 10% were satis fied with being “walked” (or transferred) to another hotel at no cost to the HotelCalifornia. The remaining guests were so upset by this situation that the hotel had torepair broken lobby furniture at a cost of 150.The hotel’s no show experience is summarized in Table 12.1. What should theoverbooking policy be? We will discuss three approaches to answering that question.OVERBOOKING A PPROACH 1: U SING AVERAGESIn Table 12.1 the average number of no shows is calculated by0(0.05) 1(0.10) 2(0.20) 3(0.15) . . . 10(0.05) 4.05.Since the average number of no shows is four, it might seem reasonable to takeup to four overbookings.This approach offers the advantages of being intuitive and easy to explain. It isalso usually better than doing no overbooking at all. It fails, however, to weigh therelevant costs, which presents a significant disadvantage. For instance, if the cost ofa disgruntled customer is nothing, then the best policy would be to overbook 10 everynight to ensure that the hotel is full. That is, if all the customers who had reserva tions and didn’t get rooms simply left at no cost to the hotel, the hotel would just beconcerned about losing the potential 50 of a paying guest. Likewise, if all the disap pointed customers reacted by telling Norman’s mother on him—the equivalent of aninfinite cost to Mr. Bates—Norman would never overbook.OVERBOOKING A PPROACH 2: S PREADSHEET A NALYSISThe two costs to consider here are:Co Overage (customers denied advance reservation with rooms left unoccu pied, often called “spoilage” in industry)Cs Stockouts (customers with reservations are turned away because no roomsare left, called “walked” customers in the hotel industry and “spill” by theairlines)In this case, Co 50, the cost of the room, and Cs 0.2( 0) 0.8( 150) 120.239
240Matching Supply and DemandPA R T 4TABLE 12.1: Hotel California No-Show ExperienceNo-Shows012345678919Access your Student CDnow for Table 12.2 as anExcel spreadsheet.% of Experiences5102015151055555Cumulative % of Experience5153550657580859095100One way to put the relevant costs into the picture is to use the spreadsheet shownon Table 12.2 (This spreadsheet is also on the CD included with this text.)This spreadsheet calculates the expected cost for every possible scenario. Forexample, if no overbooking is done, then the column labeled “0” shows that on the5% of days when there are zero no shows, there’s no cost at all, but on the 10%of days when there is one no show, the cost is 50. The total cost at the bottomsums up 0.05( 0) 0.10( 50) . . . 0.05( 500) 203. The overbooking levelwith the lowest expected cost is to overbook two rooms, with an expected costof 137.The advantages of this method are that it incorporates relevant costs and canbe spreadsheet based and fairly easy to figure out. Also, as will be seen shortly, ifthe costs and revenues are uncertain or not quite as easy to figure out as in theHotel California example, then this method can be readily adapted. Two disadvan tages of this method, though, are that it requires accurate data and it is a “bruteforce” type of technique that does not increase a manager’s intuition about theproblem.TABLE 12.2: Hotel California Overbooking CostNo-Shows012345678910Total 50.050.0501 0 50 100 150 200 250 300 350 400 450 500 203 120 0 50 100 150 200 250 300 350 400 450 161Number of Reservations Overbooked23456 240 120 0 50 100 150 200 250 300 350 400 137 360 240 120 0 50 100 150 200 250 300 350 146 480 360 240 120 0 50 100 150 200 250 300 181 600 480 360 240 120 0 50 100 150 200 250 242 720 600 480 360 240 120 0 50 100 150 200 31978910 840 720 600 480 360 240 120 0 50 100 150 405 960 840 720 600 480 360 240 120 0 50 100 500 1,080 960 840 720 600 480 360 240 120 0 50 603 1,200 1,080 960 840 720 600 480 360 240 120 0 714
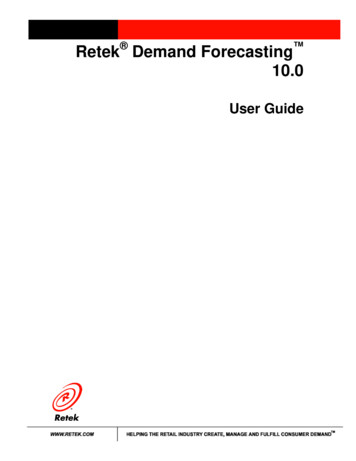
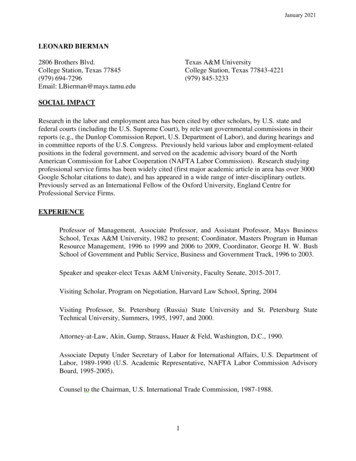
Yield ManagementCHAPTER 12241OVERBOOKING APPROACH 3: MARGINAL COST APPROACHUsing a little algebra, this method comes at the problem mathematically by notingthat one would like to keep accepting bookings until the expected revenue is less thanor equal to the expected loss from the last booking. Mathematically, increase book ings untilE(revenue of next booking) E(cost of next booking)which is the same asRevenue of filling a room Probability of more no shows than overbookedrooms Cost of dissatisfied customer Probability of fewer or the same num ber of no shows than overbooked roomsOr, in the mathematical terms used previously,Co P(Overbookings No shows) Cs P(Overbookings No shows)which can be converted toCo [1 – P(Overbookings No shows)] Cs P(Overbookings No shows)or equivalently,Co – Co P(Overbookings No shows) Cs P(Overbookings No shows)Adding Co P(Overbookings No shows) to both sides and dividing both sidesby (Co Cs) leaves the basic overbooking formula: Accept bookings untilCo /(Cs Co) P(Overbookings No shows)(12.1)In the preceding problem, this calculation leads to 50/( 120 50) 0.29Looking at Table 12.1, the smallest number of overbookings at whichP(Overbookings No shows) is 2, where the cumulative probability of no showsreaching this level is 0.35.This basic formula is easy to remember and apply, even to informal data. Forexample, Co, the lost potential revenue, may be easy to figure in most circumstances,but Cs is not, and usually must be estimated. Also, the cumulative probability distri bution of no shows is often not accurately known. So a general feel that, say, a com plaining customer is three times as costly as the potential revenue means that amanager would only want to overbook until P(Overbookings No shows) is about1/(1 3) 25%. So, if the average number of no shows is about 15 with a stan dard deviation of five, using the traditional z score calculations from standard statis tics texts, about 12 overbookings might be appropriate.Although this formula is simple to use, it presents a significant drawback.Equation (12.1) implicitly assumes a linear cost of dissatisfied reservation holders;that is, if only one customer in your hotel lobby or airport lounge is dissatisfied andwill cost 300 to placate, then 20 dissatisfied customers will cost 20 300 6,000 to satisfy. Unfortunately, that answer is not always the case. As shown inFigure 12.1, the cost curve for overbooking can increase per person with the num ber of unhappy customers. A roomful of 20 unhappy customers is far more of aproblem than 20 instances of a single unhappy customer. Although this formuladoes not account for this contingency, the spreadsheet method can easily be pro grammed with it in mind.
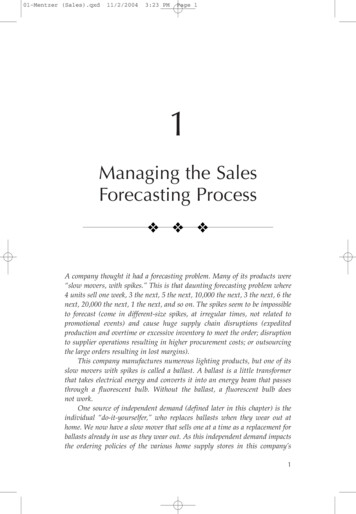
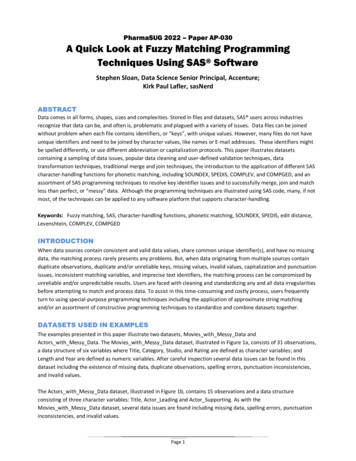
242PA R T 4Matching Supply and DemandFIGURE 12.1: Actual Versus Linear Overbooking Cost CurveCost ofDissatisfiedCustomers0510152025Number of Dissatisfied CustomersCost shape assumed by equation (12.1)Actual cost curve shapeDynamic OverbookingThe overbooking decision is often not a one time, “static” decision. Rather, it is adecision that is “dynamic,” which here just means that it changes over time. In a typ ical situation for a firm that takes reservations a long time in advance, the dynamicoverbooking curve is shaped like Figure 12.2.When the event is still a long time in the future, the allowed number of overbook ings for it is at a peak. As the event nears, the number of allowed overbookings drops.This practice reaches its logical conclusion at the time the event takes place, whenallowed overbookings drop to zero. For example, if three people are running to theplane for the final boarding and only two seats are available, the third person will notbe sold a seat that cannot possibly be used.A LLOCATING C APACITYA difficult problem that afflicts many firms is allocating capacity among their cus tomer groups. That is, when to say “no, we’re full” to one customer while holdingopen capacity in hopes that a more profitable customer will arrive later. For airlinesand hotels, especially, reservation activity follows Figure 12.3: High revenue cus tomers tend to make reservations fairly close to the event, while low revenue cus tomers often make reservations months in advance. In the airline industry, theprice conscious vacationers make reservations months in advance, while the high paying business travelers may make reservations close to the event. For hotels, price conscious group business may make reservations a year in advance, while morehighly profitable transient business may simply walk in the door that day. For thesake of simplicity, this chapter will focus on segmenting capacity between just two
CHAPTER 12Yield Management243FIGURE 12.2: Dynamic OverbookingAmount ofOverbookingAllowedEvent OccursReservations StartTime to Eventcustomer groups. The real problem, however, is far more complex. A modern airlinecan have 10 different customer segments on the plane, each of which requires acapacity allocation decision (Cross, 1004).The situation depicted in Figure 12.3 is complex because one cannot simply letall reservations be taken first come, first served. Doing so would cause a firm to turnaway a substantial portion of their most profitable customers while filling up on theless profitable ones. Also, most firms cannot simply say “no” to lower revenue busi ness, because they cannot fill their capacity solely with high revenue business.Consequently, the firm must decide ahead of time at what point to shut off the low revenue business in anticipation of the high revenue business booking later.FIGURE 12.3 Cumulative Reservation ActivityNumber ofReservationsEvent OccursReservations StartTime to EventCapacityHigh-revenue reservationsLow-revenue reservations
244PA R T 4Matching Supply and DemandThe general methods used to solve this problem can be classified as follows: Nested versus distinctStatic versus dynamicTo demonstrate the differences in these methods, let’s first describe anexample problem.EXAMPLE 12.2: Chancey TravelChancey Travel is offering a cruise to the Antarctic and wants to fill the 100 cabins avail able. Its primary market is Premium customers. Premium customers pay 12,000 forthe trip, and the variable costs of serving these customers amounts to 2,000 per trip,as they are pampered endlessly and plied with Godiva chocolate three times a day.According to market analysis, the demand from Premium passengers is uniformly dis tributed between 51 and 100, which means a 2% chance that 51 Premiums will sign up,a 2% chance that 52 will go, and so on up to a 2% chance that the entire boat can befilled with 100 Premiums. This means that if the entire boat were reserved for Premiumsan average of 75 Premiums would be on board. Premiums come from the idle rich, whotend to make their decisions at the last minute.Because the probability that the entire boat cannot be filled with Premiums is sub stantial, another market is sought. Market research discovered customer interest in a“rough” experience to Antarctica, but these consumers were more price sensitive.These Discount customers paid 2,500 for the trip, but the marginal cost of servingthem was 0: heat was turned off to their cabins (hot water bottles were available fora proper deposit), and they received no food (they had to catch penguins with theirown equipment). Demand was such that the ship could be entirely filled withDiscounts, and these customers were willing to book far in advance.The dilemma for Chancey Travel is: How many cabins should be reserved in hopesof Premium customers? Several methods for arriving at an answer are discussed here.C APACITY A LLOCATION A PPROACH 1: S TATICM ETHODS : F IXED N UMBER , F IXED T IME RULESWe begin with static or one time decision rules. Basic fixed number and fixed timerules are the easiest to implement. A fixed time rule means simply that a firm willaccept discount bookings until a specific date. No limit is set on the number of dis count sales. The motivation for this type of rule is the transparency to the customerand the ease of implementation, but it is clearly not close to being optimal. A fixednumber rule for the problem may be to, say, reserve exactly 75 slots for Premium cus tomers and exactly 25 slots for Discount customers. The amounts reserved for eachgroup can be viewed as a quota. Although a step up from the fixed time rule, it too pres ents certain problems. For example, if 75 Premiums and 20 Discounts are currentlysigned up, and a Premium customer wants to pay, this type of rule states that thePremium customer must be turned away because the Premium slots are already filled.C APACITY A LLOCATION A PPROACH 2:N ESTED S TATIC M ETHODSTo get around the somewhat absurd problem of turning down more profitable cus tomers in hopes that less profitable ones will appear later, so called nested methods
CHAPTER 12Yield Managementare use
Yield management is a relatively young science. Airlines are credited with the invention of most of these techniques, especially Sabre, formerly with American Airlines (see the Service Operations Management Practices: Yield Management Increases Revenue 1 Billion/Year at American Airlines). However, the airlines did not