Transcription
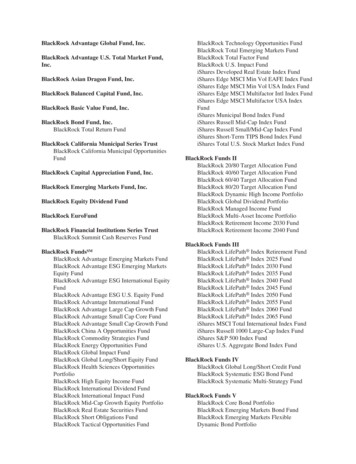
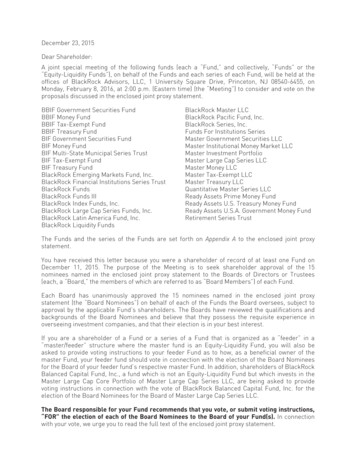
2022BlackRock CDNLifePath Fact SheetRetirement Fund IThe BlackRock CDN LifePath Index Funds are a range of pooled funds designed to meetthe needs of investors in defined contribution pension plans throughout their workinglives. Each trust’s objective is to maximize total return with a risk level that may beappropriate for the fund's particular timeframe. The manager uses quantitative methodsto approximate an appropriate risk level for average investors at various stages in theirworking lives.The BlackRock CDN LifePath Retirement Index Fund I is designed for participants whohave retired between 2008 and 2012. The BlackRock CDN LifePath Retirement IndexFund I has reached its most conservative risk level, and is designed to provide those whoare withdrawing money from their plan with an appropriate blend of income and inflationprotection. It does this by holding a mix of equity and equity-like asset classes and fixedincome instruments.Fund sizeC 2,281,165,660Long time frameShort time framebondsstocksBlackRock CDN LifePath Retirement Index Fund ICurrent asset allocation2%3%2%26%By investing in a BlackRock CDN LifePath Retirement Index Fund I, you may capturediversified investment opportunities without having to worry about the day-to-daymanagement of your money. Target-date funds seek an appropriate balance ofinvestment return and price stability given the portfolio’s time horizon.9%Rather than trying to mix and manage a collection of different funds, you only need toselect one BlackRock CDN LifePath Index Fund to access a well-diversified investmentmix for a particular target year allocation. Please be aware that although BlackRock CDNLifePath Index Funds may provide a suitable alternative to mixing and monitoringinvestments on your own, your overall saving success will be affected by severaladditional factors such as the number of years you contribute to the plan and yourcontribution rate, as well as overall market returns and your other investments.Fund performanceQTD %YTD %1 year %3 year %5 year %Sinceinception%BlackRock CDN LifePathRetirement Index Fund turns for periods greater than one year are annualizedPast performance is not necessarily indicative of future performanceFund performance inception: March 2007The asset allocation of the fund will change over time. Fund returns are based on static asset allocations for eachquarter. The benchmark asset allocation will change over time. Benchmark returns are blended and are based onthe fund’s actual asset allocation and the actual returns of the S&P/TSX Composite Index; S&P/TSX Capped REITIndex; S&P 500 Index; Deutsche Bank Liquid Commodity Excess Return Index until 6/30/10 and S&P GSCICommodity Index thereafter; Russell 2000 Index; MSCI EAFE Index; MSCI Emerging Markets Index; FTSECanada Universe Bond Index (formerly DEX Universe Bond Index); FTSE Canada Long Term Bond Index(formerly DEX Long Term Bond Index) until 6/30/08, a custom benchmark using the FTSE Canada Long TermBond Index and excluding all bonds rated BBB or lower thereafter; FTSE Canada Real Return Bond Index(formerly DEX Real Return Bond Index); FTSE Canada 91 Day T-Bill Index (formerly DEX 91 Day T-Bill Index) andthe Dow Jones US Real Estate Index (the Indices). As of 10/1/08, in addition to the Indices, the benchmark returnsinclude the actual returns for the S&P 500 Index (CAD-Hedged), MSCI EAFE Index (CAD-Hedged), Russell 2000Index (CAD-Hedged) and the hedged returns for the Deutsche Bank Liquid Commodity Excess Return Index, DowJones US Real Estate Index and the S&P Global Infrastructure Index. As of 07/01/10, the hedged returns of theDeutsche Bank Liquid Commodity Excess Return Index were replaced with the hedged returns of the S&P GSCICommodity Index. Hedged index returns are based on actual index returns and are calculated by adding theunhedged index return in CAD and the return of the foreign currency basket sold forward into CAD at the beginningof the calculation period. As of 08/01/12, the Dow Jones Brookfield Global Infrastructure Index and FTSEEPRA/NAREIT Developed Index were added to the blended benchmark. The S&P/TSX REIT Index, Dow JonesUS Real Estate Index, S&P Global Infrastructure Index, S&P 500 Index (CAD-Hedged), Russell 2000 Index (CADHedged), MSCI EAFE Index (CAD-Hedged) and the hedged returns for the S&P GSCI Commodity Index, DowJones US Real Estate Index and S&P Infrastructure Index were removed from the blended benchmark. As of08/01/12, the S&P 500 Index net of withholding tax replaced the S&P 500 Index gross of withholding tax. As of11/30/13, the FTSE Canada Long Term Bond Index replaced the custom benchmark calculated using the FTSECanada Long Term Bond Index excluding all bonds rated BBB or lower.58%Global Equities ex CanadaCanadian EquitiesCanadian BondsCanadian Real Return BondsReal EstateAlternativeRisk/return potentialHigher Expected Risk/Return {stocks}Moderate Expected Risk/Return {bonds}Lower Expected Risk/Return {money market}This chart is for illustrative purposes only anddoes not predict future risk or performance.Proprietary and Confidential:This material may not be distributed beyond its intended audience.
BlackRock CDN LifePath Index FundsQ3 2017Fund manager commentaryThe gross-of-fee performance of the CDN LifePath Index Funds (LifePath) ranged from -5.42% to -4.07% in the firstquarter of 2022. Longer-dated vintages outperformed shorter-dated vintages due to their higher allocation to equitieswhich outperformed bonds in Q1 2022.Despite the large lockdowns in January due to Omicron, the Canadian economy remained resilient with GDP figuressurpassing expectations and labour markets grinding tighter.Global equities ex Canada struggled in Q1 detracting from performance. US equities returned -5.7% while EmergingMarkets equities returned -8.0%. Financial markets which were already being tested by the pandemic, rising inflation,and prospects of a global wave of central bank tightening, were further injected with new uncertainty after Russia’sinvasion of Ukraine. Canadian equities showed resilience and ended the quarter higher, delivering 3.8%. Fixed Incomesuffered and while the launch of Russia’s invasion of Ukraine in late February caused a rally in yields, rates marketsreverted back to rising significantly across the curve. Canada Universe bonds returned -7.0% outperforming their RealReturn counterparts which returned -9.3%. Commodities achieved particularly strong returns in Q1, returning 31.6%with Energy being the best performing component amid rising global demand and fears of supply curbs as a result of thewar in Ukraine. The Global Infrastructure exposure was also additive over the same period returning 2.0%.This material is intended for accredited investors in Canada only. The information and opinions herein are provided for informational purposes only, aresubject to change and should not be relied upon as the basis for your investment decisions. Past performance is not necessarily indicative of futureperformance. This document is not and should not be construed as a solicitation or offering of units of any fund or other security in any jurisdiction. Nopart of this material may be reproduced in any manner without the prior written permission of BlackRock Asset Management Canada Limited. 2022 BlackRock Asset Management Canada Limited. All rights reserved. BLACKROCK is a registered trademark of BlackRock, Inc., or itssubsidiaries in the United States and elsewhere. Used with permission. All other trademarks, service marks or registered trademarks are the property oftheir respective owners.Proprietary and Confidential:This material may not be distributed beyond its intended audience.
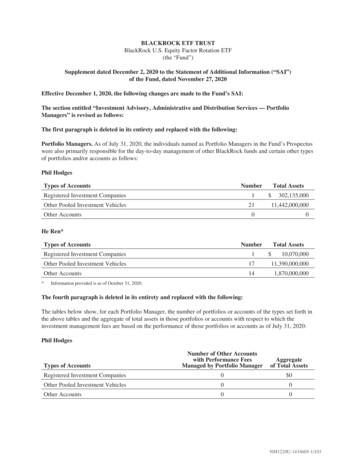
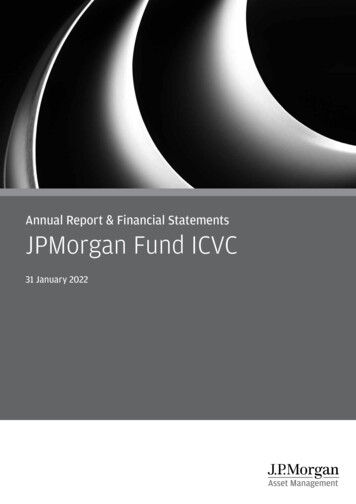
2022BlackRock Fact SheetCDN LifePath Retirement Index Fund IIThe BlackRock CDN LifePath Index Funds are a range of pooled funds designed tomeet the needs of investors in defined contribution pension plans throughout theirworking lives. Each trust’s objective is to maximize total return with a risk level thatmay be appropriate for the fund's particular timeframe. The fund manager usesquantitative methods to approximate an appropriate risk level for average investorsat various stages in their working lives.The BlackRock CDN LifePath Retirement Index Fund II is designed for participantswho will be retiring between 2019 and 2022. The BlackRock CDN LifePathRetirement Index Fund II reached its most conservative risk level at the end of 2019,at which time it held the same asset allocation as the BlackRock CDN LifePath IndexRetirement Fund, which is designed to provide those who are withdrawing moneyfrom their plan with an appropriate blend of income and inflation protection. TheBlackRock CDN LifePath Index Retirement Fund does this by holding a mix of equityand equity-like asset classes and fixed income instruments.Fund sizeC 2,024,107,253Long time frameShort time framebondsstocksBlackRock CDN LifePath Retirement Index Fund IICurrent asset allocation2%3% 2%25%By investing in a BlackRock CDN LifePath Retirement Index Fund II you may capturediversified investment opportunities without having to worry about the day-to-daymanagement of your money. Target-date funds seek an appropriate balance ofinvestment return and price stability given the portfolio’s time horizon.9%Rather than trying to mix and manage a collection of different funds, you only need toselect one BlackRock CDN LifePath Index Fund to access a well-diversifiedinvestment mix for a particular target year allocation. Please be aware that althoughBlackRock CDN LifePath Index Funds may provide a suitable alternative to mixingand monitoring investments on your own, your overall saving success will be affectedby several additional factors such as the number of years you contribute to the planand your contribution rate, as well as overall market returns and your otherinvestments.Fund performanceQTD %YTD %1 year %3 year %5 year %59%Global Equities ex CanadaCanadian EquitiesCanadian BondsCanadian Real Return BondsReal EstateAlternativeSinceinception%BlackRock CDN LifePath 2020Index Fund-5.43-5.431.644.805.044.92Risk/return ence0.010.01-0.060.040.03-0.02The risk and return level of this fund is designed to changeslowly as the fund approaches the year 2020. It graduallymoves from having higher potential return and lower pricestability, to eventually having more price stability and lowerpotential return.Returns for periods greater than one year are annualizedPast performance is not necessarily indicative of future performanceFund performance inception: March 2007The asset allocation of the fund will change over time. Fund returns are based on static asset allocations foreach quarter. The benchmark asset allocation will change over time. Benchmark returns are blended and arebased on the fund’s actual asset allocation and the actual returns of the S&P/TSX Composite Index;S&P/TSX Capped REIT Index; S&P 500 Index; Deutsche Bank Liquid Commodity Excess ReturnIndex until 6/30/10 and S&P GSCI Commodity Index thereafter; Russell 2000 Index; MSCI EAFE Index;MSCI Emerging Markets Index; FTSE Canada Universe Bond Index (formerly DEX Universe Bond Index);FTSE Canada Long Term Bond Index (formerly DEX Long Term Bond Index) until 6/30/08,a custom benchmark using the FTSE Canada Long Term Bond Index and excluding all bonds rated BBB orlower thereafter; FTSE Canada Real Return Bond Index (formerly DEX Real Return Bond Index); FTSECanada 91 Day T-Bill Index (formerly DEX 91 Day T-Bill Index) and the DowJones US Real Estate Index (the Indices). As of 10/1/08, in addition to the Indices, the benchmark returnsinclude the actual returns for the S&P 500 Index (CAD-Hedged), MSCI EAFE Index(CAD-Hedged), Russell 2000 Index (CAD-Hedged) and the hedged returns for the Deutsche Bank LiquidCommodity Excess Return Index, Dow Jones US Real Estate Index and the S&P Global Infrastructure Index.As of 07/01/10, the hedged returns of the Deutsche Bank Liquid Commodity Excess Return Index werereplaced with the hedged returns of the S&P GSCI Commodity Index. Hedged index returns are based onactual index returns and are calculated by adding the unhedged index return in CAD andthe return of the foreign currency basket sold forward into CAD at the beginning of the calculation period.As of 08/01/12, the Dow Jones Brookfield Global Infrastructure Index and FTSE EPRA/NAREIT DevelopedIndex were added to the blended benchmark. The S&P/TSX REIT Index, Dow Jones US Real Estate Index,S&P Global Infrastructure Index, S&P 500 Index (CAD-Hedged), Russell 2000 Index(CAD-Hedged), MSCI EAFE Index (CAD-Hedged) and the hedged returns for the S&P GSCI CommodityIndex, Dow Jones US Real Estate Index and S&P Infrastructure Index were removed from the blendedbenchmark. As of 08/01/12, the S&P 500 Index net of withholding tax replaced the S&P 500 Index gross ofwithholding tax. As of 11/30/13, the FTSE Canada Long Term Bond Index replaced the custom benchmarkcalculated using the FTSE Canada Long Term Bond Index excluding all bonds rated BBB or lower.Higher Expected Risk/Return {stocks}Moderate Expected Risk/Return {bonds}Lower Expected Risk/Return {money market}This chart is for illustrative purposes only and doesnot predict future risk or performance.Proprietary and Confidential:This material may not be distributed beyond its intended audience.
BlackRock CDN LifePath Index FundsQ3 2017Fund manager commentaryThe gross-of-fee performance of the CDN LifePath Index Funds (LifePath) ranged from -5.42% to -4.07% in the firstquarter of 2022. Longer-dated vintages outperformed shorter-dated vintages due to their higher allocation to equitieswhich outperformed bonds in Q1 2022.Despite the large lockdowns in January due to Omicron, the Canadian economy remained resilient with GDP figuressurpassing expectations and labour markets grinding tighter.Global equities ex Canada struggled in Q1 detracting from performance. US equities returned -5.7% while EmergingMarkets equities returned -8.0%. Financial markets which were already being tested by the pandemic, rising inflation,and prospects of a global wave of central bank tightening, were further injected with new uncertainty after Russia’sinvasion of Ukraine. Canadian equities showed resilience and ended the quarter higher, delivering 3.8%. Fixed Incomesuffered and while the launch of Russia’s invasion of Ukraine in late February caused a rally in yields, rates marketsreverted back to rising significantly across the curve. Canada Universe bonds returned -7.0% outperforming their RealReturn counterparts which returned -9.3%. Commodities achieved particularly strong returns in Q1, returning 31.6%with Energy being the best performing component amid rising global demand and fears of supply curbs as a result of thewar in Ukraine. The Global Infrastructure exposure was also additive over the same period returning 2.0%.This material is intended for accredited investors in Canada only. The information and opinions herein are provided for informational purposes only, aresubject to change and should not be relied upon as the basis for your investment decisions. Past performance is not necessarily indicative of futureperformance. This document is not and should not be construed as a solicitation or offering of units of any fund or other security in any jurisdiction. Nopart of this material may be reproduced in any manner without the prior written permission of BlackRock Asset Management Canada Limited. 2022 BlackRock Asset Management Canada Limited. All rights reserved. BLACKROCK is a registered trademark of BlackRock, Inc., or itssubsidiaries in the United States and elsewhere. Used with permission. All other trademarks, service marks or registered trademarks are the property oftheir respective owners.Proprietary and Confidential:This material may not be distributed beyond its intended audience.
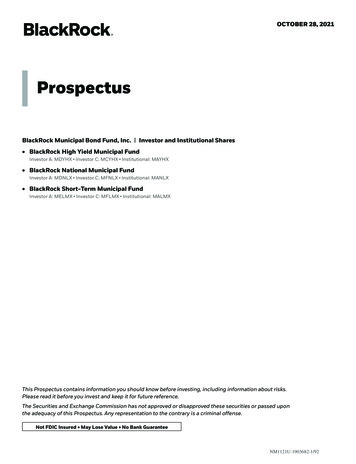
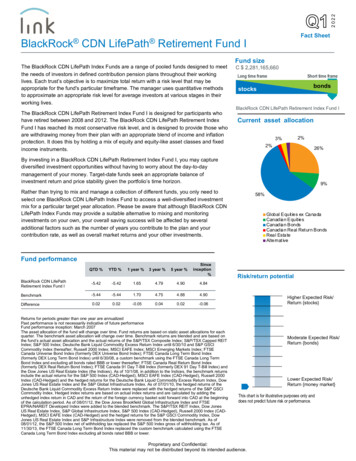
2022BlackRock CDNLifePath Fact Sheet2025 Index FundThe BlackRock CDN LifePath Index Funds are a range of pooled funds designed tomeet the needs of investors in defined contribution pension plans throughout theirworking lives. Each trust’s objective is to maximize total return with a risk level that maybe appropriate for the fund's particular timeframe. The fund manager uses quantitativemethods to approximate an appropriate risk level for average investors at variousstages in their working lives.The BlackRock CDN LifePath 2025 Index Fund is designed for participants who will beretiring between 2023 and 2027. The BlackRock CDN LifePath 2025 Index Fund willreach its most conservative risk level at the end of 2024, at which time it will hold thesame asset allocation as the BlackRock CDN LifePath Index Retirement Fund, which isdesigned to provide those who are withdrawing money from their plan with anappropriate blend of income and inflation protection. The BlackRock CDN LifePathIndex Retirement Fund does this by holding a mix of equity and equity-like assetclasses and fixed income instruments.Fund sizeC 6,481,242,990Long time frameShort time framebondsstocksBlackRock CDN LifePath 2025 Index FundCurrent asset allocation3% 3%2%31%By investing in a BlackRock CDN LifePath 2025 Index Fund you may capturediversified investment opportunities without having to worry about the day-to-daymanagement of your money. Target-date funds seek an appropriate balance ofinvestment return and price stability given the portfolio’s time horizon.51%Rather than trying to mix and manage a collection of different funds, you only need toselect one BlackRock CDN LifePath Index Fund to access a well-diversified investmentmix for a particular target year allocation. Please be aware that although BlackRockCDN LifePath Index Funds may provide a suitable alternative to mixing and monitoringinvestments on your own, your overall saving success will be affected by severaladditional factors such as the number of years you contribute to the plan and yourcontribution rate, as well as overall market returns and your other investments.Fund performanceQTD %YTD %1 year %3 year %5 year %10%Global Equities ex CanadaCanadian EquitiesCanadian BondsCanadian Real Return BondsReal EstateAlternativeSinceinception%BlackRock CDN LifePath 2025Index Returns for periods greater than one year are annualizedPast performance is not necessarily indicative of future performanceFund performance inception: October 2007Past performance is not necessarily indicative of future performance. Fund performance inception: October 2007The asset allocation of the fund will change over time. Fund returns are based on static asset allocations for eachquarter. The benchmark asset allocation will change over time. Benchmark returns are blended and are based onthe fund’s actual asset allocation and the actual returns of the S&P/TSX Composite Index; S&P/TSX Capped REITIndex; S&P 500 Index; Deutsche Bank Liquid Commodity Excess Return Index until 6/30/10 and S&P GSCICommodity Index thereafter; Russell 2000 Index; MSCI EAFE Index; MSCI Emerging Markets Index; FTSECanada Universe Bond Index (formerly DEX Universe Bond Index); FTSE Canada Long Term Bond Index(formerly DEX Long Term Bond Index) until 6/30/08, a custom benchmark using the FTSE Canada Long TermBond Index and excluding all bonds rated BBB or lower thereafter; FTSE Canada Real Return Bond Index(formerly DEX Real Return Bond Index); FTSE Canada 91 Day T-Bill Index (formerly DEX 91 Day T-Bill Index) andthe Dow Jones US Real Estate Index (the Indices). The blended benchmark returns for performance reportsprovided prior to 12/31/09 were calculated using the FTSE Canada Long Term Bond Index for the period 06/30/08to 09/30/09. The blended benchmark returns for performance reports provided after 12/31/09 for the period06/30/08 to 09/30/09 are calculated using a custom benchmark calculated using the FTSE Canada Long TermBond Index and excluding all bonds rated BBB or lower to reflect the benchmark change to the underlyingstrategy. As of 10/1/08, in addition to the Indices, the benchmark returns include the actual returns for the S&P500 Index (CAD-Hedged), MSCI EAFE Index (CAD-Hedged), Russell 2000 Index (CAD-Hedged) and the hedgedreturns for the Deutsche Bank Liquid Commodity Excess Return Index, Dow Jones US Real Estate Index and theS&P Global Infrastructure Index. As of 07/01/10, the hedged returns of the Deutsche Bank Liquid CommodityExcess Return Index were replaced with the hedged returns of the S&P GSCI Commodity Index. Hedged indexreturns are based on actual index returns and are calculated by adding the unhedged index return in CAD and thereturn of the foreign currency basket sold forward into CAD at the beginning of the calculation period. As of08/01/12, the Dow Jones Brookfield Global Infrastructure Index and FTSE EPRA/NAREIT Developed Index wereadded to the blended benchmark. The S&P/TSX REIT Index, Dow Jones US Real Estate Index, S&P GlobalInfrastructure Index, S&P 500 Index (CAD-Hedged), Russell 2000 Index (CAD-Hedged), MSCI EAFE Index (CADHedged) and the hedged returns for the S&P GSCI Commodity Index, Dow Jones US Real Estate Index and S&PInfrastructure Index were removed from the blended benchmark. As of 08/01/12, the S&P 500 Index net ofwithholding tax replaced the S&P 500 Index gross of withholding tax. As of 11/30/13, the FTSE Canada LongTerm Bond Index replaced the custom benchmark calculated using the FTSE Canada Long Term Bond Indexexcluding all bonds rated BBB or lower.Risk/return potentialThe risk and return level of this fund is designed to changeslowly as the fund approaches the year 2025. It graduallymoves from having higher potential return and lower pricestability, to eventually having more price stability and lowerpotential return.Higher Expected Risk/Return {stocks}Moderate Expected Risk/Return {bonds}Lower Expected Risk/Return {money market}This chart is for illustrative purposes only and doesnot predict future risk or performance.Proprietary and Confidential:This material may not be distributed beyond its intended audience.
BlackRock CDN LifePath Index FundsQ3 2017Fund manager commentaryThe gross-of-fee performance of the CDN LifePath Index Funds (LifePath) ranged from -5.42% to -4.07% in the firstquarter of 2022. Longer-dated vintages outperformed shorter-dated vintages due to their higher allocation to equitieswhich outperformed bonds in Q1 2022.Despite the large lockdowns in January due to Omicron, the Canadian economy remained resilient with GDP figuressurpassing expectations and labour markets grinding tighter.Global equities ex Canada struggled in Q1 detracting from performance. US equities returned -5.7% while EmergingMarkets equities returned -8.0%. Financial markets which were already being tested by the pandemic, rising inflation,and prospects of a global wave of central bank tightening, were further injected with new uncertainty after Russia’sinvasion of Ukraine. Canadian equities showed resilience and ended the quarter higher, delivering 3.8%. Fixed Incomesuffered and while the launch of Russia’s invasion of Ukraine in late February caused a rally in yields, rates marketsreverted back to rising significantly across the curve. Canada Universe bonds returned -7.0% outperforming their RealReturn counterparts which returned -9.3%. Commodities achieved particularly strong returns in Q1, returning 31.6%with Energy being the best performing component amid rising global demand and fears of supply curbs as a result of thewar in Ukraine. The Global Infrastructure exposure was also additive over the same period returning 2.0%.This material is intended for accredited investors in Canada only. The information and opinions herein are provided for informational purposes only, aresubject to change and should not be relied upon as the basis for your investment decisions. Past performance is not necessarily indicative of futureperformance. This document is not and should not be construed as a solicitation or offering of units of any fund or other security in any jurisdiction. Nopart of this material may be reproduced in any manner without the prior written permission of BlackRock Asset Management Canada Limited. 2022 BlackRock Asset Management Canada Limited. All rights reserved. BLACKROCK is a registered trademark of BlackRock, Inc., or itssubsidiaries in the United States and elsewhere. Used with permission. All other trademarks, service marks or registered trademarks are the property oftheir respective owners.Proprietary and Confidential:This material may not be distributed beyond its intended audience.
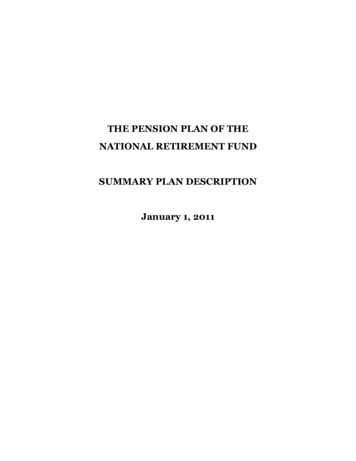
2022BlackRock CDNLifePath Fact Sheet2030 Index FundThe BlackRock CDN LifePath Index Funds are a range of pooled funds designed tomeet the needs of investors in defined contribution pension plans throughout theirworking lives. Each trust’s objective is to maximize total return with a risk level thatmay be appropriate for the fund's particular timeframe. The fund manager usesquantitative methods to approximate an appropriate risk level for average investorsat various stages in their working lives.The BlackRock CDN LifePath 2030 Index Fund is designed for participants who willbe retiring between 2028 and 2032. The BlackRock CDN LifePath 2030 Index Fundwill reach its most conservative risk level at the end of 2029, at which time it will holdthe same asset allocation as the BlackRock CDN LifePath Index Retirement Fund,which is designed to provide those who are withdrawing money from their plan withan appropriate blend of income and inflation protection. The BlackRock CDNLifePath Index Retirement Fund does this by holding a mix of equity and equity-likeasset classes and fixed income instruments.Fund sizeC 7,593,618,328Long time frameBlackRock CDN LifePath 2030 Index FundCurrent asset allocation4%YTD %1 year %3 year %5 year %39%40%12%Global Equities ex CanadaCanadian EquitiesCanadian BondsCanadian Real Return BondsReal EstateSinceinception%BlackRock CDN LifePath 2030Index 23%2%Rather than trying to mix and manage a collection of different funds, you only need toselect one BlackRock CDN LifePath Index Fund to access a well-diversifiedinvestment mix for a particular target year allocation. Please be aware that althoughBlackRock CDN LifePath Index Funds may provide a suitable alternative to mixingand monitoring investments on your own, your overall saving success will be affectedby several additional factors such as the number of years you contribute to the planand your contribution rate, as well as overall market returns and your otherinvestments.QTD %bondsstocksstocksBy investing in a BlackRock CDN LifePath 2030 Index Fund you may capturediversified investment opportunities without having to worry about the day-to-daymanagement of your money. Target-date funds seek an appropriate balance ofinvestment return and price stability given the portfolio’s time horizon.Fund performanceShort time frameAlternativeRisk/return potentialThe risk and return level of this fund is designed to changeslowly as the fund approaches the year 2030. It graduallymoves from having higher potential return and lower pricestability, to eventually having more price stability and lowerpotential return.Higher Expected Risk/Return {stocks}Returns for periods greater than one year are annualizedPast performance is not necessarily indicative of future performanceFund performance inception: March 2007The asset allocation of the fund will change over time. Fund returns are based on static asset allocations for eachquarter. The benchmark asset allocation will change over time. Benchmark returns are blended and are based on thefund’s actual asset allocation and the actual returns of the S&P/TSX Composite Index; S&P/TSX Capped REIT Index;S&P 500 Index; Deutsche Bank Liquid Commodity Excess Return Index until 6/30/10 and S&P GSCI CommodityIndex thereafter; Russell 2000 Index; MSCI EAFE Index; MSCI Emerging Markets Index; FTSE Canada UniverseBond Index (formerly DEX Universe Bond Index); FTSE Canada Long Term Bond Index (formerly DEX Long TermBond Index) until 6/30/08, a custom benchmark using the FTSE Canada Long Term Bond Index and excluding allbonds rated BBB or lower thereafter; FTSE Canada Real Return Bond Index (formerly DEX Real Return Bond Index);FTSE Canada 91 Day T-Bill Index (formerly DEX 91 Day T-Bill Index) and the Dow Jones US Real Estate Index (theIndices). The blended benchmark returns for performance reports provided prior to 12/31/09 were calculated usingthe FTSE Canada Long Term Bond Index for the period 06/30/08 to 09/30/09. The blended benchmark returns forperformance reports provided after 12/31/09 for the period 06/30/08 to 09/30/09 are calculated using a custombenchmark calculated using the FTSE Canada Long Term Bond Index and excluding all bonds rated BBB or lower toreflect the benchmark change to the underlying strategy. As of 10/1/08, in addition to the Indices, the benchmarkreturns include the actual returns for the S&P 500 Index (CAD-Hedged), MSCI EAFE Index (CAD-Hedged), Russell2000 Index (CAD-Hedged) and the hedged returns for the Deutsche Bank Liquid Commodity Excess Return Index,Dow Jones USReal Estate Index and the S&P Global Infrastructure Index. As of 07/01/10, the hedged returns of theDeutsche Bank Liquid Commodity Excess Return Index were replaced with the hedged returns of the S&P GSCICommodity Index. Hedged index returns are based on actual index returns and are calculated by adding theunhedged index return in CAD and the return of the foreign currency basket sold forward into CAD at the beginning ofthe calculation period. As of 08/01/12, the Dow Jones Brookfield Global Infrastructure Index and FTSE EPRA/NAREIT
The asset allocation of the fund will change over time. Fund returns are based on static asset allocations for each quarter. The benchmark asset allocation will change over time. Benchmark returns are blended and are based on the fund's actual asset allocation and the actual returns of the S&P/TSX Composite Index; S&P/TSX Capped REIT