Transcription
IEEE TRANSACTIONS ON WIRELESS COMMUNICATIONS, VOL. 11, NO. 4, APRIL 20121301Collaborative Vehicular Content Dissemination with Directional AntennasYong Li, Student Member, IEEE, Zhaocheng Wang, Senior Member, IEEE, Depeng Jin, Member, IEEE,Lieguang Zeng, and Sheng Chen, Fellow, IEEEAbstract—We study the performance of collaborative vehicularcontent dissemination, where the content is distributed withinthe network by vehicle-to-vehicle opportunistic communicationsand the vehicle nodes are equipped with directional antennas.Through analysing a large real-world vehicle trace, we adoptan accurate mobility model of Lévy-walk to set up the realistic vehicular network simulation environment. Using a fluidapproximation, we derive a theoretical model to depict the systemperformance of content dissemination time. The accuracy of theproposed analysis is confirmed by simulation results, which alsoshow that the directional antenna performs better than the omnidirectional antenna in our considered scenario, especially whenthe antenna beam is well scheduled with small beamwidth andhigh beam steering rate.Index Terms—Collaborative content dissemination, vehicularnetworks, Lévy-walk mobility, directional antennas.I. I NTRODUCTIONRECENTLY, interests on large-scale vehicular ad hocnetworks have grown significantly [1], as more andmore vehicles are equipped with devices to provide vehicularcommunication capacities. Many applications of vehicularnetworks are also emerging, include automatic collision warning, remote vehicle diagnostics, emergency management andassistance for safely driving, vehicle tracking, automobile highspeed Internet access, and multimedia content sharing. InUSA, Federal Communications Commission has allocated 75MHz of spectrum for dedicated short-range communicationsin vehicular networks [2], and IEEE is also working on therelated standard specifications. Efficient content disseminationis a key issue for many vehicular network applications, suchas content publishing for safety information and entertainmentdata [3]. These content dissemination applications might besupported within the existing wireless infrastructure, such asWiFi and 3G, but the coverage issue and economic consideration from both service providers and end users do not makesuch a solution efficient and viable. Another reason is that theManuscript received June 30, 2011; revised November 4, 2011; acceptedJanuary 16, 2012. The associate editor coordinating the review of this paperand approving it for publication was X. Wang.Y. Li, Z. Wang, D. Jin, and L. Zeng are with Tsinghua National Laboratoryfor Information Science and Technology (TNLIST), Department of ElectronicEngineering, Tsinghua University, Beijing 100084, China (e-mail: yongli07@mails.tsinghua.edu.cn, {zcwang, jindp, zenglg}@tsinghua.edu.cn).S. Chen is with Electronics and Computer Science, Faculty of Physicaland Applied Sciences, University of Southampton, Southampton SO17 1BJ,UK (e-mail: sqc@ecs.soton.ac.uk), and with the Faculty of Engineering, KingAbdulaziz University, Jeddah 21589, Saudi Arabia.This work is supported by National Nature Science Foundation of China(No. 61171065, No. 61021001) and Chinese National Major Scientific andTechnological Specialized Project (No. 2010ZX03004-002-02), as well as theProgram for Changjiang Scholars and Innovative Research Team in University(PCSIRT) and TNLIST).Digital Object Identifier 10.1109/TWC.2012.021512.111252wireless infrastructure may be congested, or even damaged indisaster. Consequently, content dissemination through vehicular ad hoc networks is highly desired. Since vehicular networksare highly mobile and sometimes sparse by nature, it is difficult to maintain a connected network to distribute the content[4]. Opportunistic contact between vehicles, by contrast, iscapable of providing high-bandwidth communication capacityfor content dissemination, which is known as opportunisticcollaborative vehicular content dissemination [4].In this letter, we analyze the system performance of opportunistic vehicular content dissemination, where the contentcan be transmitted only when two vehicles come into thecommunication range of each other. Therefore, the vehicularmobility model and the communication range are two of themost important factors that influence the system’s performance. We have collected a large vehicle trace in Beijing,and validate a suitable analytical mobility model based onthis Beijing trace in this study. With regarding the issue oftransmission range, we consider the applicability of directionalantennas that have more than one steerable directional beamto improve the system’s achievable performance. Althoughthere exist some recent works on content dissemination [3],[5], [6] and directional antennas [7]–[9], to the best of ourknowledge, this is the first study on the performance ofthe collaborative content dissemination system under realisticvehicular scenarios using an accurate mobility model anddirectional antennas. Our contributions are as follows. We introduce the Lévy-walk model [10] for the vehicularmobility, and validate this model on the Beijing trace,which is the largest available vehicular mobility GPStrace. This model is used to set up a realistic vehicularmobility environment for the performance evaluation ofcollaborative vehicular content dissemination.We provide a theoretical model to analyze the contentdissemination speed for collaborative vehicular contentdissemination by fluid approximation, and use extensivesimulation results obtained under realistic vehicular settings to validate the accuracy of our model.We evaluate the influence of the directional antenna onthe performance of the vehicular content disseminationsystem by both analytical and simulation results. Ourresults confirm that the directional antenna performsbetter than the omni-directional antenna in our consideredscenario.II. S YSTEM D ESCRIPTION AND M ODELFig. 1 illustrates the concept of collaborative vehicularcontent dissemination, where the goal is to disseminate thec 2012 IEEE1536-1276/12 31.00
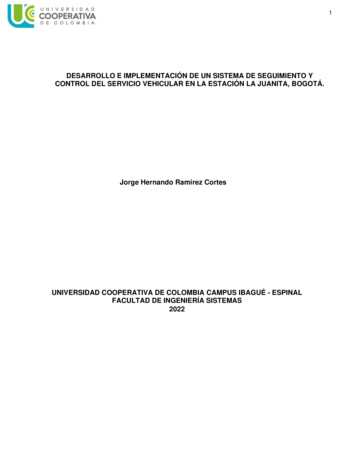
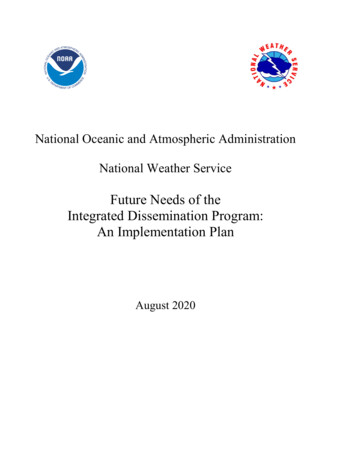
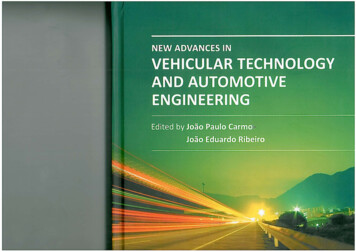
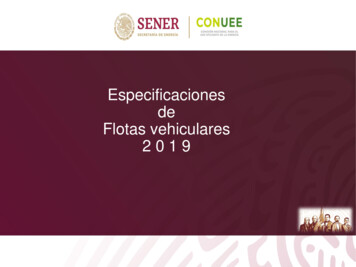
1302IEEE TRANSACTIONS ON WIRELESS COMMUNICATIONS, VOL. 11, NO. 4, APRIL 2012SubscriberHelperEDABOpportunistic ContactFCGFig. 1. System overview of the collaborative vehicular content dissemination.The infrastructure network first transmits the content to some helpers, whichthen disseminate the content to other encountered helpers (solid line) orencountered subscribers (dashed line) through opportunistic communication.content to a group of subscribers through opportunistic communication. As not all the nodes are willing to participate inthe content dissemination, there exist two types of vehiclenodes in the system, known as helpers and subscribers.Helpers are willing to buffer the content in their storages, andto further transmit the content to other helpers or subscribers.Subscribers are only interested in receiving the content andwill not transmit the content to other nodes. Nodes areequipped with omni-directional or directional antennas totransmit or receive packets of content. At the beginning, asmall number of helpers will obtain the content from thecontent source. Content dissemination may be split into twophases, namely, the disseminating phase, during which thecontent is transmitted among the helpers, and the receivingphase, when a subscriber finally receives the required contentfrom a helper. Considering Fig. 1 again, in the disseminatingphase, helper A transmits the content to helpers B and Cby opportunistic contact. Helpers B and C, after received thedata from A, will carry and forward the data to other helpersor subscribers later. In the receiving phase, subscribers D, Eand F receive the packet from helper A, while subscriber Greceives the packet from helper B.Fig. 2.Comparison of the empirical flight-length distribution extractedfrom Beijing trace with the fitted log-normal, exponential and upper-truncatedPareto distributions.Fig. 3. Comparison of the empirical pause-time distribution extracted fromBeijing trace with the fitted log-normal, exponential and upper-truncatedPareto distributions.A. Vehicular MobilityExisting mobility models, such as random walk and randomwaypoint, cannot realistically represent the collaborative vehicular content dissemination system, where wireless devicesare attached to vehicles and vehicular mobility patterns influence the system performance significantly. Let us considerthe 2-dimensional vehicular mobility defined by a sequence ofsteps that a vehicle travels [11]. A step is denoted by a tetrad(l, φ, v, τ ) during which a vehicle travels a flight followed bya pause, where l 0 is the flight length, φ is the directionof the flight, v is the mobility velocity, and τ is the timeduration of pause called pause time. Thus, step n is definedby (ln , φn , vn , τn ). Assume that the vehicle starts its first stepat time t 0. It chooses a direction φ1 randomly from theuniform distribution in the range [0, 360 ] and has a uniformlydistributed velocity v1 , as well as chooses a flight length l1 anda pause time τ1 according to certain probability distributions.Consequently, in step 1, the vehicle moves the flight of thelength l1 at the direction φ1 with the velocity v1 . It thenstops for the pause time τ1 during which the vehicle staysat the location where the current flight ends. After the pause,it chooses another step, and the process repeats. Clearly, theaccuracy of a vehicular mobility model is determined by theaccuracy of the distributions for flight length l and pause timeτ.We use the largest available real vehicular trace, the Beijingtrace which we collected ourselves, to study the distributionsof flight length and pause time by curve fitting techniques,which is widely used in the mobility modelling practice [11]–[13]. This trace contains the mobility track logs obtained from27000 participating taxis carrying GPS receivers during thewhole May month in 2010 [12]. To obtain this trace, weutilized the GPS devices to collect the taxi locations andtimestamps and GPRS modules to report the records every oneminute for moving taxis. Based on the Beijing trace, we utilizethe angular model of [11] to extract the data of flight lengthand pause time, and subsequently to study the distributions of
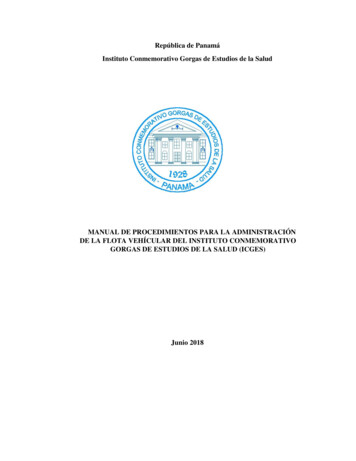
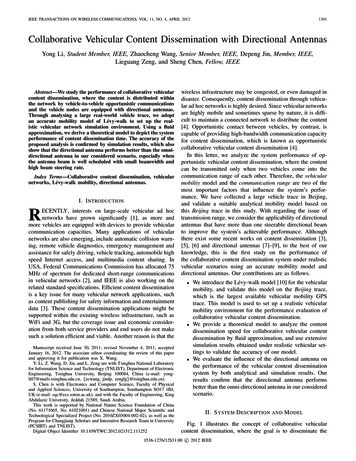
LI et al.: COLLABORATIVE VEHICULAR CONTENT DISSEMINATION WITH DIRECTIONAL ANTENNASflight length and pause time, preliminary results of which arereported in our previous work [12]. Fig. 2 shows the empiricalcomplementary cumulative distribution function (CCDF) offlight length, where we also applied the maximum likelihoodestimation to fit three known distributions, the exponential,log-normal and truncated Pareto [14] distributions, to the data.We observe that the truncated Pareto has the best fit to the empirical CCDF among the three distributions. Similarly, Fig. 3compares the empirical CCDF of the pause time extractedfrom the trace with the three fitted known distributions, whereit can again be seen that the truncated Pareto distributionprovides the best fit to the empirical pause-time distribution.More specifically, the MSE between the empirical distributionand the truncated Pareto distributed flight length is 17.2%,while the MSE for the truncated Pareto distributed pause timeis 15.5%. In comparison, for example, for the exponentialdistribution, the MSE values are 34.9% and 318.3% for theflight length and pause time, respectively. This experimentsuggests that both the pause time and flight length follow thetruncated Pareto distribution. Therefore, we will use the Lévywalk [10] to model the vehicle mobility. Note that the existingwork [11] has also validated that the Lévy walk can accuratemodel the human mobility by demonstrating that the truncatedPareto distribution can also fit the flight length and pause timeof human mobility very well.In summary, in our vehicular mobility model, the directionand velocity follow the uniform distributions, while the Lévywalk model selects the flight length and pause time randomlyfpfand ξmaxfor l and ξminandwith the truncation factors ξminpξmaxfor τ , respectively, according to the Lévy distributionwith the exponent parameter ε, whose characteristic functionis defined by ε1e j x z c z d z,(1)f (x) 2π where j 1 and c is a scaling coefficient. Specifically,the initial location of each vehicle is randomly chosen froma uniform distribution in the defined area. At step n, thetetrad (ln , φn , vn , τn ) is generated randomly according to thecorresponding distributions. If the drawn duplet (ln , τn ) doesfnot pass the truncation checking, that is, ln ξmin, orpfpτn ξmin , or ln ξmax or τn ξmax , then it is discardedand another duplet is regenerated. This procedure is repeateduntil the mobility pattern of the whole network is obtained.B. Antenna OrientationThe antenna dynamics of node i are denoted by a dupletAi (ϑi (t), θi (t)), where the antenna orientation ϑi (t) isrelated to the beam steering direction, while the antennabeamwidth θi (t) is related to the antenna patterns. Both thebeam steering and antenna patterns can change according tothe system requirements. However, there are practical limitations in directional antenna implementation, and hence wemodel the antenna under realistic settings [7]. The beamwidthθi is chosen from the set {15 , 30 , 45 , 60 , 90 , 180 }.Given a θi , there are 720/θi 1 beam patterns, one foromni-directional beam and 720/θi for directional beams, eachwith an approximately (θi ) half-power beamwidth. Each1303directional beam is overlapping with the next beam and rotatedby (θi /2) to the next, and all the 720/θi beams cover the360 circle. We use an extensively used approximate model[9] for the antenna gain. Given the beamwidth θi , the mainlobe gain, denoted by gm , is defined asgm (θi ) 4,tan2 (θi /2)(2)where gm is obtained as the maximum beamwidth with noenergy leakage. As the antenna direction changing is oftencaused by the upper layer traffic or packet sending requests,whose rate is usually modelled by the Poisson process, weassume that the antenna orientation ϑi changes its directionfollowing the Poisson process with rate rϑ . If rϑ 0, theantenna orientation never changes. We define three policies forthe beam steering: random steering (RS), circle steering (CS)and polling steering (PS). In RS, nodes randomly choose newbeams from the feasible set of antenna patterns when Poissonchanging events occur. CS chooses the next beam which isnot overlapped with the current beams clockwise, while PSselects the next beam which is overlapped with the currentbeams clockwise. Since helpers need to transmit the contentto as many as possible subscribers, it is better for a helperto transmit the content in all directions by using an omnidirectional antenna. By contrast, a subscriber needs to receivethe content from one of the helpers. Therefore, it can use adirectional antenna to point to one of the helpers, or it may stilluse an omni-directional antenna. In our study, we investigatewhether a directional or an omni-directional antenna is morebeneficial in this context.C. Content TransmissionWhen the content transmission occurs is decided by thephysical propagation model. For any node, we can use thetriplet S(t) (x(t), ϑ(t), θ(t)) to represent its state at timet, where x(t) is the node’s position which is determined bythe mobility model, ϑ(t) and θ(t) are the antenna orientationand beamwidth, respectively. Suppose that, at time t, vehiclei has the state Si (xi , ϑi , θi ), that is, the vehicle is at theposition xi and its antenna is pointing in the direction ϑiwith the beanwidth θi , while another vehicle j has the stateSj (xj , ϑj , θj ). Imagine that i is a helper which has alreadyobtained the content, while j is either a helper or subscriberwithout the content. The content transmission from i to j willhappen only when node j can capture the signal sent by nodei with a power above a certain threshold denoted by ψ. Invehicular opportunistic networks, nodes are usually sparse and,furthermore, no end-to-end path exits between nodes. Fromthis viewpoint, the free space path model may be adequatefor the physical communication channel [9]. Therefore, ourpropagation model uses the following equation [9] to computethe received powerPr (Si , Sj ) Pt · λ2 · d2ref · Gt (Ai , xi , xj ) · Gr (Aj , xi , xj )4π 2 · xi xj 4,(3)where Pt and Pr are the transmit and receive powers, respectively, λ is the wavelength, Gt and Gr are the gains ofthe transmit and receive antennas, respectively, while dref is
1304IEEE TRANSACTIONS ON WIRELESS COMMUNICATIONS, VOL. 11, NO. 4, APRIL 2012a reference distance given by ddef 2D/λ2 with D beingthe maximum antenna dimension. The gains Gt (Ai , xi , xj )and Gr (Aj , xi , xj ) depend on the antenna patterns and therelative positions of two nodes. Recalling the definition of gmin (2), the expression for Gt is given by gm , ϑi · Δxij cos(θi /2),(4)Gt (Ai , xi , xj ) 0, ϑj · Δxij cos(θj /2),Based on the mean field theory [17], the equations (5) and(6) correspond to the random node mixing assumption and areasymptotically valid when the number of nodes in the systemζ ϕh h(t)is large. Combining (5) and (6) yields dh(t)ds(t) η ϕs s(t) ,which leads toϕs s0(ϕh h(t))η/ζ ,(7)s(t) ϕs η/ζ(ϕh h0 )where Δxij xi xj . The expression for Gr (Aj , xi , xj )is similar. If Pr (Si , Sj ) ψ, node j can receive the contentfrom node i.where s0 s(0) and h0 h(0). We now solve (5) to obtainh(t) explicitly. Note that 1111 .(ϕh h(t))h(t)ϕh ϕh h(t) h(t)III. F LUID A PPROXIMATION -BASED D ISSEMINATIONT IMETherefore, from (5) we haveexplicitly yieldsWe note that when a helper with the content contactswith other nodes without the content, it will disseminate thecontent. The status of whether a node has the content in theopportunistic vehicular network can be viewed as a stochasticprocess that is controlled by opportunistic contact events.Consequently, the content dissemination is a complicatedstochastic process consisting of a large number of componentprocesses. We employ a fluid approximation model [15] toanalyze this highly complex content dissemination system.It is well known that the fluid approximation is incapableof describing the dynamics of this stochastic system [15].However, it allows us to replace this stochastic process by“joining” all the nodes to form a deterministic process, andthe result obtained by this approximation is known to be closeto that of the underlying stochastic process in the expectationsense.The content dissemination process starts at time t 0 whensome helpers obtained the content from the source. A nodewith the content is called an infected node. Assume that thetotal number of vehicles in the system is N and, furthermore,there are H helpers and S subscribers. Then, the fraction ofthe helpers, denoted by ϕh , is ϕh H/N , while the fractionof the subscribers, denoted by ϕs , is ϕs S/N . Define h(t) Nh (t)/N as the proportion of the helpers that have receivedthe content at time t, where Nh (t) is the number of infectedhelpers at t. Similarly, let s(t) Ns (t)/N be the proportionof the subscribers that have received the content at time t,where Ns (t) is the number of infected subscribers at t. Thefluid approximation describes the dynamics of the system bythe following ordinary differential equations:dh(t) ζ(ϕh h(t))h(t),dtds(t) η(ϕs s(t))h(t),dt(5)(6)where ζ is the contact rate between helpers, while η isthe contact rate between a helper and a subscriber. Thesecontact rates depend upon node mobility speeds and antennapropagation characteristics, and are proportional to the newarea covered per unit time [16]. Under the omni-directionalantenna, the contact rate is proportional to πRv, where R is thecommunication range and v the node mobility velocity [16].In the directional-antenna case, the contact rate also dependson the beamwidth and beam steering rate.h(t) dh(t)ϕh h(t) dh(t)h(t) ϕh ζdt, whichϕh h0.h0 (ϕh h0 ) e ϕh ζtBy substituting (8) into (7), we explicitly obtain η/ζϕh h0,s(t) ϕs ϕh h0 (ϕh h0 ) e ϕh ζt(8)(9) η/ζ. Define Tω as the time atwhere (ϕs s0 ) (ϕh h0 )which the proportion (1 ω) of the subscribers have receivedthe content. In other words, only the proportion ε of thesubscribers have not yet received the content at time Tω .We refer to Tω as the dissemination time, which depicts thecontent dissemination speed, and we use it as a metric of thesystem performance. From the definition of the disseminationtime, we have ϕs (1 ω) s(Tω ). According to (9), we ζ/ηβh0ϕs ωobtain e ϕh ζTω (ϕh β)(ϕ,whereβ .ϕs s0h h0 )Therefore, (ϕ β) (ϕ h ) 1hh0.(10)lnTω ϕh ζβh0IV. N UMERICAL R ESULTSThe simulated system covered an area of 2000 2000 m2with time steps n 60 60 2. We randomly used 70%of the network nodes as subscribers, and the remaining 30%as helpers. The content source randomly selected 10% ofthe helpers and disseminated the data to them at t 0.The vehicular mobility of Subsection II-A was adopted, inwhich φn obeyed the uniform distribution in [0, 360 ), and vnfollowed the uniform distribution in [8, 15] m/s, while ln wasfgenerated according to (1) with ε 1.5, c 2.5, ξmin 5mfand ξmax 1000 m, and tn also obeyed the Lévy walk (1)ppwith ε 1.5, c 2.5, ξmin 30 s and ξmax 600 s.All the antennas, whether omni-directional or directional, hadthe same transmit power. We set the antenna gain to let thecommunication range of two omni-directional antennas being60 m, and calculated the gain and communication range ofdirectional antennas according to (3) and (4). In order toobtain credible and reliable results, we simulated the systemwith the specific settings of node mobility and antenna 100times to obtain the simulated content dissemination time Tω ,given ω 0.1. Then, we plotted the simulation results byaveraging over these 100 different runs as well as plottedtheir corresponding confidence intervals in all the figures.
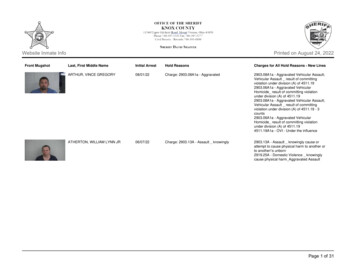
LI et al.: COLLABORATIVE VEHICULAR CONTENT DISSEMINATION WITH DIRECTIONAL ANTENNAS10002000T , Random Steering 800T* , Polling Steeing700T , Polling Steeing600 T* ,500T , Circle SteeringCircle Steering 400300200Content Dissemination TimeContent Dissemination Time*T , Random Steering90010001001305* T , r 101800T , r 10 1600T* , r 251400T , r 25 1200 T* , r 40 1000T , r 40 8006004002001502002503003504004500100500Number of NodesFig. 4. Content dissemination time as function of the number of nodes forthree beem steering policies with beamwidth θ 45 and beam steeringrate rϑ 20, where dashed curves are the fluid model based results givenby (10), while solid curves are the simulation results with the vertical barsindicating the standard deviation.150200250300350400450500Number of NodesFig. 5. Content dissemination time as function of the number of nodesfor different beam steering rates rϑ with beamwidth θ 45 and randomsteering, where dashed curves are the fluid model based results given by (10),while solid curves are the simulation results with the vertical bars indicatingthe standard deviation.3500T* , N 100Content Dissemination Time By extracting the contact rates ζ and η, we also calculatedthe theoretical content dissemination time Tω using (10).This enabled us to investigate the accuracy of our proposedmodel for content dissemination time by comparing Tω andTω . Furthermore, we analyzed how the directional antennaswith different beam steering policies, beam steering rates andbeamwidths influence the system performance.The content dissemination times of three beam steeringpolicies as function of the number of nodes are shown inFig. 4, where the simulation results are averaged over 100runs. As the number of nodes N increases, the contentdissemination time Tω decreases. The reason is obvious. Alarger N means a higher node density, since the system areais constant, which in turn leads to more opportunistic contactsto disseminate the content. The RS policy needs the longesttime to disseminate the content, while the CS policy achievesthe shortest data dissemination time, under the same settingsof nodes and antenna beams. Specifically, the CS reducesthe content dissemination time by 51% and 32%, comparedwith the RS, for N 100 and 500, respectively. This resultshows that if we schedule the beam steering, rather thanrandom steering, significant performance enhancement can beachieved. The performance enhancement of the CS policyover the PS policy is about 23% to 2%. Thus, in the beamscheduling, better system performance can be achieved bychanging the beam to let the antenna swap more area and avoidoverlapping the already covered area. It can be seen that, in thedirectional antenna based opportunistic content disseminationsystem, designing an appropriate beam scheduling algorithm isimportant. From Fig. 4, we can see that the theoretical resultsof Tω are very close to the simulation results of Tω , whichvalidates the accuracy of our content dissemination model(10).Next, we studied the influence of beam steering rate rϑunder the RS policy with a fixed beamwidth θ 45 , and theresults obtained are shown in Fig. 5. Again, the simulationresults Tω agree with the theoretical ones Tω , and similarobservations to those for Fig. 4 can be drawn regarding theT , N 1003000T* , N 150 2500T , N 150T* , N 2002000 T , N 20015001000500050100150200250300350Beamwidth (o)Fig. 6. Content dissemination time as function of the beamwidth varyingfrom 15 to 360 for different numbers of system nodes with rϑ 10 andrandom steering, where dashed curves are the fluid model based results givenby (10), while solid curves are the simulation results with the vertical barsindicating the standard deviation.number of nodes. As the beam steering rate increases, thecontent dissemination time reduces significantly. For example,the dissemination time for rϑ 40 is only 30% and 50% ofthose with rϑ 10 and rϑ 25, respectively. However, itshould be pointed out that the beam steering rate is limitedby real-system antenna implementation, and the performanceenhancement is obtained at the cost of energy leakage.The results of content dissemination time as function ofbeamwidth are shown in Fig. 6. When the beamwidth θ 360o , the antenna is omni-directional. From Fig. 6, it canbe seen that the direction antenna offers superior systemperformance over the omni-directional one. Moreover, as thebeamwidth is reduced, the content dissemination time is alsoreduced. In other words, the smaller the beamwidth, the largerthe achievable performance enhancement. The reason is thatthe transmission range is enlarged by reducing the beamwidth,and the beam is steered to enable the nodes cover morenew area which in turn creates more communication contacts.Thus, the content is distributed more efficiently.
1306IEEE TRANSACTIONS ON WIRELESS COMMUNICATIONS, VOL. 11, NO. 4, APRIL 2012V. C ONCLUSIONSWe have analyzed the performance of collaborative vehicular content dissemination with the aid of directional antennas.Our contributions include validating the Lévy-walk modelfor vehicular mobility and deriving a fluid approximation forstudying the collaborative vehicular content dissemination system. We have shown that, with the aid of directional antennas,the content propagation speed is accelerated, compared withomni-directional antennas. Simulation results have confirmedthe accuracy of our proposed model. Our ongoing work isfurther investigating beam scheduling algorithms as well asthe beamwidth and steering rate control problem in morecomplicated and realistic scenarios to fundamentally revealthe benefit or loss of directional antennas for general mobilewireless networking.R EFERENCES[1] M. Khabazian, S. Aissa, and M. Mehmet-Ali, “Performance modelingof message dissemination in vehicular ad hoc networks with priority,”IEEE J. Sel. Areas Commun., vol. 29, no. 1, pp. 61–71, Jan. 2011.[2] J. Zhao and G. Cao, “VADD: vehicle-assisted data delivery in vehicularad hoc networks,” in Proc. 2006 IEEE INFOCOM, pp. 1–12.[3] M. Johnson, L. De Nardis, and K. Ramchandran, “Collaborative contentdistribution for vehicular ad hoc networks,” in Proc. 2006 Allerton Conf.Communication, Control, and Computing, pp. 751–760.[4] D. Câmara, N. Frangiadakis, F. Filali, and C. Bonnet, “Vehicular delaytolerant networks,” in Handbook of Research on Mobility and Computing: Evolving Technologies and Ubiquitous Impacts, M. M. Cruz-Cunhaand F. Moreira, editors. IGI Global, 2011, pp. 356–367.[5] W. Gao and G. Cao, “User-centric data dissemination in disruptiontolerant networks,” in Proc. 2011 IEEE INFOCOM, pp. 3119–3127.[6] J. Reich and A. Chaintreau, “The age of impatience: optimal replicationschemes for opportunistic networks,” in Proc. 2009 ACM Int. Conf.Emerging Networking Experiments and Technologies, pp. 85–96.[7] V. Navda, A. P. Subramanian, K. Dhanasekaran, A. Timm-Giel, andS. R. Das, “MobiSteer: using steerable beam directional antenna forvehicular network access,” in Proc. 2007 Int. Conf. Mobile Systems,Applications and Services, pp. 192–205.[8] F. Peruani, A. Maiti, S. Sadhu, H. Chat, R. R. Choudhury, and N. Ganguly, “Modeling broadcasting using omnidirectional and directionalantenna in delay tolerant networks as an epidemic dynamics,” IEEEJ. Sel. Areas Commun., vol. 28, no. 4, pp. 524–531, May 2010.[9] R. Ramanathan, “On the performance of ad hoc networks with beamforming antennas,” in Proc. 2001 ACM Int. Symp. Mobile Ad HocNetworking & Computing, pp. 95–105.[10] N. Mantegna, “Lévy walks and enhanced diffusion in Milan stock exchange,” Physica A: Statistical Mechanics and its Applications, vol. 179,no. 2, pp. 232–242, Dec. 1991.[11] K. Lee, S. Hong, S. J. Kim, I. Rhee, and S. Chong, “SLAW: a newmobility model for human walks,” in Proc. 2009 IEEE INFOCOM,pp. 855–863.[12] Y. Cao, Y. Li, J. Zhou, D. Jin, L. Su, and L. Zeng, “Recognizing theLevy-walk Nature
WiFi and 3G, but the coverage issue and economic consider- . Digital Object Identifier 10.1109/TWC.2012.021512.111252 wireless infrastructure may be congested, or even damaged in disaster. Consequently, content dissemination through vehicu- . This model is used to set up a realistic vehicular mobility environment for the performance .