Transcription
EuroVis Workshop on Visual Analytics (2012)K. Matkovic and G. Santucci (Editors)Graph Visualization Using Hierarchical Edge Routing andBundlingW. Kienreich1 , R. Wozelka1 , V. Sabol1 and C. Seifert1,21 Know-Center2 KnowledgeGraz, AustriaManagement Institute, TU Graz, AustriaAbstractDriven by rapidly growing application areas such as semantic knowledge bases and social networks, visualizationof large graphs has been gaining importance recently. A large amount of nodes and intersecting edges presents amajor challenge for usability and aesthetics, and may also pose a scalability problem. Edge routing and bundlingmethods proved useful for reducing clutter, while hierarchical techniques, besides providing the basis for level ofdetail rendering, also address scalability. We present work in progress which combines hierarchical techniqueswith edge routing and bundling methods, and utilizes their respective advantages. The proposed graph visualization method employs hierarchical aggregation of graph nodes and edges, and applies edge routing and bundlingalong the hierarchy to reduce clutter and improve the clarity of the representation.Categories and Subject Descriptors (according to ACM CCS):Generation—Line and curve generation1. IntroductionVisualization techniques offer means for exploratory navigation and analysis of relationships present in graph data.Visual approaches are particularly useful when the user, possibly without having clearly defined objectives, seeks to gaininsight into an unfamiliar graph data set. As a consequence,tools and methods for visual analysis of large graphs arebecoming increasingly common in various application domains, prominent examples being semantic knowledge bases(see [ASJC11]) and social networks (see [SMER06]). Different authors, such as Bennet et al. [BRSG07] and Becket al. [BBD09], support the position that consideration ofaesthetic properties of graph layouts promises to improvethe readability of the visual representation. Large number ofnodes and edges are a source of usability and aesthetic problems which are caused by clutter arising from intersectingand overlapping links. Another issue related to large graphsis the scalability of the visualization, which is limited by thenumber of visual items that can be simultaneously displayed- a problem affecting mobile devices with small screens andWeb-based clients with limited computing power.In this paper we present work in progress which primarilyaddresses the problem of clutter, but also provides means forc The Eurographics Association 2012.I.3.3 [Computer Graphics]: Picture/Imagedealing with scalability issues. We propose a novel graph visualization method which utilizes hierarchical aggregationof graph data. Nodes and edges are aggregated to metanodes and meta-edges, providing a level of detail capablerendering and navigation. For reduction of clutter we introduce two hierarchical approaches. The first method extends the “flat” Voronoi-based edge routing technique introduced by Lambert et al. [LBA10] with a strategy for routingedges along a hierarchy of nested Voronoi areas. The secondmethod builds upon the idea of force-directed edge bundlingby Holten et al. [Hv09] and applies it on the hierarchicallyorganized graph data set. Respective advantages of the hierarchical routing and bundling methods are compared andcontrasted with flat, non-hierarchical representations.2. Related WorkGraph visualization is a broad area of research where alarge number of different approaches, each addressing particular requirements, have been developed (cf. [HMM00]).Visualizations of graphs consisting of a larger number ofnodes and edges often employ clutter reduction techniquesto address issues with usability and visual appearance.Edge bundling and edge routing methods have been suc-
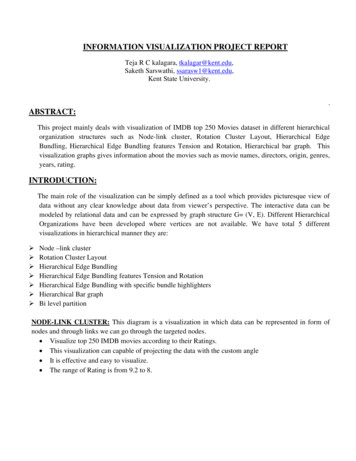
W. Kienreich & R. Wozelka & V. Sabol & C. Seifert / Graph Visualization Using Hierarchical Edge Routing and Bundlingcessfully applied as clutter reduction techniques. Cui etal. [CZQ 08] proposes a geometry-based method for clustering edges into bundles, which employs control meshes toguide the bundling process. Holten [Hol06] introduces anedge bundling method utilizing hierarchical graph organization, and later describes a “self-organised” force-directededge bundling method which does not require a control meshor a hierarchy et al. [Hv09]. Kienreich et al. [KS10] presentsa force-directed edge bundling algorithm, which accountsfor semantic properties of edges. An edge routing algorithmrecently introduced by Lambert et al. [LBA10] utilizes quadtrees and Voronoi diagrams to avoid node-edge overlaps.Hierarchical aggregation of graph nodes and edges using graph clustering methods (see [Sch07, AW10]) to address both scalability as well as usability and aesthetic aspects is not a new idea (cf. [Fen97]). Eades et al. [EH00]and Abello et al. [AvHK06] create a hierarchy of supernodes using graph clustering. The subsequent layout is calculated by traversing the hierarchy and positioning childnodes with a force-directed placement (FDP) algorithm etal. [FR91], which scales poorly but is known to produce visually pleasing layouts. As FDP is each time applied on onlya small number of child-nodes, very large graphs can be visualized in an effective manner. The graph is navigated byexpanding only branches which are of interest to the user,which aids clarity and reduces rendering costs. Bourquoi etal. [BAM07] take this idea a step further by assigning dedicated polygonal areas to clusters using Voronoi area subdivision, with the goal of reducing overlap.Existing approaches employ either hierarchical aggregation or edge routing and bundling, while our method combines the advantages of both.3. Hierarchical Approachthe node layout. The edges are then routed along the shortest paths in the grid. For edge bundling, the node positionsand the edge information are sufficient (i.e. the grid is notused). The steps of our method are described into detail insections 3.1 to 3.5.Hierarchy GenerationNode LayoutEdge AggregationGrid GenerationEdge BundlingEdge RoutingFigure 1: Process overview3.1. Node LayoutNode and meta-node positions are computed by a recursive algorithm [MSG10] which traverses the hierarchy in atop-down manner: First, the top-level meta-nodes are positioned using the LinLog layout algorithm [Noa07] producing a layout where strongly interconnected meta-nodes areplaced close to each other. Then, each meta-node is assigneda polygonal area using Voronoi area subdivision [Aur91].Meta-nodes are repositioned to the centre of mass of theVoronoi region, so that very close points are moved awayfrom each other and more space for routed edges is created.The method proceeds recursively by placing children withintheir parent’s area and assigning each child its own Voronoipolygon. Recursion stops when the bottom of the hierarchyis reached and the original nodes are laid out and assignedVoronoi regions.The steps of the overall hierarchical edge routing andbundling approach are depicted in figure 1. Our method requires that graph nodes are structured in a hierarchy (tree),which aggregates nodes into meta-nodes (also called clusters). The hierarchy serves three purposes: (i) fast recursivelayout using FDP and Voronoi area subdivision, (ii) aggregating edges over the hierarchy, and (iii) level of detail rendering. Usually, the hierarchy is not given a-priori and needsto be generated. In principle, there are two different methods for constructing the hierarchy: graph clustering and, forsemantic data, hierarchy extraction along semantic relations.Figure 2: Edge aggregation: Inter-cluster edges (red) areaggregated to meta-edges (blue) on the parent level.Graph nodes are laid out by traversing the hierarchy fromtop to bottom and positioning children on each hierarchylevel. In the same step a Voronoi area subdivision is computed using layout positions as control points. Then, edgesare aggregated into meta-edges by traversing the hierarchybottom-up and summarizing edges from children in theirparent nodes. For edge routing, a grid is calculated basedon the hierarchically nested Voronoi areas computed duringFor the hierarchical edge bundling and routing, information on inter-cluster edges (i.e. edges connecting nodeswhich are not direct siblings in the hierarchy), is propagatedfrom the leaf-nodes to the parent meta-node. The meta-edgepropagates upwards until it connects two sibling meta-nodes(i.e. until it becomes an inner-cluster edge). Figure 2 showsthis principle of edge aggregation. The red (leaf) nodes and3.2. Edge er-clusteredgec The Eurographics Association 2012.
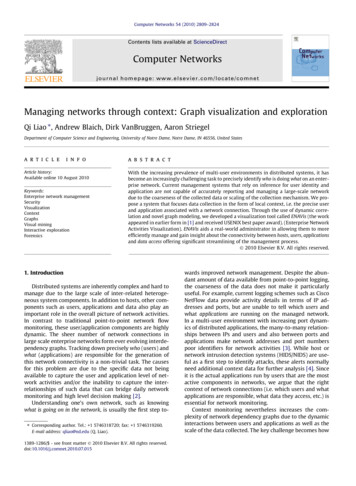
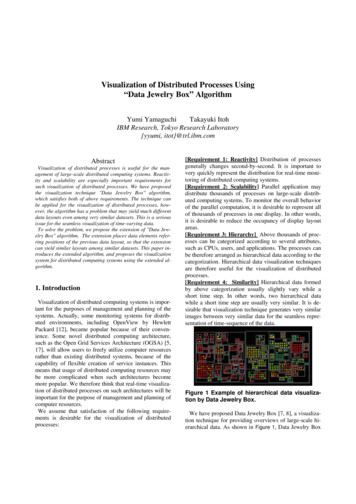
W. Kienreich & R. Wozelka & V. Sabol & C. Seifert / Graph Visualization Using Hierarchical Edge Routing and Bundlingthe red edges represent the original graph. Black nodes andedges represent the imposed hierarchy. Inter-cluster edgesare aggregated and represented by a meta-edge (blue) on theparent level of the hierarchy. The weight of the aggregatedmeta-edge is either set to the number of aggregated edges orto the sum of their weights (in case of a weighted graph).is expanded. The meta-edge from cluster 1 (blue) is routedonly up to the Voronoi boundary of cluster 2, and then itfans out to original edges (red), which are routed on the local grid of cluster 2. Note, that the edge to node 4 is againrouted along the Voronoi boundary of node 5 and 6 and onlyat the boundary of its own region it is allowed to enter thelocal grid.3.3. Grid GenerationBasically, the Voronoi polygons constructed in the node layout step (see section 3.1) are used for routing the edges. Additionally to the nodes of the Voronoi polygons, we add apoint for each Voronoi edge which divides the edge in half.These points connect to the node (or meta-node) within thecorresponding Voronoi area, forming the node’s “local grid”.The local grid is only considered for routing edges betweena node and the boundary of its Voronoi polygon (which ispart of the Voronoi grid of its parent). Figure 3 (left) showsa simple example grid, where the nodes are positioned in aregular pattern and thus the Voronoi subdivision consists ofrectangular areas. The edges inside the area of node 1 andnode 2 are only visible for routing to node 1 and node 2 respectively (local grid).3456211Figure 3: Edge routing. Left: aggregated edge from cluster1 to cluster 2. Right: expanded cluster 2, meta-edge is drawnfrom cluster 1 to the nearest routing point of cluster 2, insidecluster 2 original edges are drawn.3.4. Edge RoutingThe edge routing step uses the meta-edges and the grid constructed in the previous steps and proceeds along the hierarchy in a top-down manner. The edges or meta-edges oneach hierarchy level are routed along the grid edges using Dijkstra’s shortest path algorithm, similar to Lambert etal. [LBA10]. A simple example, with start and end nodes ofthe edge being on the same hierarchy level, is shown in figure 3 (left). The routing is done in three steps. First, the edgeis routed from the start node to the parent’s Voronoi boundary using the local grid. Second, the edge is routed towardsthe Voronoi boundary of the end node along the Voronoiboundaries of the sibling nodes (i.e. using the grid at the hierarchy level). Third, starting from the Voronoi boundary ofthe end node the edge is routed along the local grid. An example demonstrating the resulting edge route over multiplehierarchy levels is shown in figure 3 (right) where cluster 2c The Eurographics Association 2012.3.5. Edge BundlingEdges are bundled using force-directed edge bundling introduced by Holten et al. [Hv09]. However, the large number of inter-cluster edges will not be bundled and renderedindividually, because they have been hierarchically aggregated to a smaller number of inner-cluster meta-edges. In ourapproach, on each hierarchy level only these inner-cluster(meta-)edges (i.e. those between nodes having the same parent) are bundled together and rendered reducing the amountof clutter on screen. In other words, edge bundling is alwaysperformed locally within the parent cluster.4. DiscussionFigure 4 shows our edge routing and edge bundling approach on a subset of approximately 3000 documents of theReuters RCV document collection [LYRL04]. The hierarchy was created using the hierarchical clustering algorithmdescribed by Muhr et al. [MSG10] yielding a cluster tree ofdepth 4. We generated graph data by treating documents asnodes and document similarities as weights of graph edges.Edges with lowest weights were pruned so that a) every nodeis connected by a least 1 edge, b) no node has more than10 edges. The resulting graph is composed of approximately3000 nodes and 20000 edges.In figure 4 on left, the non-hierarchical edge routing(top) and edge bundling (bottom) are shown. Obviously,the large number of displayed nodes and edges causes clutter, whereby the problem is far more pronounced with edgebundling. In the centre of figure 4, top-level meta-nodes(cloud-icons) and aggregated meta-edges (blue) connectingthem can be seen. In our opinion, edge bundling appearsmore suitable for providing an overview, because it makes iteasier to follow the propagation of edges compared to edgerouting, which conveys meta-edge weight through colour intensity but exhibits high edge overlap.The user can navigate the hierarchy from top to bottom byexpanding the cluster hierarchy and unveiling more detailedstructures of the graph, which is demonstrated by screenshots on the right-hand side of figure 4. Note that, in contrastto non-hierarchical layouts, only the part of the graph whichis of interest to the user is shown in detail, thus increasingthe overall clarity. Another advantage of the hierarchical approach is that far less edges and nodes are rendered, makingit more suitable for devices with small screens and limitedcomputing power.
W. Kienreich & R. Wozelka & V. Sabol & C. Seifert / Graph Visualization Using Hierarchical Edge Routing and BundlingFigure 4: Edge routing (top row) and bundling (bottom row) examples for a graph consisting of approximately 3000 nodes and20000 edges. Red edges represent original edges of the graph, blue edges are meta-edges. First column: no hierarchy. Secondcolumn: routing and bundling using the hierarchy. Third column: greater level of detail for selected hierarchy branches.Comparing edge routing with edge bundling with moredetails shown, we conclude that routing is superior in termsof clarity. Comparing regions with original nodes (rectangles) and edges (in red) one sees that edge bundling introduces significantly more clutter than edge routing.5. Conclusion and Future WorkWe presented a graph visualization method which extendsexisting methods for edge bundling and routing to hierarchically aggregated graphs, resulting in reduced clutter, improved clarity of the representation and potentially betterscalability on small (mobile) devices.In the future we will focus on supporting interactive analytical tasks, such as in Wong et al. [WMC 09], and performuser tests to evaluate the effectiveness of our approach andcompare it to other methods. To address the issue of ambiguity of aggregated meta-edges we plan to introduce andevaluate user interaction features, such as mouse-over highlighting of individual edges within the hierarchy of metaedges. Further, we will introduce spline-based edge rendering, which will solve the problem of overlapping edges be-longing to adjacent clusters routed along a common Voronoiboundary. As another approach to tackle edge overlap weplan to reserve dedicated space along cluster Voronoi boundaries to prevent cluster-local edges from obscuring metaedges passing through.In principle, our current design (implemented in Java)supports visualizations of large graphs on thin clients. Thus,we will implement a client-server solution, where the layouting is performed on the server, while the HTML5-basedthin client is only responsible for dynamically loading andrendering parts of the hierarchically structured graph layout.Furthermore, we are currently evaluating the scalability ofgraph clustering methods for the hierarchy generation step,in order to scale the layouting algorithm to very large datasets.Acknowledgement: The Know-Center is funded within the Austrian COMET Program under the auspices of the Austrian Ministryof Transport, Innovation and Technology, the Austrian Ministry ofEconomics and Labor and by the State of Styria. COMET is managed by the Austrian Research Promotion Agency FFG.c The Eurographics Association 2012.
W. Kienreich & R. Wozelka & V. Sabol & C. Seifert / Graph Visualization Using Hierarchical Edge Routing and BundlingReferences[ASJC11] A L -S AFFAR S., J OSLYN C., C HAPPELL A.: Structurediscovery in large semantic graphs using extant ontological scaling and descriptive semantics. In Web Intelligence and IntelligentAgent Technology (WI-IAT), 2011 IEEE/WIC/ACM InternationalConference on (aug. 2011), vol. 1, pp. 211 –218. 1[Aur91] AURENHAMMER F.: Voronoi diagrams – survey of afundamental geometric data structure. ACM Comput. Surv. 23(September 1991), 345–405. 2[AvHK06] A BELLO J., VAN H AM F., K RISHNAN N.: Askgraphview: A large scale graph visualization system. Visualization and Computer Graphics, IEEE Transactions on 12, 5 (sept.oct. 2006), 669 –676. 2[AW10] AGGARWAL C. C., WANG H.: A survey of clustering algorithms for graph data. In Managing and Mining Graph Data,Aggarwal C. C., Wang H., Elmagarmid A. K., (Eds.), vol. 40 ofThe Kluwer International Series on Advances in Database Systems. Springer US, 2010, pp. 275–301. 2[BAM07] B OURQUI R., AUBER D., M ARY P.: How to drawclustered weighted graphs using a multilevel force-directed graphdrawing algorithm. In Information Visualization, 2007. IV ’07.11th International Conference (july 2007), pp. 757 –764. 2[BBD09] B ECK F., B URCH M., D IEHL S.: Towards an aesthetic dimensions framework for dynamic graph visualisations.In Information Visualisation, 2009 13th International Conference(july 2009), pp. 592 –597. 1[BRSG07] B ENNETT C., RYALL J., S PALTEHOLZ L., G OOCH 1A.: The Aesthetics of Graph Visualization. In ComputationalAesthetics in Graphics, Visualization, and Imaging, CunninghamD. W., Meyer G., Neumann L., (Eds.). 2007, pp. 1–8. 1[CZQ 08]C UI W., Z HOU H., Q U H., W ONG P. C., L I X.:Geometry-based edge clustering for graph visualization. IEEETransactions on Visualization and Computer Graphics 14, 6(Nov.-Dec. 2008), 1277–1284. 2[EH00] E ADES P., H UANG M. L.: Navigating clustered graphsusing force-directed methods. Journal of Graph Algorithms andApplications 4 (2000), 157–181. 2[Fen97] F ENG Q.: Algorithms for Drawing Clustered Graphs.PhD thesis, University of Newcastle, 1997. 2[FR91] F RUCHTERMAN T. M. J., R EINGOLD E. M.: Graphdrawing by force-directed placement. Software - Practice andExperience 21, 11 (November 1991), 1129–1164. 2c The Eurographics Association 2012.[HMM00] H ERMAN I., M ELANCON G., M ARSHALL M. S.:Graph visualization and navigation in information visualization:A survey. IEEE Transactions on Visualization and ComputerGraphics 6, 1 (2000), 24–43. 1[Hol06] H OLTEN D.: Hierarchical edge bundles: Visualization ofadjacency relations in hierarchical data. IEEE Transactions onVisualization and Computer Graphics 12, 5 (Sept.-Oct. 2006),741–748. 2[Hv09] H OLTEN D., VAN W IJK J. J.: Force-directed edgebundling for graph visualization. Eurographics/IEEE-VGTCSymposium on Visualization (Eurovis) (2009), 983–990. 1, 2,3[KS10] K IENREICH W., S EIFERT C.: An application of edgebundling techniques to the visualization of media analysis results.In Proceedings of the 14 International Conference on Information Visualization (IV201) (2010), IEEE Computer Society Press.2[LBA10] L AMBERT A., B OURQUI R., AUBER D.: Windingroads: Routing edges into bundles. Computer Graphics Forum29, 3 (2010), 853–862. 1, 2, 3[LYRL04] L EWIS D. D., YANG Y., ROSE T. G., L I F.: Rcv1: Anew benchmark collection for text categorization research. Journal of Machine Learning Research, 5 (2004), 361–397. 3[MSG10] M UHR M., S ABOL V., G RANITZER M.: Scalable recursive top-down hierarchical clustering approach with implicitmodel selection for textual data sets. In Proceedings of the 2010Workshops on Database and Expert Systems Applications (2010),pp. 5–19. 2, 3[Noa07] N OACK A.: Energy models for graph clustering. Journalof Graph Algorithms and Applications 11, 2 (2007), 453–480. 2[Sch07] S CHAEFFER S. E.: Graph clustering. Computer ScienceReview 1, 1 (2007), 27 – 64. 2[SMER06] S HEN Z., M A K.-L., E LIASSI -R AD T.: Visual analysis of large heterogeneous social networks by semantic and structural abstraction. IEEE Transactions on Visualization and Computer Graphics 12, 6 (2006), 1427–1439. 1[WMC 09] W ONG P. C., M ACKEY P., C OOK K., ROHRER R.,F OOTE H., W HITING M.: A multi-level middle-out crosszooming approach for large graph analytics. In Visual AnalyticsScience and Technology, 2009. VAST 2009. IEEE Symposium on(oct. 2009), pp. 147 –154. 4
organized graph data set. Respective advantages of the hi-erarchical routing and bundling methods are compared and contrasted with flat, non-hierarchical representations. 2. Related Work Graph visualization is a broad area of research where a large number of different approaches, each addressing par-