Transcription
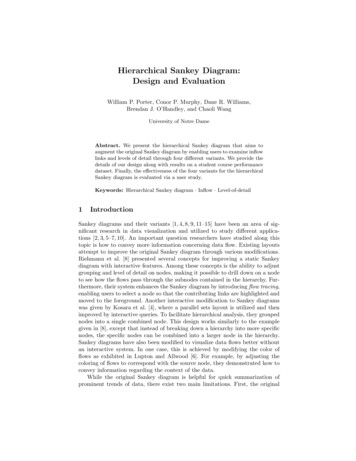
Hierarchical Sankey Diagram:Design and EvaluationWilliam P. Porter, Conor P. Murphy, Dane R. Williams,Brendan J. O’Handley, and Chaoli WangUniversity of Notre DameAbstract. We present the hierarchical Sankey diagram that aims toaugment the original Sankey diagram by enabling users to examine inflowlinks and levels of detail through four different variants. We provide thedetails of our design along with results on a student course performancedataset. Finally, the effectiveness of the four variants for the hierarchicalSankey diagram is evaluated via a user study.Keywords: Hierarchical Sankey diagram · Inflow · Level-of-detail1IntroductionSankey diagrams and their variants [1, 4, 8, 9, 11–15] have been an area of significant research in data visualization and utilized to study different applications [2, 3, 5–7, 10]. An important question researchers have studied along thistopic is how to convey more information concerning data flow. Existing layoutsattempt to improve the original Sankey diagram through various modifications.Riehmann et al. [8] presented several concepts for improving a static Sankeydiagram with interactive features. Among these concepts is the ability to adjustgrouping and level of detail on nodes, making it possible to drill down on a nodeto see how the flows pass through the subnodes contained in the hierarchy. Furthermore, their system enhances the Sankey diagram by introducing flow tracing,enabling users to select a node so that the contributing links are highlighted andmoved to the foreground. Another interactive modification to Sankey diagramswas given by Kosara et al. [4], where a parallel sets layout is utilized and thenimproved by interactive queries. To facilitate hierarchical analysis, they groupednodes into a single combined node. This design works similarly to the examplegiven in [8], except that instead of breaking down a hierarchy into more specificnodes, the specific nodes can be combined into a larger node in the hierarchy.Sankey diagrams have also been modified to visualize data flows better withoutan interactive system. In one case, this is achieved by modifying the color offlows as exhibited in Lupton and Allwood [6]. For example, by adjusting thecoloring of flows to correspond with the source node, they demonstrated how toconvey information regarding the context of the data.While the original Sankey diagram is helpful for quick summarization ofprominent trends of data, there exist two main limitations. First, the original
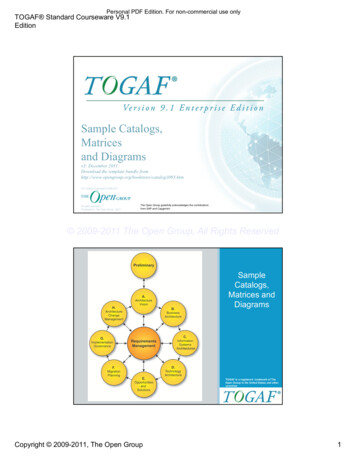
2W. P. Porter et al.Sankey diagram does not preserve the history of links. Thus, when viewing theoutflow links from a node, it is impossible to identify which inflow links comprisethat particular link and to what degree. Second, the original Sankey diagramcannot visualize the hierarchical structure within a particular node. Althoughthe modifications to the Sankey diagram mentioned above improve the demonstration of data flow, there is still no solution that allows users to dynamicallyvisualize the context of a data flow and change the specificity of nodes.In this paper, we present the hierarchical Sankey diagram. Our hierarchicalversion of the Sankey diagram expands upon a standard Sankey diagram byaddressing these limitations while preserving the core ability of the diagram tovisualize data flow quickly. To make a Sankey diagram visually appealing andeasy to understand, we usually avoid showing a large number of nodes whenenabling level-of-detail exploration. Often, these nodes, which are essentiallygroupings of individual data points, serve as a general category for data. Withinthese categories may exist several subcategories, which may contain their distincttrends of data flow. We advocate an in-place approach by presenting two typesof variants: inflow and level-of-detail. By “in-place”, we mean modifying theoriginal Sankey diagram rather than supplementing it with another separateview. These variants are built upon the fundamental idea of splitting nodesand merging them to enable more dimensions of comparison and generate moreinsight.The contributions of our work are the following. First, our work offers anin-place solution to extending the capabilities of the Sankey diagram by splitting nodes dynamically. Second, unlike previous approaches that are practicallylimited to a single column [6], we present a new solution (i.e., vertical separation) to visualizing the inflow history across multiple columns. Third, previousworks show that Sankey diagrams can either only depict change among groupsover columns or break down the flow of a hierarchical relationship. By splittingnodes with our level-of-detail variants, we enable the Sankey diagram to communicate both dimensions: level-of-detail and change among groups over columns.Fourth, we conduct a user study to evaluate the effectiveness of the variants andassess user preference.22.1DesignInflow VariantsWe design two variants for inflow links: vertical separation (i.e., splitting theoriginal node based on the inflow links) and color distinction (i.e., coloring theoutflow links based on the inflow links). Note that neither variant affects nodeswith no inflow links. In the following discussion, let us consider a Sankey diagramwith four nodes in each column and four outflow links from each node.The first variant, vertical separation, replaces the original node with fourcopies corresponding to the inflow links. As shown in Figure 1, the four nodesstill represent the same data category as the original node, and together, they
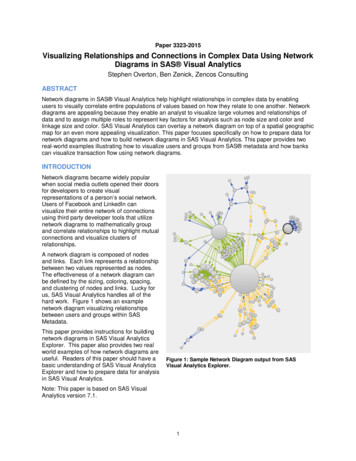
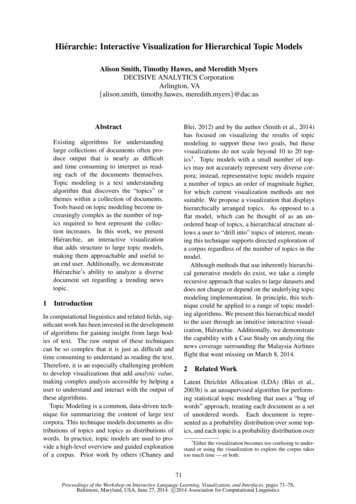
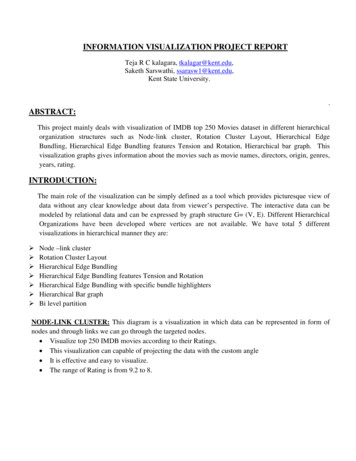
Hierarchical Sankey Diagram3contain the same data points as the original one. However, these data pointsare split based on the source node. This variant has the advantage of quicklysummarizing the distribution of outflow links based on inflow links (i.e., whichnode did data points go to next based on where the data points previously were)and comparing these distributions to the other inflow separations. However, ifmany nodes are split apart, the diagram may appear cluttered and lose theadvantage of rapidly assessing information trends.The second variant, color distinction, colors the outflow links based on the inflow links. This is similar to partitioning bundles of flows [6]. If a node containsfour inflow links, each outflow link will show four partitioned color bands corresponding to the respective colors of the inflow links. The size (i.e., bandwidth) ofthe original outflow link will remain the same, and the sizes of color bands thatcomprise it are proportional to their contributions to the outflow link. Refer toFigure 2 for an example. We point out that color distinction does not scale tomultiple columns as vertical separation does. Moreover, it does not work well fora thin outflow link associated with many inflow links.2.2Level-of-Detail VariantsWe design two variants to show the level-of-detail node information: horizontalsplit and vertical split. Data points can be grouped into categories differently:numerical data can be categorized by the specific numbers as well as intervalsof varying sizes, and categorical data can be grouped based on similarities between data points. Regardless of whether a dataset is numerical, categorical, ora combination of both, there are often subcategories generalized by nodes.The first variant, horizontal split, adds a new column of the subcategories tothe right side of the column where the original node belongs, as shown in Figure 3. While the original node and inflow links are preserved, the original nodenow has new outflow links to each subcategory. The advantage of this variantis that the original node is kept, and it is easier to see its breakdown. However,chaining together subcategories by applying this variant to more subcategoriescould significantly increase the diagram’s horizontal space. Furthermore, thecolumns of the Sankey diagram are usually distinctive and naturally representdifferent groupings. Therefore, adding a new column for subcategories may confuse users.The second variant, vertical split, means replacing the original node with newnodes of further specificity based on subcategories. These subcategorical nodescan be further split into their subcategories, replacing the node being brokendown. Note that vertical split replaces a node with its child nodes showing thenext level of detail, while vertical separation duplicates the same node based onthe inflow links. Refer to Figure 4 for an example. The advantage of replacingthe original node is that it allows users to identify each subcategories’ inflow andoutflow. Subcategories of a node may have their own trends, and this variant isuseful for identifying them. However, it can be more difficult to quickly assessthe size and trend of the original category as users would need to recombine theinflow and outflow links of these subcategories mentally. Adding marks to the
4W. P. Porter et al.(a)(b)(c)Fig. 1. Inflow: vertical separation. (a) shows the original Sankey diagram. (b) separatingB on Exam 3 column. (c) continuing on (b) and separating A on Exam 2 column.visualization indicating that certain nodes belong to the same initial node (e.g.,dashed vertical lines connecting them or a bounding box around the split nodesin a group) would help. Still, it may lead to visual clutter with multiple suchinstances.33.1ResultsDataset and Web ApplicationThe dataset was collected from student performance data of a course. The performance data include student grades in three exams and the final exam. Thegrades are quantitative (0 to 100), and we used standard groupings for lettergrades. A, B, C, D, and F represent the groupings [90-100], [80-90), [70-80), [6070), and [0-60), respectively. A ‘ ’ indicates a grade that the ones-digit is 7,and a ‘-’ indicates a grade that the ones-digit is 3. B, C, and D all have both ‘ ’and ‘-’ while A only has ‘-’ and F has neither. We created a web application by
Hierarchical Sankey Diagram5(a)(b)Fig. 2. Inflow: color distinction. (a) and (b) show the results before and after applyingthis variant to all nodes on Exam 3 column.implementing the four variants of the hierarchical Sankey diagram using D3.js.We have released the application at https://www.nd.edu/ cwang11/hsd/. Thefigures shown in the paper are screenshots of this web application. We addedhighlights in Figures 1, 3, and 4 and zoom-in views in Figure 2 to show the intended changes, which are easy to observe when interacting with the application.3.2Visualization ResultsAs depicted in Figure 1(b), the vertical separation variant to inflow links grantsus further insight. Before splitting node B on Exam 3 (refer to Figure 1(a)), userscannot identify the relation between inflow and outflow links. After the split, Bis broken down into four new nodes: one from each of the Exam 2 nodes (A, B,C, and D). Note that F is not shown as there is no inflow from it. The abilityto relate the outflow and inflow links dramatically extends the capabilities ofa Sankey diagram, which is premised on the relationship between nodes. Thisvariant allows users to draw considerable more insight into the data quickly. By
6W. P. Porter et al.(a)(b)Fig. 3. Level-of-detail: horizontal split. (a) splitting B on Exam 3 column. (b) splitting Con Exam 2 column then further splitting C , B on Exam 3 column then further splittingB, and A on Final Exam column then further splitting A-.also splitting another node from another column (e.g., A on Exam 2), Figure 1(c)demonstrates how multiple nodes can be split to extend the capabilities of inflowhistory even further. Figure 2 depicts another variant to this idea using colordistinction. Rather than create a new node, this variant simply colors the outflowlink according to the contribution of the inflow links. While the result may appearmore challenging to read, it has the advantage of not creating new nodes to avoidovercrowding. Consequently, as shown in Figure 2(b), where this hierarchy isapplied to all nodes on the Exam 3 column, it is possible to quickly assess andcompare inflow history across all nodes of a particular column.As shown in Figure 3(a), the horizontal split for level-of-detail creates a newcolumn to represent the breakdown of specificity. Here, we split the generalcategory of B into their subcategories of B , B, and B-. Figure 3(b) demonstratesthis successive breakdown into a different level of detail. Notice how new columnsare created for new levels of detail, and the inflow to each hierarchy is its parent.
Hierarchical Sankey Diagram(a)7(b)(c)Fig. 4. Level-of-detail: vertical split. (a) and (b) show the same breakdowns as in Figure 3(a) and (b), respectively. (c) applying this variant to all nodes on Exam 3 column tothe finest level of detail.In Figure 4, (a) and (b) show the same breakdowns using vertical split rather thanhorizontal split. As depicted, the original node is replaced by the new categories.However, the Sankey diagram may begin to lose its readability as the numberof nodes increases due to constant expansions of the level-of-detail hierarchy ofnodes. Such a result is shown in Figure 4(c).4EvaluationWe conducted an uncontrolled user study to evaluate the effectiveness of eachof the variants in communicating inflow or level-of-detail information to usersand gauge which variant users prefer to use. We did not include the originalSankey diagram in the study because it only supports the examination of inflow.We recruited students from the Department of Computer Science and Engineering at our university who responded to a department-wide email soliciting paid
8W. P. Porter et al.(a)(b)Fig. 5. Tooltips when hovering over nodes in the hierarchical Sankey diagram.volunteers. A total of 19 participants completed the study, and each was compensated 20 for a session that lasted less than one hour. The majority of theparticipants are juniors and seniors (nine juniors and seven seniors). In terms ofdemographic breakdown, four are Asian, 11 are Caucasian, one is Hispanic, andthree are other ethnicities. We hosted our implementation as a web applicationand distributed the URL to participants on the day they chose to complete thestudy. Participants completed the study using their personal computers. One ofthe student co-authors of this work was available via a Zoom link at all times toanswer questions from the participants or help troubleshoot the application.4.1TutorialAs the first step of the study, we provided a tutorial that introduces participantsto the variants and helps them understand how to use the variants to gain aparticular type of insight from the dataset. In addition, the tutorial preparesparticipants for the format of questions that will be asked in the next phase.The tutorial is divided into four sections, one for each variant. Participants wereinstructed to use the application to select a variant and then interact with thediagram for that variant. For example, in the Inflow: Vertical Separation section,participants separated node Exam 3 A and were told how one of the new nodes,Exam 3 A (Exam 2 A), represents students that received an A on Exam 2 and anA on Exam 3. The instructions also describe the corresponding tooltip as shownin Figure 5(a) that appears when the Exam 3 A (Exam 2 A) node is hovered. Thetooltip includes title, number of students corresponding to the node, percentageof the parent node (Exam 3 A) the previous number represents, and percentage ofall scores from Exam 3. In the Level-of-Detail: Horizontal Split section, participantsclicked on node Exam 3 B and took note of the three resultant nodes: Exam 3 B ,Exam 3 B, and Exam 3 B-. The instructions describe the corresponding tooltipas shown in Figure 5(b) that appears when the Exam 3 B node is hovered.The tooltip includes title, number of students, percentage of the source node (allB grades), and percentage of all grades for Exam 3. Participants completed thetutorial by following a Google Form and checking a checkbox after finishing eachsection. The purpose is to dissuade them from skimming through the tutorialwithout thoroughly reading it. More than two-thirds of the participants agreed
Hierarchical Sankey Diagram9that the tutorial was sufficient to learn how to use and interpret the hierarchicalSankey diagram.4.2SurveyAfter participants completed the tutorial, they moved on to a new Google Formwith the survey including seven sections of questions. The four initial sections,one for each variant, come with multiple-choice and short-answer questions. Thequestions were designed to test the understanding of the variant and how effectiveit is at conveying either inflow or level-of-detail to the participants. We randomized the order of these four sections for participants to mitigate the possibleaccumulation of learning effects in answering questions. For the inflow variants,participants were asked to identify the most common score from Exam 1 receivedby students who also received the specified scores on the following two examsand state the number of students who received these scores on the three exams.This question assesses the ability of the variants to allow a user to compare theoutflows of a given node, separated by the inflow to that node, to a specifiedtarget node. They were also asked to answer the number of students who received a given grade on Exam 3 with specified grades on Exam 1 and Exam 2.This question assesses the ability of the variants to convey to a user how a pathcan be created between three nodes using inflow information. For the level-ofdetail variants, participants were asked to identify the number of students whoreceived a specific letter grade (A- or B-) on Exam 3 and state the percentageof the overall letter grade those students represent. These questions assess theability of the variants to convey the size of a node’s subcategories.The fifth section of the survey asks two questions that can be answered withan inflow variant and two questions that can be answered with a level-of-detailvariant. In this section, there is no guidance on which variant to use in answeringa question. Participants were asked to give the answer to the question and alsostate which variant was used to come up with the answer. In this way, we can examine whether users understand the differences between the variants and whichone is optimal for a given task. The sixth section of questions asks participantsto describe the usage of a Sankey diagram to assess their baseline knowledgeof the diagram. We also asked various questions that require comparing andcontrasting the inflow and level-of-detail variants against each other, stating theadvantages and disadvantages of each variant and stating the preferred choicebetween each pair of variants. These questions were asked to assess further theparticipant’s understanding and preference of the variants. The seventh sectionasks participants to rate on a scale of 1-5 how strongly they feel that (1) thevariants, in general, provide additional use beyond the standard Sankey diagram and (2) the pair of inflow and pair of level-of-detail variants, are effectivein understanding the prior grades of students that comprise nodes and the morespecific grades that can be revealed by breaking down nodes. These questionswere asked to understand the participant’s judgment of the effectiveness of ourin-place approaches to the hierarchical Sankey diagram.
10W. P. Porter et al.Table 1. Participant performance for the four variants of the hierarchical Sankeydiagram, corresponding to the first four sections of the survey.typevariant# questions aggregate score percentageinflowvertical separation337/5764.91%inflowcolor distinction346/5780.70%level-of-detail horizontal split237/3896.37%level-of-detailvertical split237/3896.37%4.3User Study ResultsTable 1 reports the aggregate scores of participants for the first four sections ofthe survey, which evaluates how effective each variant is in helping the participants answer the questions correctly. Participants were more accurate in theirresponses when using color distinction to answer questions in the first and secondsections of the survey, which measure the performance of the inflow variants.Only 11 students were able to correctly answer “Of the students who scored a Bon Exam 2 and an A on Exam 1, how many students received an A on Exam 3?”using vertical separation, whereas 17 students correctly answered “Of the studentswho scored an A on Exam 2 and a B on Exam 1, how many students received aB on Exam 3?” using color distinction. Both variants saw 18 correct responses tothe questions “How did most of the students perform on Exam 1 who scored aC on Exam 2 and a C on Exam 3?” (vertical separation) and “How did most ofthe students perform on Exam 1 who scored a B on Exam 2 and a B on Exam3?” (color distinction). However, only seven participants correctly identified howmany students the group contained using vertical separation, compared to 13correct answers using color distinction.Performance was relatively similar when using the level of detail variants.Using horizontal split, all participants correctly answered “How many studentsreceived an A- on Exam 3?” and 17 correctly answered “What percentage of allstudents who scored an A on Exam 3 does this make up?”. Using vertical split, allparticipants correctly answered “How many students received a B- on Exam 3?”and 16 correctly answered “What percentage of all students who scored a B onExam 3 does this make up?”. The concept of hierarchical subcategories that makeup the level-of-detail variants is perhaps very straightforward to users, explainingthe high level of correctness in participant responses to these questions. On theother hand, the inflow variants attempt to solve a problem that potentiallyrequires more thought from users, even with an effective visual tool. In this case,we can see a more apparent separation in understanding between the two inflowvariants for the questions asked, suggesting that color distinction is more effectiveat creating a continuous path between nodes that a user can interpret.We found that participants preferred color distinction over vertical separationwhen asked to choose a variant to answer an inflow-related question about thedata. Still, the results were reversed when asked directly to select a preferencebetween the two. Of the two questions that require a participant to choose aninflow variant without guidance, the question, “How many students received an
Hierarchical Sankey Diagram11A on Exam 1, a B on Exam 2, and a C on Exam 3?” was answered by ten participants using the color distinction variant and eight participants using verticalseparation (one student chose horizontal split). The other question of this type,“Of the students who scored a C on Exam 3 and a B on Final Exam, how did mostof these students perform on Exam 2?” was answered by 11 participants usingcolor distinction and eight participants using vertical separation. However, whenasked to select their preference between the two variants, 14 participants pickedvertical separation, and only five preferred color distinction. A similar outcomeoccurred in the comparison of preference between level-of-detail variants. “Howmany students scored 78/100 on Exam 3?” was answered by ten participants using horizontal split and nine using vertical split, and “How many students receiveda B on Exam 3 and an A on Final Exam?” was answered by ten participantsusing horizontal split and seven using vertical split (two participants used verticalseparation). When asked directly which of the two variants they preferred, 11participants selected vertical split, while eight picked horizontal split.5Conclusions and Future WorkWe have presented the design and evaluation of the hierarchical Sankey diagram,which includes inflow support via vertical separation or color distinction and levelof-detail support via horizontal split or vertical split. The evaluation results showthat color distinction is more effective than vertical separation for inflow-relatedquestions, although vertical separation was preferred in use. We note that theseresults may not indicate the efficacy of both variants as color distinction is limitedto a single column, but vertical separation can scale to multiple columns. Thus,the survey could only assess questions related to a single column for comparison.Furthermore, horizontal split and vertical split perform similarly for level-of-detailrelated questions, and there is no clear preference over horizontal split and verticalsplit. We believe that the general in-place approach presented for augmentingthe standard Sankey diagram can be helpful in many cases. Therefore, besidesmaking the current code open source, we will generalize our implementation asa library to benefit others.AcknowledgmentsThis research was supported in part by the U.S. National Science Foundationthrough grants IIS-1455886, DUE-1833129, IIS-1955395, IIS-2101696, and OAC2104158. The authors would like to thank the anonymous reviewers for theirhelpful comments.References1. Burch, M., Timmermans, N.: Sankeye: A visualization technique for AOI transitions. In: Proceedings of ACM Symposium on Eye Tracking Research and Applications (Short Papers). pp. 48:1–48:5 (2020)
12W. P. Porter et al.2. Chou, J.K., Wang, Y., Ma, K.L.: Privacy preserving event sequence data visualization using a Sankey diagram-like representation. In: Proceedings of ACM SIGGRAPH Asia Symposium on Visualization. pp. 1:1–1:8 (2016)3. Huang, C.W., Lu, R., Iqbal, U., et al.: A richly interactive exploratory data analysisand visualization tool using electronic medical records. BMC Medical Informaticsand Decision Making 15, 92:1–92:14 (2015)4. Kosara, R., Bendix, F., Hauser, H.: Parallel Sets: interactive exploration and visualanalysis of categorical data. IEEE Transactions on Visualization and ComputerGraphics 12(4), 558–568 (2006)5. Lehrman, B.: Visualizing water infrastructure with Sankey maps: a case studyof mapping the Los Angeles aqueduct, California. Journal of Maps 14(1), 52–64(2018)6. Lupton, R.C., Allwood, J.M.: Hybrid Sankey diagrams: Visual analysis of multidimensional data for understanding resource use. Resources, Conservation andRecycling 124, 141–151 (2017)7. Müller, G., Sugiyama, H., Stocker, S., Schmidt, R.: Reducing energy consumptionin pharmaceutical production processes: Framework and case study. Journal ofPharmaceutical Innovation 9, 212–226 (2014)8. Riehmann, P., Hanfler, M., Froehlich, B.: Interactive Sankey diagrams. In: Proceedings of IEEE Symposium on Information Visualization. pp. 233–240 (2005)9. Sansen, J., Lalanne, F., Auber, D., Bourqui, R.: Adjasankey: Visualization of hugehierarchical weighted and directed graphs. In: Proceedings of International Conference on Information Visualisation. pp. 211–216 (2015)10. Verma, J., Luo, H., Hu, J., Zhang, P.: DrugPathSeeker: Interactive UI for exploringdrug-ADR relation via pathways. In: Proceedings of IEEE Pacific VisualizationSymposium. pp. 260–264 (2017)11. Vosough, Z., Hogräfer, M., Royer, L.A., Groh, R., Schulz, H.J.: Parallel Hierarchies:A visualization for cross-tabulating hierarchical categories. Computers & Graphics76, 1–17 (2018)12. Vosough, Z., Kammer, D., Keck, M., Groh, R.: Mirroring Sankey diagrams for visual comparison tasks. In: Proceedings of International Conference on InformationVisualization Theory and Applications. pp. 349–355 (2018)13. Xia, M., Velumani, R., Wang, Y., Qu, H., Ma, X.: QLens: Visual analytics of MUltistep problem-solving behaviors for improving question design. IEEE Transactionson Visualization and Computer Graphics 27(2), 870–880 (2021)14. Zarate, D.C., Bodic, P.L., Dwyer, T., Gange, G., Stuckey, P.: Optimal Sankeydiagrams via integer programming. In: Proceedings of IEEE Pacific VisualizationSymposium. pp. 135–139 (2018)15. Zhou, K., Wu, W., Zhao, J., Li, M., Qian, Z., Chen, Y.: Click or not: Differentmouseover effects may affect clicking-through rate while browsing interactive information visualization. Journal of Visualization 23(1), 157–170 (2020)
dataset. Finally, the e ectiveness of the four variants for the hierarchical Sankey diagram is evaluated via a user study. Keywords: Hierarchical Sankey diagram In ow Level-of-detail 1 Introduction Sankey diagrams and their variants [1,4,8,9,11{15] have been an area of sig-ni cant research in data visualization and utilized to study di erent .