Transcription
Office ofSupplier DiversityANNUAL REPORT2017 -20181OSD Annual Report Fiscal Year 2017-18
Table of ContentsDepartment of Management Services Welcome Message.1Office of Supplier Diversity Annual Report Fiscal Year 2017-18.2Supplier Diversity Exchange.3Social Media.4Ambassador Agreements.5New Certifications for Fiscal Year 2017-18.6Recertifications for Fiscal Year 2017-18.7New Certifications and Recertifications for Fiscal Year 2017-18.8Current Certified Firms for Fiscal Year 2017-18.9Top 20 Commodity Codes of Certified Business Enterprises.9Certified Business Enterprises by Region.10Agency Compliance for Business Participation Plans.11Data Calculation in Fiscal Year 2017-18.12Fiscal Year 2017-18 Total Agency Expenditures by Industry.12Fiscal Year 2017-18 Total Spend Dollar Amount and Percentage of Contracts Awarded toCertified Business Enterprises.13Fiscal Year 2017-18 Total Agency Expenditures by Business Classification.14Number of Solicitations Posted by Agency in Vendor Bid System.15The Florida College System Fiscal Year 2017-18.16
1OSD Annual Report Fiscal Year 2017-18
Office of Supplier Diversity Annual Report Fiscal Year 2017-18OSD is the specialized team within the Division of State Purchasing at DMS that serves as a resource for smallbusinesses. Specifically, OSD manages the certification program for Florida-based woman-, veteran-, and minorityowned businesses. By providing education, outreach, and marketing efforts, OSD helps improve businessopportunities for small businesses through the following activities:l Assisting small business owners with applicable state certification and recertification;lllllTargeting outreach and communications of opportunities specific to unique commodity listings; Advocating for the utilization of certified woman-, veteran-, and minority-owned businesses with state, local,and private industries; Planning, hosting, and supporting Florida networking and business exchange events geared toward woman-,veteran-, and minority- business owners; roviding educational information to state government procurement professionals to help increase the usePof small businesses in state and local government procurement contracts; andPromoting procurement opportunities across a variety of industries.To become a certified woman-, veteran-, or minority-owned business, the following requirements must be met:l Be engaged in commercial transactions;lllBe domiciled in Florida; e 51-percent owned, managed, and controlled by an African-American, Hispanic-American, AsianBAmerican, Native-American, woman, or veteran who is a permanent resident of Florida and a United Statescitizen or permanent resident alien; and e a small business that is independently owned and operated, with a net worth of no more than 5 millionBand that employs fewer than 200 full-time permanent employees, or is recognized as a certified business bythe federal government.Certification benefits include:lF irst-tier referrals to state agencies and other public/private entities for purchase order and contractopportunities;lE xclusive listing of state-certified woman-, veteran-, or minority-owned business in an online directory;lDirect messaging from state agencies and other organizations about procurement opportunities;lParticipation and networking at regional events; andlM entor-protégé opportunities for business development and guidance from established corporations.2OSD Annual Report Fiscal Year 2017-18
Supplier Diversity ExchangeBy tapping into the “buying local” movement, OSD’s signature event, the Supplier Diversity Exchange, continued toachieve much success in Fiscal Year 2017-18. The Supplier Diversity Exchange is a networking-style event that blendstraining about government purchasing with the scheduling of one-on-one appointments with local, federal, andstate buyers. Below is a summary of each Fiscal Year 2017-18 event.I n 2017, OSD expanded the Supplier Diversity Exchange event and brought it to South Florida for thefirst time. The Broward Supplier Diversity Day was held on Aug. 25, 2017, at the Broward College NorthCampus Omni Auditorium, in collaboration with Broward College. Twenty-two governmental entities andprofessional organizations participated in the event, and a total of 215 attended. In a post-event survey, 91.1percent of attendees strongly agreed or agreed that participating in the event was beneficial.l The Tallahassee Supplier Diversity Exchange was held on Oct. 4, 2017, at the Agency for Health CareAdministration, in collaboration with Big Bend Minority Enterprise Development (MED) Week. Thirty-fourgovernmental entities and professional organizations participated in the event, and a total of 123 attended.In a post-event survey, 97.1 percent of attendees strongly agreed or agreed that participating in the eventwas beneficial.l The Orlando Supplier Diversity Exchange was held on Nov. 2, 2017, at the University of Central Florida (UCF)campus, in collaboration with UCF and Diverse Strategic Alliances. Twenty-eight governmental entities andprofessional organizations participated in the event, and a total of 140 individuals attended. In a post-eventsurvey, 87.5 percent of attendees strongly agreed or agreed that participating in the event was beneficial.l The Pensacola Supplier Diversity Exchange was held on Feb. 6, 2018, at the City of Pensacola’s SandersBeach-Corinne Jones Resource Center, in collaboration with the City of Pensacola and the Gulf Coast AfricanAmerican Chamber of Commerce. Thirty-eight governmental entities and professional organizationsparticipated in the event, and a total of 126 individuals attended. In a post-event survey, 95.4 percent ofattendees strongly agreed or agreed that participating in the event was beneficial.l In 2018, OSD expanded the Supplier Diversity Exchange event and brought it to Gainesville for the first time.The Gainesville Supplier Diversity Exchange was held on March 8, 2018, at the University of Florida’s (UF)Reitz Union, in collaboration with UF’s Small Business & Vendor Diversity Relations Division. Twenty-sevengovernmental entities and professional organizations participated in the event, and a total of 115 individualsattended. In a post-event survey, 93 percent of attendees strongly agreed or agreed that participating in theevent was beneficial.l Phototo beaddedOSD team members Donna Williams (left)and Hue Reynolds (right) at the BrowardSupplier Diversity Day.Small businesses and state agenciesparticipating in one-on-one interviewsduring the Orlando Supplier DiversityExchange.3OSD Annual Report Fiscal Year 2017-18Hue Reynolds moderating the How toCompete for Government Work paneldiscussion at the Pensacola SupplierDiversity Exchange.
Social MediaIn order to reach businesses that used social media in their day-to-day operations, OSD shared messages onFacebook and Twitter to increase awareness of OSD certification, events, and general small business news. Socialmedia messages shared important information to followers and also allowed OSD to cross-promote events withpartners.4OSD Annual Report Fiscal Year 2017-18
Ambassador AgreementsIn Fiscal Year 2017-18, OSD continued to sign strategic alliance agreements to further align efforts in improvingbusiness and economic opportunities for Florida’s woman-, veteran-, and minority-owned small businesses.Agreements were signed with the following organizations.On Nov. 2, 2017, OSD signed an Ambassador Agreement with UCF at the Orlando Supplier Diversity Exchange.l On Feb. 21, 2018, OSD signed an Ambassador Agreement with Florida A&M University (FAMU) Small BusinessDevelopment Center at OSD’s Quarterly Small Business Workshop.l On March 8, 2018, OSD signed an Ambassador Agreement with The City of Gainesville at the Gainesville SupplierDiversity Exchange.l Hue Reynolds signs an Ambassador Agreement with Keith Bowers,Regional Director Florida Small Business Development Center atFAMU.Gregory Robinson, UCF’s Director of Procurement Services andHue Reynolds, OSD’s Executive Director, sign an AmbassadorAgreement at the Orlando Supplier Diversity Exchange.Hue Reynolds and Dr. Bridget Lee, City of Gainesville’s Office of EqualOpportunity Interim Director, sign an Ambassador Agreement at theGainesville Supplier Diversity Exchange.5OSD Annual Report Fiscal Year 2017-18
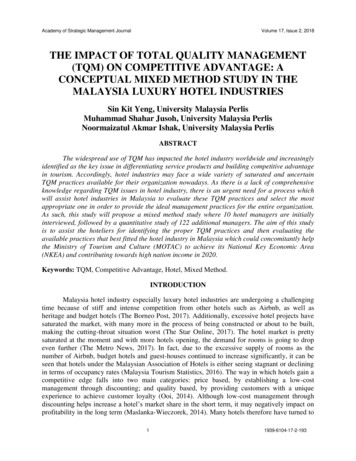
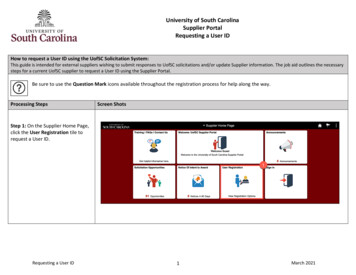
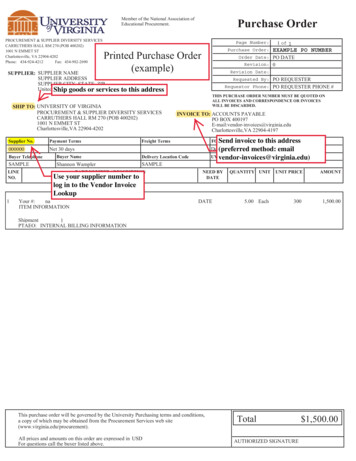
New Certifications for Fiscal Year 2017-18During Fiscal Year 2017–18, 821* firms were newly certified as woman-, veteran-, and/or minority-ownedbusinesses. This represents an 18 percent increase in total new certifications since Fiscal Year 2016-17.8388 Woman-ownedbusinesses (36%)45215 African-American-ownedbusinesses (20%)205 Hispanic-American-ownedbusinesses (19%)36%Asian-American-ownedbusinesses (4%)20%Native-American-ownedbusinesses (1%)217 Veteran-ownedbusinesses (20%)4%19%1%Total: 821**Please note: Firms mayhave multiple designations.20%New Certifications Since Fiscal Year 2013-14800New 16-17Fiscal Year6OSD Annual Report Fiscal Year 2017-1817-18
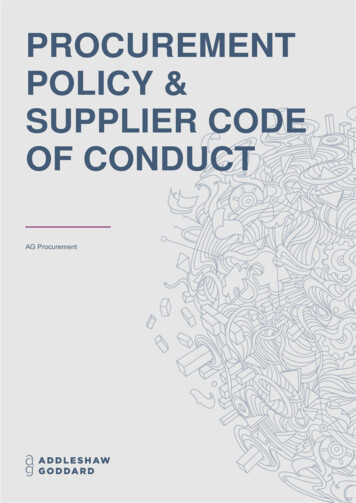
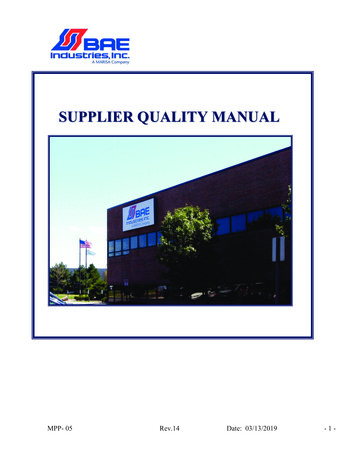
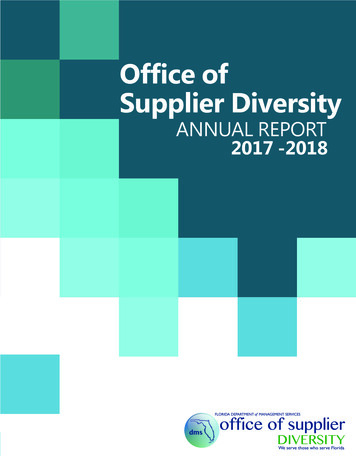
Recertifications for Fiscal Year 2017-18During Fiscal Year 2017–18, 2,062* firms were recertified as woman-, veteran-, and/or minority-ownedbusinesses. This represents a 56 percent increase in total recertifications since Fiscal Year 2016-17.1,218 Woman-ownedbusinesses (49%)140 Asian-American-ownedbusinesses (5%)23415 African-American-ownedbusinesses (17%)491 Hispanic-American-ownedbusinesses (20%)196 Veteran-ownedbusinesses (8%)49%17%Native-American-ownedbusinesses (1%)5%20%Total: 2,062**Please note: Firms mayhave multiple designations.1% 8%Recertifications Since Fiscal Year 500* NOTE: Firms have theability to recertify everytwo years. Of the totalfirms certified andrecertified in Fiscal Year2014-15, 80% of thesefirms completed arecertification in FiscalYear 2016-17.1,4001,30013-1414-1515-1616-17*Fiscal Year7OSD Annual Report Fiscal Year 2017-1817-18
New Certifications and Recertifications for Fiscal Year 2017-18During Fiscal Year 2017–18, 2,883* firms were newly certified or recertified as woman-, veteran-, and/orminority-owned businesses. This represents a 43 percent increase in total new certifications and recertificationssince Fiscal Year 2016-17.1,606 Woman-ownedbusinesses (45%)185 Asian-American-ownedbusinesses (5%)31630 African-American-ownedbusinesses (18%)696 Hispanic-American-ownedbusinesses (19%)413 Veteran-ownedbusinesses (12%)45%18%Native-American-ownedbusinesses (1%)5%19%Total: 2,883**Please note: Firms mayhave multiple designations.1% 12%New Certifications and RecertificationsNew Certifications and Recertifications Since Fiscal Year 2013-142,9002,8002,7002,6002,5002,4002,300Firms have the* NOTE:ability to recertify everytwo years. Of the totalfirms certified andrecertified in Fiscal Year2014-15, 80% of thesefirms completed arecertification in FiscalYear 2016-17.2,2002,1002,00013-1414-1515-1616-17*Fiscal Year8OSD Annual Report Fiscal Year 2017-1817-18
Current Certified Firms for Fiscal Year 2017-18As of Dec. 5 2018, OSD has a total of 5,017* certified firms in Florida. This represents a 12 percent increase in totalcertified firms since Fiscal Year 2016-17.2,754 Woman-ownedbusinesses (44%)1,110 African-American-ownedbusinesses (18%)302 Asian-American-ownedbusinesses (5%)491,257 Hispanic-American-ownedbusinesses (20%)768 Veteran-ownedbusinesses (12%)44%18%Native-American-ownedbusinesses (1%)5%20%Total: 5,017**Please note: Firms mayhave multiple designations.1% 12%Top 20 Commodity Codes of Certified Business EnterprisesThe following are the top 20 commodities selected by OSD-certified businesses for Fiscal Year 2017-18, representingthe various goods and services they provide.Professional Engineering ServicesStructural MaterialsSoftwareMarketing and DistributionSpecialized Trade Construction AndMaintenance ServicesHardwareNonresidental Building Construction ServicesResidential Building Construction ServicesClothingSignage and AccessoriesComputer ServicesComputer Equipment and AccessoriesManagement Advisory ServiceAdvertisingHuman Resources ServicesReproduction ServicesTransportation Components and SystemsPersonal Safety and ProtectionPublic Relations and ProfessionalCommunications ServicesEnvironmental Management9OSD Annual Report Fiscal Year 2017-18
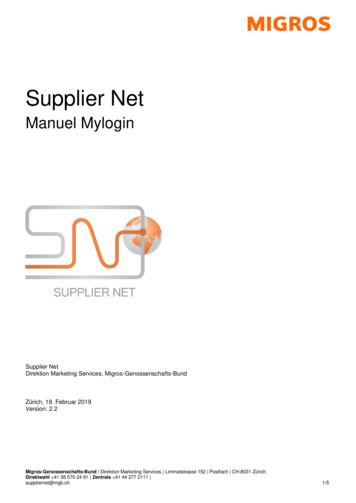
Certified Business Enterprises by RegionThe regional representation of CBEs is noted below. The Central and Suncoast regions represent nearly halfthe certified businesses in Florida.Okaloosa GadsdenColuWashingtonJeffersoniaEscambHolmesSanta 8%OsceolaHillsboroughPolkPinellasIndian otoCharlotteSuncoast24%Southeast21%Southern14%St. LucieeeCentralobHighlandsMartinGladesHendryLeePalm BeachBrowardCollierMiami-DadeMonroe10OSD Annual Report Fiscal Year 2017-18
Agency Compliance for Business Participation PlansSection 287.09451 (6), Florida Statutes, annually requires all state agencies to submit Business Participation Plansto OSD. Each plan includes the organization’s strategy for increasing diversity in the organization’s purchasing andcontracting opportunities, as well as the previous fiscal year’s spending with woman-, veteran-, and minority-ownedCBEs. Plans must also include a statement and assessment of good faith efforts taken by each state agency anda status report of agency compliance with subsection (6). Plans from the following agencies were submitted andapproved by OSD:Agency for Health Care AdministrationDepartment of Highway Safety and Motor VehiclesAgency for Persons With DisabilitiesDepartment of Juvenile JusticeAgency for State TechnologyDepartment of Law EnforcementDepartment of Agriculture and Consumer ServicesDepartment of Legal AffairsDepartment of Business and Professional RegulationDepartment of Management ServicesDepartment of Children and FamilesDepartment of Military AffairDepartment of CitrusDepartment of RevenueDepartment of CorrectionsDepartment of StateDepartment of Economic OpportunityDepartment of the LotteryDepartment of EducationDepartment of TransportationDepartment of Elder AffairsDepartment of Veterans’ AffairsDepartment of Environmental ProtectionDivision of Administrative HearingsDepartment of Financial ServiceExecutive Office of the GovernorDepartment of HealthFish & Wildlife Conservation Commission11OSD Annual Report Fiscal Year 2017-18
Data Calculation in Fiscal Year 2017-18Over the past several years, OSD has expanded its data calculations to include total agency spending with CBEs(in dollar amount and percentage) versus each agency’s dedicated contract funds. This calculation excludes anyagency transfers, grants, subsidies, or other pass-through payments (to other state agencies or recipients), as thoseexpenditures do not represent active and deliberate contracting decisions on the part of the agency. This way ofcollecting data provides a more relevant representation of the state’s expenditures with woman-, veteran-, andminority-owned small businesses.Fiscal Year 2017-18 Total Agency Expenditures by IndustryArchitects/EngineersAgencyAgency for Healthcare AdministrationAgency for Persons with DisabilitiesAgency for State TechnologyDepartment of Agriculture and Consumer ServicesDepartment of Business and Professional RegulationDepartment of Children and FamiliesDepartment of CitrusDepartment of CorrectionsDepartment of Environmental ProtectionDepartment of Financial ServicesDepartment of HealthDepartment of Legal Affairs 9,665.00 99,392,350.07 110,079,664.44 7,113,821.82 586,567.40 9,727,605.90 17,558,401.75 0.00 7,213,133.39 0.00 27,099,955.53 34,313,088.92 15,581,684.67 49,036,074.95 34,215,213.99 64,384,704.73 163,217,678.34 0.00 1,507,463.75 0.00 5,766,786.89 7,274,250.64 145,784.28 45,444,574.62 2,937,650.21 61,759,255.10 110,287,264.21 0.00 380,112.82 327,418.47 11,498,824.94 12,206,356.23 12,550,579.83 193,674,441.61 441,690,268.31 6,306,813.42 0.00 1,532,190.85 102,684,866.83 32,608,311.06 0.00 28,269,707.18 406,091.81 264,569,334.35Department of Highway Safety and Motor VehiclesDepartment of Law Enforcement 10,677,649.37 260,808.25 161,525,274.94Department of Elder AffairsTotal 0.00 46,734.00Department of EducationContractualServicesConstruction 130,406.63 857,128.54 234,608,118.33Department of Economic OpportunityDepartment of Juvenile JusticeCommodities 49,018.95 77,495,035.54 0.00 18,460,586.69 744,410.15 17,441,943.80 34,198.74 22,841,358.74 29,229,104.90 1,700,563.82 153,532,221.28 317,018,868.29 0.00 1,571,565.79 3,103,756.64 58,204,309.83 147,096,773.29 340,594,261.01 68,984,914.51 97,364,602.17 4,330,388.80 289,074,723.20 109,980.48 558,380,538.16 3,982,325.57 42,649,272.55 124,175,652.61 46,118.00 251,306,258.37 269,812,963.06 352,170.82 18,947,983.28 37,486,508.05 2,800.00 10,612,057.59 68,086.30 2,470,086.25 13,153,030.14Department of Management Services 2,027,358.11 10,851,427.76 20,764,514.26 28,226,265.08 61,869,565.21Department of Military Affairs 1,632,934.54 42,185,751.39 20,071,832.60 18,982,801.08 82,873,319.61Department of RevenueDepartment of StateDepartment of the LotteryDepartment of TransportationDepartment of Veterans' AffairsDivision of Administrative HearingsExecutive Office of the Governor 0.00 28,245,354.32 226,342.35 63,639,189.17 92,110,885.84 54,084.00 4,759,165.21 597,075.58 4,721,102.22 10,131,427.01 0.00 18,842,980.18 0.00 42,657,148.70 61,500,128.88 1,297,761,024.88 153,114,550.78 3,842,435,631.30 953,420,680.16 6,246,731,887.12 1,704,394.00 10,161,077.18 5,469,690.00 15,190,285.44 32,525,446.62 0.00 856,497.73 0.00 1,128,033.70 1,984,531.43 0.00 13,725,421.69 1,007.96 83,089,609.31 96,816,038.96 1,805,263.47 56,791,740.55 9,111,077.09 56,354,771.47 124,062,852.58Florida Commission on Offender Review 0.00 254,207.87 0.00 43,181.23 297,389.10Public Service Commission 0.00 236,350.06 0.00 480,566.83 716,916.89Fish and Wildlife Conservation CommissionTotal 1,425,894,793.11 1,314,826,729.19 4,018,132,408.40 2,739,712,716.42 9,498,566,647.12** The total agency expenditures for2017-18 represents a 4.9% increasefrom Fiscal Year 2016-17.12OSD Annual Report Fiscal Year 2017-18
Fiscal Year 2017-18 Total Spend Dollar Amount andPercentage of Contracts Awarded to CBEAgencyAgency for Healthcare AdministrationTotal ExpendituresDirect CBEExpenditures%Indirect CBE%Direct (Subcontractor) IndirectCBEExpendituresCBETotal CBEExpenditures% TotalCBE 110,079,664.44 1,560,807.64 1.42% 0.000.00% 1,560,807.64 1.42%Agency for Persons with Disabilities 17,558,401.75 785,078.95 4.47% 0.000.00% 785,078.95 4.47%Agency for State Technology 34,313,088.92 646,604.63 1.88% 0.000.00% 646,604.63 1.88% 163,217,678.34 30,636,341.60 18.77% 5,900.00Department of Agriculture and ConsumerServicesDepartment of Business and ProfessionalRegulationDepartment of Children and FamiliesDepartment of CitrusDepartment of CorrectionsDepartment of Economic OpportunityDepartment of EducationDepartment of Elder AffairsDepartment of Environmental ProtectionDepartment of Financial Services0.00% 30,642,241.60 18.77% 7,274,250.64 1,500,568.15 20.63% 0.000.00% 1,500,568.15 20.63% 110,287,264.21 5,799,837.12 5.26% 8,093,433.057.34% 13,893,270.17 12.60% 12,206,356.23 10,098.54 0.08% 0.000.00% 10,098.54 0.08% 441,690,268.31 12,749,411.48 2.89% 20,840.000.00% 12,770,251.48 2.89% 29,229,104.90 4,348,311.09 14.88% 1,030,812.233.53% 5,379,123.32 18.40% 317,018,868.29 9,538,523.88 3.01% 4,187.000.00% 9,542,710.88 3.01% 3,103,756.64 36,989.06 1.19% 0.000.00% 36,989.06 1.19% 340,594,261.01 46,996,311.82 13.80% 0.000.00% 46,996,311.82 13.80% 3,704,222.25 3.80% 1,154,588.21Department of Health 558,380,538.16 20,532,450.90 3.68% 0.00Department of Highway Safety and MotorVehicles 124,175,652.61 2,956,859.20 2.38% 6,997.500.01% 2,963,856.70 2.39%Department of Juvenile Justice 269,812,963.06 4,482,915.70 1.66% 1,557,123.670.58% 6,040,039.37 2.24%Department of Law Enforcement 37,486,508.05 4,958,789.40 13.23% 0.000.00% 4,958,789.40 13.23%Department of Legal Affairs 13,153,030.14 162,496.59 1.24% 0.000.00% 162,496.59 1.24%Department of Management Services 61,869,565.21 1,536,347.95 2.48% 390,684.710.63% 1,927,032.66Department of Military Affairs 82,873,319.61 2,055,869.15 2.48% 0.000.00% 2,055,869.15 2.48%Department of Revenue 92,110,885.84 6,516,808.327.07% 0.000.00% 6,516,808.32Department of State 10,131,427.01 656,496.85 6.48% 0.000.00% 656,496.85 6.48%Department of the Lottery 61,500,128.88 1,144,598.89 1.86% 12,443,193.57 20.23% 13,587,792.46 22.09%Department of TransportationDepartment of Veterans' AffairsDivision of Administrative HearingsExecutive Office of the GovernorFish and Wildlife Conservation CommissionFlorida Commission on Offender ReviewPublic Service CommissionTotal 97,364,602.17 6,246,731,887.12 185,523,397.82 2.97% 203,850,828.741.19% 4,858,810.46 4.99%0.00% 20,532,450.90 3.68%3.11%7.07%3.26% 389,374,226.56 6.23% 32,525,446.62 238,788.58 0.73% 0.000.00% 238,788.58 0.73% 1,984,531.43 50,368.03 2.54% 0.000.00% 50,368.03 2.54% 96,816,038.96 4,757,417.68 4.91% 0.000.00% 4,757,417.68 124,062,852.58 3,465,204.75 2.79% 0.000.00% 3,465,204.75 2.79% 297,389.10 1,644.41 0.55% 0.000.00% 1,644.41 0.55% 716,916.89 8,781.08 1.22% 0.000.00% 8,781.08 1.22% 9,498,566,647.12* 357,362,341.51 3.76% 228,558,588.684.91%2.41% 585,920,930.19 6.17%* The total agency expenditures for2017-18 represents a 4.9% increasefrom Fiscal Year 2016-17.13OSD Annual Report Fiscal Year 2017-18
Fiscal Year 2017-18 Total Agency Expenditures by Business ClassificationAgencyCertifiedAgency for Healthcare AdministrationNon-CertifiedNon-ProfitOther BusinessClassificationTotal 1,560,807.64 2,812,708.13 4,521,773.11 101,184,375.56 110,079,664.44Agency for Persons with Disabilities 785,078.95 5,075,670.59 1,047,891.95 10,649,760.26 17,558,401.75Agency for State Technology 646,604.63 7,447,174.71 136,265.87 26,083,043.71 34,313,088.92 30,636,341.60 15,289,095.91 2,896,189.00 114,396,051.83 163,217,678.34Department of Agriculture and Consumer ServicesDepartment of Business and Professional Regulation 1,500,568.15 901,961.03 1,510,215.35 3,361,506.11 7,274,250.64Department of Children and Families 5,799,837.12 19,341,625.44 3,227,623.80 81,918,177.85 110,287,264.21 10,098.54 37,068.31 408,393.93 11,750,795.45 12,206,356.23Department of Corrections 12,749,411.48 11,644,348.58 6,332,154.60 410,964,353.65 441,690,268.31Department of Economic Opportunity 4,348,311.09 2,628,366.82 761,633.09 21,490,793.90 29,229,104.90Department of Education 9,538,523.88 25,809,843.20 33,141,697.73 248,528,803.48 317,018,868.29 36,989.06 289,062.17 58,009.01 2,719,696.40 3,103,756.64 46,996,311.82 21,275,731.09 7,710,477.34 264,611,740.76 340,594,261.01 5,717,840.65Department of CitrusDepartment of Elder AffairsDepartment of Environmental ProtectionDepartment of Financial Services 3,704,222.25Department of Health 20,532,450.90 1,616,838.54 86,325,700.73 97,364,602.17 32,174,550.36 26,230,317.90 479,443,219.00 558,380,538.16 10,509,712.23 4,254,214.13 106,454,867.05 124,175,652.61 225,322,138.75 269,812,963.06Department of Highway Safety and Motor Vehicles 2,956,859.20Department of Juvenile Justice 4,482,915.70 8,063,402.53 31,944,506.08Department of Law Enforcement 4,958,789.40 7,790,181.58 334,617.70 24,402,919.37 37,486,508.05 162,496.59 546,079.31 120,574.97 12,323,879.27 13,153,030.14Department of Management Services 1,536,347.95 10,411,922.77 730,441.78 49,190,852.71 61,869,565.21Department of Military Affairs 2,055,869.15 4,456,905.02 424,494.07 75,936,051.37 82,873,319.61Department of Revenue 6,516,808.32 9,200,065.21 586,256.52 75,807,755.79 92,110,885.84 656,496.85 1,597,720.17 806,649.70 7,070,560.29 10,131,427.01 1,144,598.89 708,146.48 120,459.65 59,526,923.86 61,500,128.88 185,523,397.82 688,633,345.06 129,414,937.41 5,243,160,206.83 6,246,731,887.12Department of Legal AffairsDepartment of StateDepartment of the LotteryDepartment of TransportationDepartment of Veterans' Affairs 238,788.58 1,449,353.18 2,988,813.63 27,848,491.23 32,525,446.62 50,368.03 125,925.99 13,726.71 1,794,510.70 1,984,531.43Executive Office of the Governor 4,757,417.68 6,377,282.22 551,821.54 85,129,517.52 96,816,038.96Fish and Wildlife Conservation CommissionDivision of Administrative Hearings 3,465,204.75 20,121,743.53 1,871,731.18 98,604,173.12 124,062,852.58Florida Commission on Offender Review 1,644.41 22,389.62 7,720.90 265,634.17 297,389.10Public Service Commission 8,781.08 366,188.08 1,301.68 340,646.05 716,916.89 357,362,341.51 920,825,409.97 263,771,748.87 7,956,607,146.77 9,498,566,647.12*Total* The total agency expenditures for2017-18 represents a 4.9% increasefrom Fiscal Year 2016-17.14OSD Annual Report Fiscal Year 2017-18
Number of Solicitations Posted by Agency in Vendor Bid SystemOSD shares active solicitations with CBEs based on commodity codes. In addition, different solicitationopportunities were also shared from other cities, counties, colleges, and universities at www.dms.myflorida.com/osd. Below are the number of competitive solicitations (above 35,000) that were posted on the Vendor Bid Systemin Fiscal Year 2017-18.Number of Solicitations Posted by Agency in Vendor Bid SystemFor Fiscal Year 2017-18AgencyTotal Solicitations in Vendor Bid SystemAgency for Health Care Administration15Agency for Persons with Disabilities9Department of Agriculture and Consumer Services99Department of Business and Professional Regulation5Department of Children and Families35Department of Citrus1Department of Corrections64Department of Economic Opportunity10Department of Education19Department of Elder Affairs1Department of Environmental Protection58Department of Financial Services11Department of Health44Department of Highway Safety and Motor Vehicles22Department of Juvenile Justice16Department of Law Enforcement6Department of Legal Affairs1Department of Management Services17Department of Military Affairs31Department of Revenue10Department of State9Department of the Lottery2Department of Transportation193Department of Veterans Affairs13Division of Administrative Hearings2Division of Emergency Management3Executive Office of the Governor1Fish and Wildlife Conservation Commission116Total81315OSD Annual Report Fiscal Year 2017-18
The Florida College System Fiscal Year 2017-18The Florida College System (FCS) has participated in the OSD Annual Report since Fiscal Year 2015-16. This year,FCS provided the following information regarding its certified minority business expenditures.FCS Certified Minority Business Expenditures (CMBE)Architectural AndOther ied CategoryCMBECodeAfrican AmericanH 1,303,536.24 95,439.68 905,620.79HispanicI 6,050,110.91 1,747,145.41 1,099,689.31 881,956.04 9,778,901.67Asian AmericanJ 929,841.12 10,674.00 354,010.32 2,184,567.24 3,479,092.68Native AmericanK 256,558.00 16,000.00 0.00 41,566.29 314,124.29American WomenM 4,500,314.13 446,347.78 3,734,640.53 6,299,826.82 14,981,129.26Service Disabled VeteranW 23,890.53 31,309.37 540,079.67 294,855.81 890,135.38 13,0
first time. The Broward Supplier Diversity Day was held on Aug. 25, 2017, at the Broward College North Campus Omni Auditorium, in collaboration with Broward College. Twenty-two governmental entities and professional organizations participated in the event, and a total of 215 attended. In a post-event survey, 91.1