Transcription
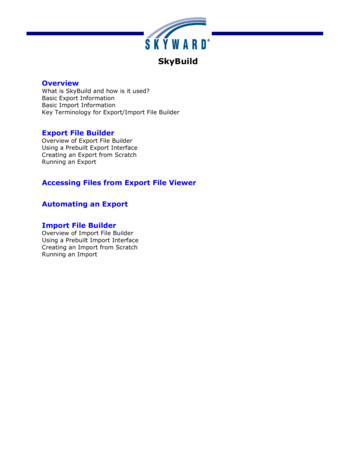
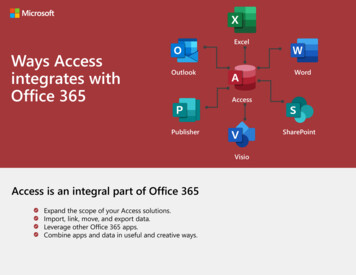
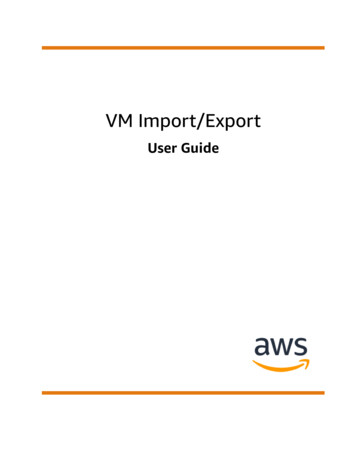
Export/Import ProfileLong Beach, CAThe Port of Long Beach, along with its sister port in Los Angeles, is located on the southernCalifornia coastline. The port is the Nation’s second busiest container port after Los Angeles;combined, the port complex is the eighth busiest container port in the world. In 2011, LongBeach moved more than 6 million 20-ft-equivalent units of containers, nearly 513,000 of which carriedagriculture-related cargo. The port moves a wide variety of cargoes, including petroleum products,electronics, furniture, clothing, grains, and high-valued food products. The port stands as one of themajor gateways for Asian markets. Nearly 5,000 vessels called the Port of Long Beach in 2011.ExportsThe Port of Long Beach moved more than 4.4 million metric tons of agricultural export cargo in 2011,of which over 99 percent of were moved in containers. The commodity with the largest volumewas animal feed, representing approximately 28 percent of the port’s agricultural exports. The topshipping lines included Mediterranean Shipping Co. and Hanjin Shipping, which moved more than 46percent of the port’s agricultural export cargo. The top destination markets for these products wereTaiwan, China, and Japan.U.S. Waterborne Agricultural Exports ThroughLong Beach, CA, 2011Containerized99%Bulk1%Source: Port Import Export Reporting Service (PIERS)1Photo Credit: Courtesy of the Port of Long Beach
Top 10 U.S. Waterborne Agricultural Exports Through Long Beach,CA, 2011CommoditiesMetric Tons Share U.S. ShareAnimal feed1,232,863 28%12%Soybeans743,781 17%2%Grain products, cereal, flour542,031 12%2%Cotton248,3436%17%Meat202,0215%9%Grocery items177,4814%5%Oranges165,9354%28%Bulk grains142,0283%0.4%Dairy products137,5573%16%Hides and skins122,4093%14%Other753,394 17%Total4,467,843 100%3%Source: Port Import Export Reporting Service (PIERS)Top 10 Containerized U.S. Waterborne Agricultural Exports Through LongBeach, CA, 2011CommoditiesMetric Tons*TEU Share U.S. ShareAnimal feed1,232,635 102,369 28%19%Soybeans743,76248,349 17%27%Grain products, cereal, flour539,48335,033 %Grocery k grains141,9578,0873%19%Dairy products136,9189,8363%16%Hides and skins122,3137,4493%14%Other731,27067,021 16%Total4,440,138 356,558 100%13%Source: Port Import Export Reporting Service (PIERS)*Twenty-foot equivalent unit (TEU)2
Top 10 Destination Countries for U.S. Waterborne AgriculturalExports Through Long Beach, CA, her12%Vietnam6%Hong Kong5%Source: Port Import Export Reporting Service (PIERS)Malaysia3%Australia3%Philippines3%Top 10 Shipping Lines Moving U.S. Waterborne AgriculturalExports Through Long Beach, CA, 2011CommoditiesMetric TonsShareMediterranean Shipping1,240,44428%Hanjin rsk260,3476%China Ocean Shipping239,3735%K Line202,6265%NYK Line152,6613%Yang Ming Marine114,0013%Naviera 43100%Source: Port Import Export Reporting Service (PIERS)3
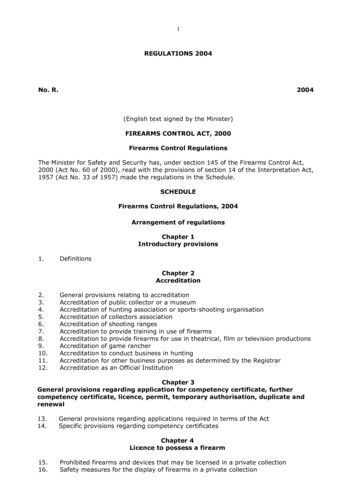
ImportsThe Port of Long Beach moved over 1.9 million metric tons of agricultural import cargo in 2011,with approximately 93 percent in containers. Beverages and beer were the top agricultural imports,representing 21 percent of agricultural imports through Long Beach. Long Beach moved 27 percentof the total canned pineapple and canned fish imports. The port’s top shipping lines includedMediterranean Shipping Co. and Naviera Interamerica; the top origin countries were China andNew Zealand.U.S. Waterborne Agricultural Imports ThroughLong Beach, CA, 2011Containerized93%Bulk7%Source: Port Import Export Reporting Service (PIERS)Top 10 U.S. Waterborne Agricultural Imports ThroughLong Beach, CA, 2011CommoditiesBeveragesBeer, aleCanned pineapllesFruitGrocery itemsCanned fishFrozen fishMeatWineVegetablesOtherTotalMetric Tons Share U.S. Share9%238,835 %715,168 37%1,925,664 100%5%Source: Port Import Export Reporting Service (PIERS)4
Top 10 Containerized U.S. Waterborne Agricultural Imports ThroughLong Beach, CA, 2011CommoditiesBeveragesBeer, aleGrocery itemsCanned fishFrozen fishFruitMeatWineVegetablesGrain products, cereal, flourOtherTotalMetric TonsTEUShare U.S. Share238,83517,322 13%11%176,60116,797 59,2735,3293%4%52,4916,4013%10%691,72463,412 39%1,783,013 156,429 100%6%Source: Port Import Export Reporting Service (PIERS)*Twenty-foot equivalent unit (TEU)Top 10 Origin Countries for U.S. Waterborne Agricultural ImportsThrough Long Beach, CA, 2011China21%Other29%New Zealand7%Korea3%Italy6%Thailand5%American Samoa5%Netherlands5%Australia6%Source: Port Import Export Reporting Service (PIERS)5Chile6%Gulf of Mexico7%
Top 10 Shipping Lines for U.S. WaterborneAgricultural Imports Through Long Beach, CA,2011Shipping LineMediterranean ShippingHamburg SudANL Container LineHanjin ShippingZim Israeli NavigationVeritable Meritime ShippingCMA-CGMPolynesia Lines LtdChina Ocean ShippingOOCLOtherTotalMetric 46289,18081,01568,894457,1181,925,664Source: Port Import Export Reporting Service (PIERS)6Share28%7%6%6%6%6%5%5%4%4%24%100%
major gateways for Asian markets. Nearly 5,000 vessels called the Port of Long Beach in 2011. Long Beach, CA Export/Import Profile Photo Credit: Courtesy of the Port of Long Beach The Port of Long Beach moved more than 4.4 million metric tons of agricultural export cargo in 2011, of which over 99 percent of were moved in containers.