Transcription
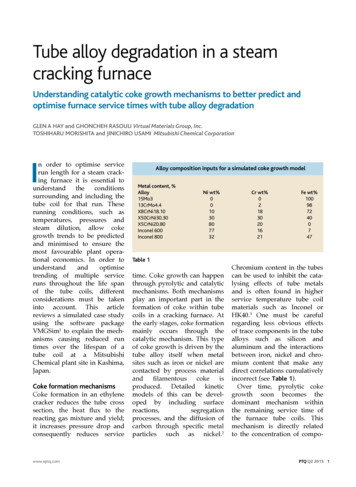
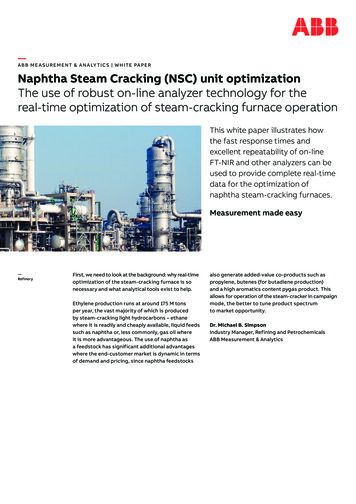
—A B B M E A S U R E M E N T & A N A LY T I C S W H I T E PA P E RNaphtha Steam Cracking (NSC) unit optimizationThe use of robust on-line analyzer technology for thereal-time optimization of steam-cracking furnace operationThis white paper illustrates howthe fast response times andexcellent repeatability of on-lineFT-NIR and other analyzers can beused to provide complete real-timedata for the optimization ofnaphtha steam-cracking furnaces.Measurement made easy—RefineryFirst, we need to look at the background: why real-timeoptimization of the steam-cracking furnace is sonecessary and what analytical tools exist to help.Ethylene production runs at around 175 M tonsper year, the vast majority of which is producedby steam-cracking light hydrocarbons – ethanewhere it is readily and cheaply available, liquid feedssuch as naphtha or, less commonly, gas oil whereit is more advantageous. The use of naphtha asa feedstock has significant additional advantageswhere the end-customer market is dynamic in termsof demand and pricing, since naphtha feedstocksalso generate added-value co-products such aspropylene, butenes (for butadiene production)and a high aromatics content pygas product. Thisallows for operation of the steam-cracker in campaignmode, the better to tune product spectrumto market opportunity.Dr. Michael B. SimpsonIndustry Manager, Refining and PetrochemicalsABB Measurement & Analytics
2N S C U N I T O P T I M I Z AT I O N W h i t e P a p e rQuench/fractionateCH4 (off-gas)Acid gasXXXXCompressionH2S/CO2MethanatorHC H2OLP CH4Cold boxHeavy gas fuel oilC2 fractionatorDeethanizerDepropanizerDebutanizerC2 XXXXXXXXTail-endacetyleneconverterMAPDconverterC3 XXXXC4 hydroC4 recycleC2 recycleC5 plus—The cracking,quenching,compression, andrecovery stages of asteam-cracking unitThe steam-cracking process involves multiplestages including, mainly, the cracking furnace,quench, downstream compression, and recovery /purification. The feed to the cracking furnace ispre-heated and mixed with steam at a controlledcharge rate and steam-to-hydrocarbon ratio, andthen passed rapidly through the radiant sectionof the furnace. The residence time is extremelyshort (of the order of 0.08 to 0.25 seconds)and the cracking temperature high (around750 to 850 C / 1382 to 1562 F). This generatesa huge volume of cracked effluent gas consistingprimarily of ethylene and propylene, but withother co-products as indicated above. This hightemperature gas flow passes initially throughtransfer-line heat exchangers and througha main quench tower to immediately haltfurther reaction and inhibit the build-up of sideproducts. Subsequently, the gas flow passesthrough a multi-stage compressor train andthence to the steam-cracking unit cold sectionfor recovery, separation, and purification.The critical point is that the entire efficiencyand profitability of the steam-cracking unit isdefined by the furnace effluent gas qualityand yield. The downstream stages make the bestof what has been produced, but cannot impactthe furnace itself.The key problem in furnace operation is to balancecracking severity against throughput, propylene /ethylene yield and selectivity, all of which canimpact the gas-make, the capacity of thedownstream separation and compression trainand the risk of unacceptable furnace tube coking.The ideal furnace set-point (for example –measured as the coil outlet temperature [COT])will be, amongst other factors, criticallydependent upon the composition of the liquidnaphtha feed. A relatively light paraffinic naphthawill crack more easily and yield a higher volume ofgas without risk of furnace coking – thus allowinga higher severity setting and yield, up to the limitof the downstream compressor train. A morearomatic naphtha at the same severity wouldseverely reduce furnace run-lengths byexcessive coking.
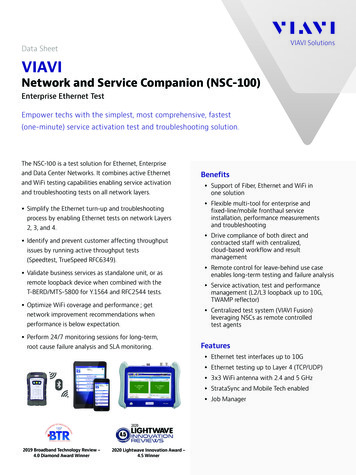
N S C U N I T O P T I M I Z AT I O N W h i t e P a p e r3Naphtha steam crackerFurnace CVs, PVs, analyzer stream dataCOTupdateCoil outlet pressureAnalysis: feed compositionDCSFurnacemodel& RTOAnalysis: effluent compositionSteam-to-feed ratioFeed charge rateSeveritycontrol(APC)Coil outlet temperatureCOT set-point—Furnace severitycontrol using dynamicCOT set-point withfeed composition andeffluent analysisMaintaining ethylene yield% using severitybased control vs operation at constant COTfor variable feed qualityMeasurement at some level is the key to processoptimization. Measurement yields informationwhich allows for the possibility of control. Whatform this measurement takes is a slightly moreopen question, and one subject to considerabledebate between those who like statistics anddislike analyzers (engineers mainly), and thosewho do not trust anything which is not a directlytraceable analytical result (chemists mainly).This leads to various approaches to quiresRequiresThe cycle of measurement and optimizationInformationAPC based on inferential models Use of many basic mass-flow, pressure,and temperature transmitters Requires chemical engineering model of unit Requires lab test data to calibrate andmaintain the inferential quality estimatorAPC based on physical analyzers Use of many single-property physicalanalyzers for direct measurement Requires extensive maintenance, calibration,training, and spares stockholdingAPC based on Advanced Analyzers Use of a smaller number of multi-streammulti-property analyzers Requires calibration or calibrationmodel development Normally offers significant improvementin speed, precision, and reliability
4N S C U N I T O P T I M I Z AT I O N W h i t e P a p e rAPC based on actual process stream quality measurementsfrom real analyzers is superficially attractive but fraughtwith risk.Historically this approach was hindered by: High capital cost Limited reliability, high life-cycle costs Large infrastructural requirementsfor installation Complex operational requirements(calibration, validation)Technical advances have led to: Wider range of available technologies Simpler, more robust, lower cost analyzers Significantly reduced installationand operational demandsThe long maintenance intervals and low life-cycle costs ofFourier-Transform Near IR (FT-NIR) analyzers have offeredone route to deal with part of the problem. Chosen wisely,they offer space-technology levels of reliability and uptime(quite literally because the technology is routinely used inclimate sensing satellites). On-line FT-NIR analyzers nowhave a proven track record in reliable hydrocarbon streamproperty measurement across the full range of refinery andpetrochemical streams from crude distillation to heavy oilupgrading, naphtha conversion, and final product blending.ABB process FT-NIR analyzer TALYS ASP400-ExIn the present case, on-line process FT-NIR analyzers offeran excellent match with the measurements required for liquidnaphtha feed real-time composition monitoring. On thisapplication, they compare very favorably with process gaschromatographs which, for a full PIONA analysis, are simplytoo slow for effective APC update cycles in this fast-movingprocess. On the other hand, GCs (or process massspectrometers) are rather well-suited to post-furnace gaseffluent measurement. For a steam-cracker with a variablenaphtha feed quality, or employing a recycle of C4 backinto the furnace feed, both feed quality and effluent gascomposition are necessary inputs for the furnace RTO.The main compositional measurement required for feednaphtha quality determination is PIONA (% of total paraffins,iso-paraffins, olefins, naphthenes, and aromatics). Thisinformation is provided to a part of the APC system whichacts as a complete furnace simulation and yield predictor.This will typically estimate, for a given severity, the totalgas-make, ethylene/propylene yield, coking index, or similarlydefined parameters. Depending on the particular setup,the furnace simulator and yield estimator may require inputdata as a simpler reduced data set (for example – PIONAand key distillation parameters such as T05, T95), or it mayrequire a full C-number–based breakdown of the entirehydrocarbon composition. Process FT-NIR analyzers are ableto meet both of these requirements effectively. The exactchoice of analyzer platform can be selected to achieve thisin optimal fashion.ABB process FT-NIR analyzer FTPA2000-HP360
N S C U N I T O P T I M I Z AT I O N W h i t e P a p e r5Both analyzer platforms indicated here are Ex zone certified, field-mountable process FT-NIR systems. The main differenceis that the TALYS ASP400-Ex unit is a very compact, single-channel fiber-optic based system ideally suited to PIONA measurementwith very simple installation requirements whereas the HP360 unit is an extractive system with an embedded analysis sampleflow-cell. This latter arrangement does not require the use of fiber-optics and is able to deliver a very precise completeC-number breakdown of the naphtha feed composition when required by the furnace yield simulator.Example Naphtha feed calibration dataPropertyFTIR RFTIR rRange vol%P%0.740.1418 - 53I%0.980.1120 - 55O%(hi)0.170.030 - 12O%(lo)0.080.030 - 1.6PropertyFTIR RFTIR rRange ( C)IBP2.10.2621 to 105T101.20.1735 to 81T301.70.1644 to 93T502.40.250 to 12554 to 143N%0.830.138 - 40T703.30.31A%(lo)0.260.081 - 15T904.90.3267 to 165A%(hi)0.570.080 - 35T957.70.4869 to 185C4 Total0.170.091-6FBP10.90.7376 to 225Typical naphtha feed qualities provided by TALYS ASP400-Ex FT-NIR analyzerPLS Regression calibration plots for PIONA in Naphtha feedFor the FTPA2000-HP360 analyzer system, measurements are made in the 4000 to 4800 cm-1 range of the NIR Combination Region.This allows for very exact isomer discrimination, hence a reliable carbon-number based breakdown of naphtha components.For example, shown above are the spectra of different C6 isomers. The left-hand plot shows spectra of the individualcompounds, which can be seen to be rather clearly differentiated in the position, shape and intensity of Near-IR CombinationRegion absorbance bands. The right-hand plot shows examples of gravimetrically prepared mixtures of the pure compounds.This resembles quite well a typical naphtha-type hydrocarbon spectrum.FT-NIR spectra of 2,3 nemethyl-cyclopentaneFT-NIR spectraof analysed samplesfor calibration set
N S C U N I T O P T I M I Z AT I O N W h i t e P a p e r62-methylpentanePredictions wt/wt%Predictions wt/wt%FT-NIR spectra in the NIR combination region 4000 to 4800 cm -1 for a range of C6 hydrocarbons and the associatedcalibration plots showing near-perfect analysis of the different C6 isomer composition. MethylcyclopentanePredictions wt/wt%Reference values wt/wt%3-methylpentaneReference values wt/wt%CompoundsRange(wt/wt %)R2Uncertainty(wt/wt %)Repeatability(wt/wt %)2,3 Dimethylbutane1 - 150.99920.130.0062-Methylpentane1 - 400.99960.280.0453-Methylpentane1 - 400.99880.460.118n-Hexane1 - 300.99790.430.0190.5 - 260.99970.160.098Methyl-cyclopentaneReference values wt/wt%Calibration plots for 2-methylpentane, methylcyclopentane and 3-methylpentane by FT-NIR analysisThe use of Fourier-transform based Near-IR analyzer platforms for this application allows choice amongst a wide rangeof potential Near-IR spectral regions since it is an inherent feature of this technology that it covers the entire near-infraredrange from 3,700 cm-1 to above 12,000 cm-1 without compromise in resolution or signal-to-noise ratio. Thus, theTALYS ASP400-Ex is suitable for standard applications requiring PIONA feed to the furnace RTO and yield estimator,and the HP360 when full C-number analysis is required (for example – in a full SPYRO TM implementation).Fiber-optic 5m to 300m (16.40 to 984.25 ft)ABB Process FT-NIR analyzer TALYS ASP400-Ex with fiber-optic link to sample flow cell cabinet
N S C U N I T O P T I M I Z AT I O N W h i t e P a p e rField-mount in 3-sided Shelter7Fastloop sample systemProcess take-offABB Process FT-NIR Analyzer FTPA2000-HP360 with fastloop sample conditioning systemIn this white paper we have reviewed the use of robuston-line process FT-NIR analyzer technologies, for thereal-time analysis of liquid naphtha feed to steam-crackingunits used for global scale production of ethylene andpropylene. We have seen that different implementationsof FT-NIR technology can be selected since the applicationrequires full or partial feed quality characterization as feedforward information to the cracking furnace real-timeoptimizer and yield estimator.Properties including PIONA, distillation and a full C- numberbreakdown are available with an analysis cycle time of lessthan 1 minute, comparing very favorably with alternativetechnologies. Other on-line analyzer technologies availablewithin ABB Measurement & Analytics with complementaryapplication in ethylene units include process PGC5000 gaschromatographs for furnace effluent characterizationand the LGR-ICOS off- axis tunable diode laser system forultra-low level acetylene and ammonia detection in finalproduct purified ethylene.References1. Chambers, L.E.; Potter, W.S.; “Ethylene Furnace Design:Part One”, Hydrocarbon Processing, p. 121, January 1974.2. K. Keyvanloo, K.; Towfighi, J.; Sadrameli, S.M.;Mohamadalizadeh, A.; “Investigating the effectof key factors, their interactions and optimizationof naphtha steam cracking by statistical design ofexperiments”, J. Anal. Appl. Pyrolysis 87, 224–230, 20103. Wysiekierski, A.G.; Fisher, G.; Schillmoller,C.M.; “Control coking for olefins plant”,Hydrocarbon Processing, p. 97, January 1999.4. Tecnip Engineering Solutions Briefing Note:“Steam Cracking for Ethylene Production”, Paris, 20085. ABB Application Note, “Model Based SeverityControl for Olefins Plants”, PA Division,Oil Gas & Petrochemicals, 2011Calibration plots showing PIONA analysis by C-number for FTPA2000-HP360 system
—ABB Inc.Measurement & Analytics3400, rue Pie
plus Acid gas XXXX XXXX XXXX 2 NSC UNIT OPTIMIZATION White Paper — The cracking, quenching, compression, and recovery stages of a steam-cracking unit The critical point is that the entire efficiency and profitability of the steam-cracking unit is defined by the furnace effluent gas quality and yield. The downstream stages make the best of what has been produced, but cannot impact the furnace .