Transcription
Regular ArticleLYMPHOID NEOPLASIACirmtuzumab blocks Wnt5a/ROR1 stimulation of NF-kBto repress autocrine STAT3 activation in chroniclymphocytic leukemiaYun Chen,1,2,* Liguang Chen,1,* Jian Yu,1 Emanuela M. Ghia,1 Michael Y. Choi,1 Ling Zhang,1 Suping Zhang,1,3 Elsa Sanchez-Lopez,4,5George F. Widhopf II,1 Karen Messer,1 Laura Z. Rassenti,1 Catriona Jamieson,1,6 and Thomas J. Kipps1,3Moores Cancer Center, University of California, San Diego, La Jolla, CA; 2Edmond H. Fischer Translational Medical Research Laboratory, Scientific ResearchCenter, The Seventh Affiliated Hospital, Sun Yat-sen University, Shenzhen, Guangdong, China; 3Guangdong Key Laboratory for Genome Stability & DiseasePrevention, Department of Pharmacology, International Cancer Center, Shenzhen University Health Science Center, Shenzhen, Guangdong, China; and4Department of Pharmacology and 5Department of Pathology, School of Medicine, and 6Division of Regenerative Medicine, University of California, SanDiego, La Jolla, CAKEY POINTSlNurse-like cellsexpress Wnt5a toinduce ROR1dependent stimulationof NF-kB, which leadsto autocrine IL-6induced STAT3activation in CLL cells.lCirmtuzumab inhibitsWnt5a-induced, ROR1dependent stimulationof NF-kB, and therebyrepresses autocrineIL-6-dependent STAT3activation in CLL.Coculture of nurse-like cells (NLCs) with chronic lymphocytic leukemia (CLL) cells inducedleukemia cell phosphorylation of STAT3 (pSTAT3), which could be blocked by anti-Wnt5aantibodies or the anti-ROR1 monoclonal antibody, cirmtuzumab. Time-course studiesrevealed Wnt5a could induce activation of NF-kB within 30 minutes, but required morethan 3 hours to induce pSTAT3. Culture of isolated CLL cells for 24 hours revealed Wnt5ainduced expression of interleukin 6 (IL-6), IL-8, CCL2, CCL3, CCL4, and CXCL1, which in turncould induce pSTAT3 in unstimulated CLL cells within 30 minutes. We found that Wnt5acould induce CLL cell expression of NF-kB target genes, including IL-6, and that thiseffect could be blocked by cirmtuzumab or drugs that inhibit NF-kB. Examination of CLLcells and plasma collected from patients treated with cirmtuzumab revealed reduced levelsof phosphorylated p65 and diminished expression of NF-kB and STAT3 target genes in CLLcells, as well as lower plasma levels of IL-6, in the samples after therapy. Collectively, thesestudies indicate that Wnt5a/ROR1-dependent signaling contributes to CLL cell activation ofNF-kB, which in turn causes autocrine IL-6-induced activation of pSTAT3. As such, this studydemonstrates that cirmtuzumab can inhibit leukemia cell activation of both NF-kB andSTAT3 in patients with CLL. (Blood. 2019;134(13):1084-1094)IntroductionReceptor tyrosine kinase-like orphan receptor 1 (ROR1) is a developmentally restricted oncoembryonic surface protein that isexpressed on neoplastic cells of many types of cancer,1 includingchronic lymphocytic leukemia (CLL), but not on most normalpostpartum tissues.2 ROR1 can serve as a receptor for Wnt5a, whichcan promote leukemia cell growth and survival,2-4 potentially accounting for the observation that high-level CLL cell expression ofROR1 is associated with early disease progression and shorteroverall survival.5 These properties of ROR1 make it an attractivetarget for therapy of patients with CLL, prompting developmentof a humanized monoclonal antibody, called cirmtuzumab, whichtargets ROR1 and inhibits ROR1-signaling in vitro.4,6-10 A phase Istudy of cirmtuzumab in patients with CLL demonstrated that thisantibody also could inhibit ROR1-signaling in vivo, suppressingleukemia cell activation of r-GTPases and phosphorylation of HS1.11In addition to activation of r-GTPases,4 ROR1 signaling also caninduce recruitment and activation of 14-3-3z,8 HS1,7 DOCK2,61084blood 26 SEPTEMBER 2019 VOLUME 134, NUMBER 13and cortactin,12 each of which also contributes to Wnt5a-induced,ROR1-dependent enhancement of CLL cell proliferation and/ormigration. Wnt5a also has been reported to induce activation ofSTAT3 in melanoma cells13 and activation of NF-kB in the humanembryonic kidney cell line HEK293 in a ROR1-dependentmanner.2 Activation of NF-kB and STAT3 also can enhanceproliferation and/or survival of CLL cells.14-17 Furthermore, activation of STAT3 may enhance expression of ROR1,18 potentiallyproviding a positive feedback loop in which Wnt5a could upregulate the expression of its receptor. However, it is not knownwhether Wnt5a could induce activation of STAT3 or NF-kB inROR1-expressing CLL cells.Also not clear is the principle cellular source or sources forWnt5a. Although hydrophobic amino acids and posttranslationalpalmitoylation provides mature Wnt proteins the capacity to actprimarily as surface proteins tethered to the plasma membrane,19Wnt5a can be found at high levels in the plasma of patients withCLL relative to that of age-matched healthy adults.4,11 The cell 2019 by The American Society of HematologyDownloaded from 3/1084/1223100/bloodbld2019001366.pdf by guest on 12 May 20211
source responsible for the high levels of Wnt5a in plasma ofpatients with CLL is not clear. Although CLL cells themselveshave been noted to express Wnt5a, only 38% of patients havedetectable transcripts of Wnt5a in their leukemia cells.20 Othercandidates include nurse-like cells (NLCs), the nonmalignantaccessory cells residing in the proliferation centers of lymphoidtissue that are derived from monocytes,21,22 which may expressWnt5a.23 Expression of Wnt5a by NLCs implicates that there mostlikely are higher concentrations of Wnt5a in lymphoid tissues thanin the circulation, potentially leading to amplified Wnt5a/ROR1signaling and upregulated expression of ROR1 through the positivefeedback loop within the microenvironment.MethodsCLL specimensBlood samples were collected from Moores Cancer Center patients who provided written informed consent using a protocolapproved by the Institutional Review Board of the University ofCalifornia, San Diego (approval number 090401), in accordancewith the Declaration of Helsinki. Peripheral blood mononuclearcells were isolated by density-gradient centrifugation with FicollPaque PLUS (GE Healthcare Life Sciences), followed by purification with human B Cell Isolation Kit (130-091-151, MiltenyiBiotec Inc.). CLL cells were segregated into “ROR1high” and“ROR1low” subgroups, as described.5 Plasma was collected fromblood samples that had undergone centrifugation for 10 minutesat 187g, and stored at 280 C. Plasma samples and CLL cellswere collected from patients treated with cirmtuzumab inthe phase 1 clinical study of cirmtuzumab (registered atwww.clinicaltrials.gov as #NCT02222688).10Generation of nurse-like cellsPeripheral blood mononuclear cells isolated by Ficoll-PaquePLUS from patients with CLL were suspended in RPMI with20% fetal bovine serum to a final concentration of 2 3 107/mL, asdescribed.21 After 14 days, the nonadherent CLL cells wereremoved by vigorously pipetting the contents of the well,leaving the adherent cells untouched. We observed these cellsto have the morphology typical of NLC via microscopy.MaterialsWe obtained BAY 11-7082 (S2913) from Selleckchem. Humanrecombinant Wnt5a (645-WN) was from R&D Systems. Wnt5awas suspended in sterile PBS containing 0.1% bovine serumalbumin at 100 mg/mL.TARGETING Wnt5a/ROR1 ACTIVATION OF NF-kB IN CLLImmunoblot analysis was performed as described.2 Primarymonoclonal antibody (mAb) for ROR1 (#4102), Phospho-STAT3(Tyr705; #9145), STAT3 (#4904), phospho-p65 (#3033), phosphoIkBa (#9246), p65 (#8242), and IkBa (#4814) were obtained fromCell Signaling Technology. Secondary antibody conjugated withhorseradish peroxidase was from Cell Signaling Technology.Flow cytometryFlow cytometry analysis was performed as described.2,11 AntiROR1 mAb (4A5) conjugated with Alexa Fluor 647 (4A5-AlexaFluor 647) was generated in our laboratory. 4A5 is a non–crossblocking mAb specific for a ROR1 epitope distinct from thatrecognized by cirmtuzumab.2 Anti-CD19-PerCP, anti-CD5-FITC,anti-pSTAT3 Y705-PE, and anti–CXCR4-APC antibodies werefrom BD Biosciences. The molecules of ROR1 per cell weredetermined with the Quantum MESF (Molecules of EquivalentSoluble Fluorochrome) microspheres. Alexa Fluor 647 conjugated beads were run on the same day as stained cell samplesto establish a calibration curve relating channel values to MESFunits, or DMFI.ELISAIL-6 in plasma or medium was detected by Human IL-6 ELISA(enzyme-linked immunosorbent assay) kit (430504; BioLegend).Wnt5a was detected by Human WNT5A ELISA kit (OKEH00723;Aviva Systems Biology).Human cytokine assayCLL cells were cultured with or without Wnt5a (200 ng/mL) orcirmtuzumab (10 mg/mL) or anti-Wnt5a antibody (MAB645; R&DSystems) (5 mg/mL) in RPMI culture-media, which were analyzedby Proteome Profiler Human Cytokine Array Kit (ARY005B; R&DSystems), as per the manufacturer’s instructions.NF-kB target gene expressionWe used the RT2 Profiler PCR (polymerase chain reaction) Arrayfor human NF-kB signaling targets (PAHS-225ZA; Qiagen) toprofile the expression of 83 NF-kB target genes. Real-time PCRwas performed per the manufacturer’s instructions. The threshold(CT) value for each gene in the array was normalized to theaverage CT value of 4 housekeeping genes. The Volcano Plotsand ClusterGram Heatmap were generated using the Qiagendata analysis center data-analysis-center-overview-page/), as per thevendor’s instructions.Quantitative reverse-transcription PCRTotal RNA was extracted using Trizol (Life Technologies). A10-mg volume of total RNA was incubated with 10 U RNase-freeDNase I (Life Technologies) for 30 minutes at 37 C. RNA wasfurther purified with an RNeasy Mini Kit (QIAGEN, Hilden,Germany). The purified total RNA (2 mg) was reverse transcribedwith Superscript III Reverse Transcriptase (Life Technologies).Taq 23 Master Mix (NEB) was used for the PCR, per the manufacturer’s protocol. SYBR Green PCR Master Mix (Thermo FisherScientific) and 7900HT Fast Real-Time PCR System (AppliedBiosystems,) were used for real-time PCR, per the manufacturer’sprotocol. The expression level of WNT5A transcripts was calculated using ACTB.blood 26 SEPTEMBER 2019 VOLUME 134, NUMBER 131085Downloaded from 3/1084/1223100/bloodbld2019001366.pdf by guest on 12 May 2021Among circulating CLL cells, the relative expression CD5 andCXCR4 can be used to distinguish between leukemia cells thatrecently have exited from the lymphoid tissue microenvironment(CD5high CXCR4dim) and leukemia cells that may be poised toreenter the lymphoid compartments (CXCR4high CD5dim).24,25Prior studies demonstrated that circulating CXCR4dim CD5highCLL cells express higher levels of genes upregulated in leukemiacells present in lymphoid tissues than blood CXCR4high CD5dimCLL cells of the same patient,24 providing a means with which toassess how the lymphoid microenvironment influences CLL cellgene-expression. We examined whether CXCR4dim CD5high CLLcells have higher levels of activated STAT3 and ROR1 comparedwith CXCR4high CD5dim CLL cells.Immunoblot analysis
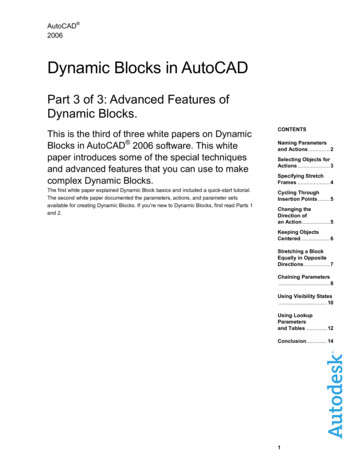
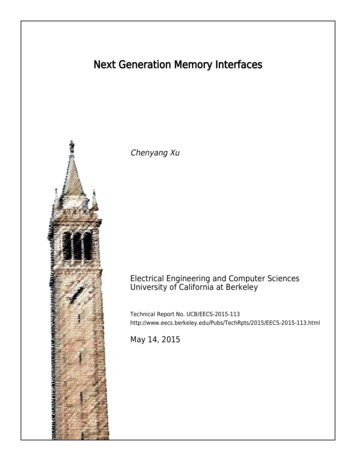
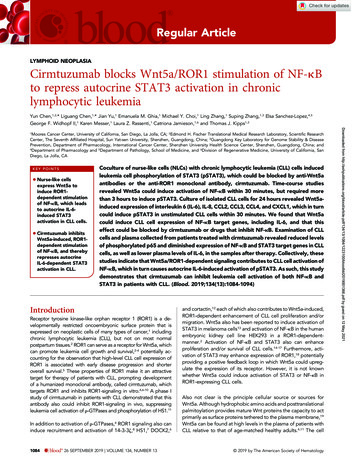
Gene set enrichment analysisStatistical analysesData are presented as the mean 6 standard deviation. Differences between 2 groups were determined by 2-tailed Studentt test. Significance was analyzed by GraphPad Prism 6.0 (GraphPadSoftware Inc.), and P , .05 was considered significant.ResultsThe expression of ROR1 and phosphorylation ofSTAT3 are higher in CD5high CXCR4dim CLL cells thantheir CD5dim CXCR4high counterpartsWe examined 24 CLL cell samples that expressed high(ROR1high, N 5 12) or low (ROR1low, N 5 12) levels of surfaceROR1 (supplemental Table 1, available on the Blood Web site),as per a previously defined theshold,4 which subsequently wasnoted to correspond to 4 3 103 molecules of ROR1 per cell.11CLL cells were stained with antibodies specific for CD5 orCXCR4. CD5high CXCR4dim and CD5dim CXCR4high subpopulations were electronically gated for analysis of the relativeexpression of other proteins by these subpopulations. The levelsof ROR1 and pSTAT3 were determined in each gated subpopulation. We noted that CD5high CXCR4dim CLL cells, whichpresumably had recently exited the lymph node, had higherlevels of ROR1 and pSTAT3 than the CD5dim CXCR4high counterpart CLL cells (Figure 1A-C; supplemental Table 1), althoughthe difference in the levels of ROR1 between such subpopulations did not reach statistical significance for ROR1lowsamples (Figure 1B). Consistent with the notion that CLL cellsexiting the lymph nodes may have higher levels of activatedSTAT3 than those circulating in the blood is our gene set enrichment analyses of the published transcriptome data on CLLcells isolated from the lymph node and blood of 17 patients.16This analysis revealed that the expression levels of STAT3-targetgenes (N 5 97) were significantly higher in CLL cells isolatedfrom the lymph node than in CLL cells isolated from the bloodof the same patients (NES 5 1.30; FDR q 5 0.08; Figure 1D).NLCs induce CLL cell activation of STAT3 andupregulation of ROR1 via Wnt5aWe cultured NLCs with CLL cells from each of 6 patients withROR1high CLL and 6 patients with ROR1low CLL, using an established coculture system.29 The levels of ROR1 and pSTAT31086blood 26 SEPTEMBER 2019 VOLUME 134, NUMBER 13were determined by flow cytometry. CLL cells cocultured withNLC had increased pSTAT3 in both ROR1high and ROR1lowsamples (Figure 2A-C). Although ROR1high CLL cells coculturedwith NLC had increased levels of ROR1, the upregulation ofROR1 in ROR1low CLL cells cocultured with NLC was not statistically significant (Figure 2B). Activation of STAT3 and upregulation of ROR1 in ROR1high CLL cells were blocked respectivelyby adding the anti-ROR1 mAb, cirmtuzumab, or neutralizingantibodies to Wnt5a at the initiation of culture (Figure 2A-C).Consistent with the notion that NLCs were the principle sourceof Wnt5a, we noted that isolated NLC expressed significantlyhigher amounts of WNT5A than the CLL cells of the samepatient (Figure 2D). Moreover, we detected higher amountsWnt5a in the culture supernatants of isolated NLC than in thesupernatants of cultures containing similar numbers of CLL cells(Figure 2E).Wnt5a/ROR1 induces production ofproinflammatory factors that inducephosphorylation of STAT3 and upregulation ofROR1 in CLL cellsWe stimulated CLL cells with exogenous Wnt5a for 0 to 6 and24 hours in the presence of control IgG or cirmtuzumab. Celllysates were analyzed by immunoblot for pSTAT3 (Y705) andtotal STAT3. This revealed that Wnt5a induced phosphorylationof STAT3 in ROR1-positive CLL, and that this effect could beblocked by cirmtuzumab (Figure 3A). The capacity of Wnt5a toinduce pSTAT3 was less apparent in CLL cells that lackedexpression of ROR1 (supplemental Figure 1). Wnt5a also enhanced expression of ROR1 on ROR1-positive CLL cells, butdid not induce expression of ROR1 on CLL cells that lackedROR1 (supplemental Figure 2). Time course studies revealedlatent induction of pSTAT3, which first was detected 3 hoursafter stimulation with Wnt5a. Because of this latent induction,we hypothesized that the capacity of Wnt5a to induce activation of STAT3 in CLL cells was indirect, being caused bya factor or factors made by isolated CLL cells on stimulationby Wnt5a.We examined harvested supernatants of CLL cells cultured withor without Wnt5a, using a human cytokine array. Multipleproinflammatory factors including IL-6, IL-8, CCL2, CCL3, CCL4,and CXCL1 were detected in the medium of CLL cells culturedfor 24 hours with Wnt5a that either were not detected or werefound at significantly lower levels in the medium of CLL cellscultured without Wnt5a (Figure 3B). Cirmtuzumab inhibited thecapacity of Wnt5a to induce CLL cells to generate most of thesefactors (Figure 3C). The medium harvested from CLL cells cultured with Wnt5a, but not the medium of CLL cells culturedwithout Wnt5a, could induce pSTAT3 within 30 minutes inserum-starved CLL cells; this effect could be inhibited by theanti-IL-6-receptor mAb, tocilizumab (Figure 3D). The conditioned medium also induced upregulation of ROR1 in ROR1highCLL cells; this effect also could be inhibited by tocilizumab, butnot by neutralizing antibodies specific for Wnt5a (supplementalFigure 3). We used exogenous Wnt5a, IL-6, IL-8, CCL2, CCL3,CCL4, or CXCL1 to stimulate serum-starved CLL cells for30 minutes, and found IL-6 was the most potent early inducer ofpSTAT3 (supplemental Figure 4). IL-6 could induce pSTAT3 inCLL cells independent of the expression of ROR1 (supplementalFigure 5), but it could only upregulate the level of ROR1 on CLLCHEN et alDownloaded from 3/1084/1223100/bloodbld2019001366.pdf by guest on 12 May 2021We performed gene set enrichment analysis (GSEA) of STAT3target genes in matched lymph nodes and peripheral blood CLLcells collected from 17 patients previously included in a study byHerishanu et al.16 Peripheral blood mononuclear cells of 3 CLLsamples were collected before therapy (Pre-Rx) and at day 28(D28) of cirmtuzumab treatment. Each D28 sample was collectedafter patients had received 2 doses of 16 mg/kg cirmtuzumab.Negative isolation of CLL cells to more than 95% purity wasperformed before RNA isolation. Total RNA was extracted usingTrizol reagent (Life Technologies). RNAseq data were analyzedas described.11 Using GSEA software,26 we conducted GSEA onthe primary RNAseq data from CLL cells isolated from patientsbefore therapy (Pre-Rx) and at D28 of cirmtuzumab treatment.We focused our attention on changes in the NF-kB27 and STAT328target genes. Each gene set was considered significant when thefalse discovery rate (FDR) was less than 25%.26 The FDR q valuewas adjusted for gene set size and multiple hypothesis testing.
A104Isotype1010210CD5 dimCXCR4 high001010210310410 102 103 1040CXCR4BROR1100pSTAT3 MFI60p 0.075140p 0.0001Downloaded from 3/1084/1223100/bloodbld2019001366.pdf by guest on 12 May 2021ROR1 MFI10 102 103 104C20p 0.000180p 0.000160p 0.000140200ROR1CD5CXCR4HighDimHighDEntichment score0pSTAT3 Y705p 0.000180Ranked listIsotypeCD5 highCXCR4 dim3CD5Figure 1. CD5high CXCR4dim CLL cells express higherlevels of ROR1 and phosphorylated STAT3 than CD5dimCXCR4high counterparts. (A) Flow cytometry analysis ofpSTAT3 (Y705) and ROR1 in CD5high CXCR4dim and CD5dimCXCR4high CLL cells. (B) Dot figures representing ROR1intensity in CD5high CXCR4dim and CD5dim CXCR4high CLLcells from ROR1high (n 5 12) and ROR1low (n 5 12) patients.Error bars denote standard deviation. (C) Bar figuresrepresenting pSTAT3 DMFI in CD5high CXCR4dim andCD5dim CXCR4high CLL cells from ROR1high (n 5 12) andROR1low (n 5 12) patients. Error bars denote standarddeviation. (D) GSEA plot of STAT3 target genes in lymphnodes vs peripheral blood CLL cells collected from17 patients. The gene set size was 97, the normalizedenrichment score (NES) was 1.30, and the false discoverayrate (FDR) q value was ighDimHighHighHighDimLowDimHighLowHighDimSTAT3 targets0.30.20.102 Positively correlated10-1Negatively correlated05000 10000 1500020000Ranked in ordered datasetEnrichment profileHitsRanking metric scorescells that already expressed ROR1 (supplemental Figure 6).Because IL-6 is a target gene of STAT3, we considered whetherthe increased expression of IL-6 might be a consequence ofSTAT3 activation, rather than a cause. Using reverse transcription PCR on RNA isolated from cultured CLL cells, we detectedincreased levels of IL6 within 1 hour of treatment with Wnt5abefore the noted phosphorylation of STAT3. As such, the induced expression of IL6 preceded the 3 or more hours requiredfor Wnt5a to induce CLL cell activation of STAT3 (Figure 3E).Similarly, we detected IL-6 by ELISA in the media of CLL cellswithin a few hours after adding exogenous Wnt5a (Figure 3F).These data indicate that the activation of STAT3 largely wascaused by autocrine IL-6, which was expressed after Wnt5ainduced activation of ROR1 signaling.TARGETING Wnt5a/ROR1 ACTIVATION OF NF-kB IN CLLWnt5a induces production of proinflammatoryfactors via activation of NF-ĸBPrior studies noted that NLC could stimulate CLL cells to activateNF-kB,20-32 which in turn could influence expression of the genesencoding many of the cytokines and chemokines we found wereinduced by Wnt5a.33 We hypothesized that Wnt5a expressed byNLC could contribute to CLL cell activation of NF-ĸB. First, wefound that Wnt5a indeed could induce phosphorylation of p65and IkBa in CLL cells that expressed ROR1 (Figure 4A). Moreover, the capacity of Wnt5a to induce activation of NF-kB in CLLcells could be blocked by cirmtuzumab or neutralizing antibodies specific for Wnt5a (Figure 4A). As anticipated, we foundthat NLC also could induce phosphorylation of p65 in bothblood 26 SEPTEMBER 2019 VOLUME 134, NUMBER 131087
ABp 0.0001150p 0.0001p 0.0001IsotypeROR1 MFIw/o NLC NLC Control IgG NLC Anti-Wnt5a NLC Cirmtuzumab100p 0.4253p 0.241350p 0.47550010 102 103 10410 102 103 1040pSTAT3 Y705ROR1NLCControl IgGAnti-Wnt5aCirmtuzumabHigh––––D ––Low – – –– –––– –– – – –– Ep 0.0001p 0.0001100p 0.291350p 0.0081p 0.27080ROR1NLCControl IgGAnti-Wnt5aCirmtuzumabHigh–––– –– – ––––– –– – –p 0.0047 –– NLCCLLp 0.00010.82001000p 0.00010.6p 0.00010.40.20CLLLow –– 300Wnt5a (ng/ml)pSTAT3 MFI150mRNA relative expressionp 0.0001NLCct1h2h5hCulture timeFigure 2. NLC Express Wnt5a, which can induce ROR1-dependent CLL cell activation of STAT3 and upregulation of ROR1. (A) Flow cytometry analysis of pSTAT3 (Y705)and ROR1 in CLL cells cocultured with or without NLC for 16 hours with control IgG or anti-Wnt5a or cirmtuzumab. (B) Bar figures represent the intensity of ROR1 staining ofCLL cells from ROR1high (n 5 6) and ROR1low (n 5 6) patients cocultured with or without NLC for 16 hours in the presence of control IgG, anti-Wnt5a, or cirmtuzumab. Error barsdenote standard deviation. (C) Bar figures represent the levels of pSTAT3 DMFI in CLL cells from ROR1high (n 5 6) and ROR1low (n 5 6) patients cocultured with or without NLCfor 16 hours in the presence of control IgG, anti-Wnt5a, or cirmtuzumab. Error bars denote standard deviation. (D) Quantitative real-time PCR analysis and comparisonof WNT5A transcript levels in NLC vs CLL cells of the same patient (n 5 11). Error bars denote standard deviation. (E) ELISA of Wnt5a in the medium of cell culturescontaining 1 3 10 4 /mL NLC and 1 3 10 4 /mL CLL cells for 0, 1, 2, and 5 hours. Error bars denote standard deviation (n 5 3).ROR1high and ROR1low CLL cells (Figure 4B; supplemental Figure 7). Unexpectedly, however, we found that cirmtuzumab oranti-Wnt5a antibodies caused near-complete suppression ofthe p65 phosphorylation in ROR1high CLL cells induced by coculture with NLC, which elaborate factors, such as APRIL orBAFF, that also could activate NF-kB (Figure 4B; supplementalFigure 7).30-32 As such, these studies reveal that Wnt5a may bea primary factor involved in NLC-induced activation of NF-kB inROR1-expressing CLL cells.We reasoned that the capacity of anti-Wnt5a or cirmtuzumab toinhibit the activation of STAT3 in CLL cells was a result of theproduction of cytokines induced by activation of NF-kB. Consistent with this notion, we observed that levels of IL-6 releasedinto media were elevated in ROR1high CLL cells cocultured withNLC, which could be inhibited by anti-Wnt5a or cirmtuzumab,but not in ROR1low CLL cells (supplemental Figure 8). Also,a small molecule inhibitor of NF-kB, BAY 11-7082, could inhibit Wnt5a-induced CLL cell production of IL-6 and activation of1088blood 26 SEPTEMBER 2019 VOLUME 134, NUMBER 13STAT3 (Figure 4C-D). Furthermore, we found that Wnt5a couldinduce CLL cells to enhance expression of NF-kB target genes,including IL6, and that this effect could be blocked by cirmtuzumab (Figure 4E-F). We also examined this effect in MEC1,which is a human cell line derived from CLL that does not expressROR1. Previously, we demonstrated that MEC1 cells transfectedto express ROR1 (MEC1-ROR1 cells) had higher rates of cellproliferation and more effective chemokine-directed migrationthan parental MEC1 cells.4 In this study, we found that MEC1ROR1 had higher levels of phosphorylated p65 and STAT3, andsecreted higher amounts of IL-6 into the media, than MEC1 cells(supplemental Figure 9A-B). Furthermore, knockout of IL6Rreduced the levels of activated STAT3 in MEC1-ROR1 cells(supplemental Figure 9C-D).Treatment with cirmtuzumab inhibits CLL cellactivation of NF-kB and STAT3To examine the in vivo significance of our findings, we collectedplasma and CLL cells from patients treated with cirmtuzumab inCHEN et alDownloaded from 3/1084/1223100/bloodbld2019001366.pdf by guest on 12 May 2021CROR1
Control IgG0Wnt5a (hours)12342.0Cirmtuzumab6 245012345Ratio of density(pSTAT3/tSTAT3)A6 24pSTAT3(Y705)Total STAT3Relative density000 0.2 0.3 0.5 0.7 1.5 00000Control IgGCirmtuzumab1.5p 0.0001p 0.0001p 0.0017p 0.0412p 0.00751.00.500 0.1 0.10 1 2 3 4 5 6 24Treatment time (hour)CLL1ControlCCLL2Wnt5a0Wnt5aControlWnt5a Wnt5a Wnt5a Control IgG Cirmtuzumab CL1IL-6IL-8CXCL1IL-6IL-8CXCL10 1.0 0.1 0.9 0pSTAT3(Y705)EFTimeIL-6Total STAT3 -actinControl medium –– Conditioned medium–– ––IL-6–––– Tocilizumab– – – IL-6 -actin0 1 2 3 4 5500CLL1CLL2Control IgGCirmtuzumab4003002001000012345678Treatment time (hour)Figure 3. Wnt5a/ROR1 induces production of proinflammatory factors that lead to phosphorylation of STAT3 in CLL cells. (A) Immunoblot analysis of anti-pSTAT3(Y705)or anti-STAT3 in lysates of CLL cells treated with Wnt5a (200 ng/ml) for 0-6 hours or 24 hours in the presence of control IgG or cirmtuzumab. Bar figures represent ratios of density(pSTAT3/Total STAT3). (B) Wnt5a/ROR1 induced production of cytokines in CLL cells. The medium of CLL cells cultured with or without Wnt5a for 16 hours was analyzed by thehuman cytokine array. (C) Cirmtuzumab or neutralizing anti-Wnt5a antibodies blocked Wnt5a-induced cytokine production in CLL cells. The medium of CLL cells cultured with orwithout Wnt5a, in the presence of control IgG, cirmtuzumab, or anti-Wnt5a was analyzed by the human cytokine array. (D) Immunoblot analysis of anti-pSTAT3 (Y705) or antiSTAT3 in lysates of CLL cells treated with control medium, conditioned medium, or IL-6. Tocilizumab or control IgG was added to the CLL cultures 2 hours before treatment. Thenumbers on the top indicate the relative density of pSTAT3/Total STAT3. The density of the sample treated by conditioned medium only (the 3rd lane) was considered as 1.0. (E)Reverse transcript PCR analysis of IL-6 and b-actin in RNA isolated from purified CLL cells treated with Wnt5a (200 ng/mL) in 0 to 5 hours. (F) ELISA of IL-6 in medium of isolatedCLL cells cultured with Wnt5a for 0 to 8 hours in the presence of cirmtuzumab or control IgG (n 5 5).a phase 1 clinical trial.11 Immunoblot and RNAseq, respectively,were used to examine for activation of NF-kB and the transcriptomes of negatively selected CLL cells. ELISA was usedto evaluate the concentrations of IL-6 in plasma collectedbefore and after treatment with cirmtuzumab. Consistent withour in vitro findings, cirmtuzumab downregulated CLL cellexpression of NF-kB and STAT3 target genes in vivo (Figure5A) and reduced the levels phosphorylated p65 and STAT3detected in the CLL cells of treated patients (Figure 5B). Thelevels of IL-6 in plasma also were decreased significantly inpatients after treatment with this antibody (Figure 5C; supplemental Table 2).DiscussionIn this study, we found that NLC could induce Wnt5a/ROR1dependent activation of NF-kB in CLL, which in turn elicitsTARGETING Wnt5a/ROR1 ACTIVATION OF NF-kB IN CLLautocrine IL-6-induced activation of STAT3. First, we found thatlevels of ROR1 and pSTAT3 were higher in circulating CD5highCXCR4dim CLL cells than in CD5dim CXCR4high CLL cells in any1 patient, suggesting that ROR1 and pSTAT3 may be higherin CLL cells within the leukemia microenvironment presentin lymphoid tissues. We found NLC-induced Wnt5a/ROR1dependent activation of STAT3 and upregulation of ROR1in ROR11 CLL cells by inducing the leukemia cells to produceproinflammatory cytokines, predominantly IL-6, through theactivation of NF-kB.Prior studies revealed that NF-ĸB may be constitutively activatedin patients with CLL, thereby contributing to disease progressionand CLL-cell resistance to apoptosis.15 CLL cells present in themicroenvironment are more likely to have activated NF-ĸB thanthe CLL cells in the circulation.16 Activation of NF-ĸB in CLL wasconsidered a consequence of CLL-cell exposure to factors suchblood 26 SEPTEMBER 2019 VOLUME 134, NUMBER 131089Downloaded from 3/1084/1223100/bloodbld2019001366.pdf by guest on 12 May 2021DControlIL-6 pg/mlB
ABWnt5aCirmtuzumab–– –– Control lgGNLCCirmtuzumabAnti-Wnt5aPhospho-p65p65 ––––– –––– ––– –– – Phospho-p65Phospho-I B p65I B 1.0 1.0 0.9 2.6 1.2 1.2 -actinC5004003002001000 20 10 5Total STAT3Wnt5a– ––51020EF-log10 (p-value)5Control vs. Wnt5a Control IgG432p 0.0510-2.5 02.557.5 10Control vs. Wnt5a Cirmtuzumab2.5-log10 (p-value) –pSTAT3(Y705)BAY 11-7082 ( M)21.5p 0.0510.50-10 -8-6-4-202Log2 (fold change)UpregulatedUnchangedDownregulated1 2 TGS2C3NFKB2STAT3BIRC3RELBas BAFF and/or APRIL, as well as B-cell receptor signaling, whichare more prominent in the microenvironments of lymphoidti
1Moores Cancer Center, University of California, San Diego, La Jolla, CA; 2Edmond H. Fischer Translational Medical Research Laboratory, Scientific Research Center, The Seventh Affiliated Hospital, Sun Yat-sen University, Shenzhen, Guangdong, China; 3 Guangdong Key Laboratory for Genome Stability & Disease