Transcription
2020Analysis of SupplyChain ModelsFor Maize, Rice, Beans & Cassava Sub-sectorsin Selected Areas of TanzaniaSUBMITTED BY SUNDY MERCHANT CO. LTD DODOMATO AGRA-D’SALAAM
TABLE OF CONTENTSTABLE OF CONTENTS . 1LIST OF FIGURES . 2LIST OF ACRONYMS . 3EXECUTIVE SUMMARY . 41.0 INTRODUCTION . 61.11.21.31.3BACK GROUND INFORMATION . 6OBJECTIVE OF THE ASSIGNMENT . 6REPORT CONTENTS . 6OVERVIEW OF THE SUB-SECTORS . 72.0 RANKING OF SUBSECTOR BY REGIONS . 83.0 ANALYSIS OF SUPPLY CHAIN MODELS . 83.1 Maize Supply Chains . 93.1.1 Existing Supply Chains for Maize . 93.1.2 Value Created and Value Captured . 113.1.3 Challenges in Existing Maize Supply Model . 123.1.4 Recommended Supply Chain Model for Maize. 133.2 CASSAVA SUPPLY-CHAINS MODELS . 143.2.1 Existing Supply-Chains for Cassava . 143.2.3 Recommended Supply-chain for Cassava . 173.3 PADDY SUPPLY MODELS . 193.3.1 Existing Supply Chain for Paddy . 193.3.2 Value Created and Captured . 223.3.3 Recommended Supply Chain Model for Paddy . 243.4 BEANS SUPPLY-CHAINS MODELS . 253.4.1 Existing Supply Chain for Beans . 253.4.2 Value Created and Captured . 273.4.3 Recommended Supply Chain Model for Beans . 284.0 RECOMMENDED DEVELOPMENT STRATEGIES AND INTERVENTIONS . 294.1 SUPPLY CHAIN DEVELOPMENT STRATEGIES. 294.2 PROPOSED STRATEGIC ACTIONS. 30ANNEX 1: PADDY PRODUCTION COSTS RETURNS AND BREAK-EVEN POINTS . 33ANNEX 10: PRICES PAID TO MAIZE FARMERS AND AGENTS THROUGH DIFFERENT SUPPLY-CHAIN MODELS . 39ANNEX 11: PRICES PAID TO BEANS FARMERS AND AGENTS THROUGH DIFFERENT SUPPLY-CHAIN MODELS . 40ANNEX 12: PRICES PAID TO CASSAVA FARMERS AND AGENTS THROUGH DIFFERENT SUPPLY-CHAIN MODELS. 41ANNEX 13: NAMES AND CONTACTS OF INTERVIEWEES . 411
LIST OF FIGURESFIGURE 1: EXISTING SUPPLY-CHAIN MODELS FOR MAIZE . 7FIGURE 2: RECOMMENDED AGGREGATION MODEL FOR MAIZE . 9FIGURE 3: SUPPLY CHANNEL A FOR CASSAVA . 14FIGURE 4: SUPPLY CHANNEL B FOR CASSAVA . 14FIGURE 5: SUPPLY CHANNEL C FOR CASSAVA . 15FIGURE 6: SUPPLY CHANNEL D FOR CASSAVA . 15FIGURE 7: SUPPLY CHANNEL E FOR CASSAVA . 11FIGURE 8: PRIVATE SECTOR DRIVEN SUPPLY CHAIN MODEL . 18FIGURE 9: CASSAVA SEEDS SUPPLY CONSORTIUM MODEL . 14FIGURE 10: EXISTING SUPPLY-CHAIN MODELS FOR PADDY . 19FIGURE 11: PRODUCERS GROUPS DRIVEN COLLECTIVE MARKETING MODEL . 21FIGURE 12: UMBRELLA ASSOCIATION DRIVEN COLLECTIVE MARKETING MODEL . 21FIGURE 13: RECOMMENDED AGGREGATION MODEL FOR PADDY . 192
LIST OF ACRONYMSAGRAAlliance for a Green Revolution in AfricaAMCOSAgriculture Marketing Cooperative SocietyBRITENBuilding Rural Incomes Through EnterpriseDRCDemocratic Republic of the CongoFAOFood and Agriculture OrganizationFDGFocus Group DiscussionFMCFarmer Marketing CentreGAPGood Agricultural PracticesHQCFHigh Quality Cassava FlourMIVARFMarket Infrastructure, Value Addition and Rural FinanceMTMetric TonsNFRANational Food Reserve AgencyNGONon-Government OrganizationPOSPoint of SaleRUDIRural and Urban Development InitiativeSACCOSSavings and Credit Co-Operative SocietySMEsSmall and Medium EnterprisesSPVSSpecial Purpose VehicleUNCDFUnited Nations Capital Development FundUSDUnited States DollarVSLASVillage Savings and Loan AssociationsWFPWorld Food ProgrammeWRSWarehouse Receipt System3
EXECUTIVE SUMMARYAgriculture is the predominant economic activity in Tanzania with over 80% of the households engagedin agricultural and related activities. Among of the major crops produced is maize, paddy, cassava andbeans. The leading productive regions are Kagera, Kigoma, Katavi, Rukwa, Njombe, Ruvuma, Iringa, andMbeya. Alliance for Green Revolution in Africa (AGRA) that works in Tanzania and other African countriesis focused on putting smallholder farmers at the center of the continent’s growing economy bytransforming agriculture from a solitary struggle to survive into farming as a business that thrives. Amongof the AGRA strategies is to support establishment of inclusive, competitive and sustainable business andsupply chains that will enable the small holders to overcome the existing systemic challenges in the valuechains of maize, paddy, cassava and beans in Tanzania.As among of the strategic activities for implementing the strategy, AGRA assigned Sundy MerchantsCompany Limited to conduct a survey of the existing supply chains for the sub-sectors targeted andpropose models that will inclusively take all stakeholders in the sub-sectors on-board effectively andefficiently. The purpose of the assignment was to critically analyse existing marketing models for maize,rice, beans and cassava and provide a strategy for market linkages in areas where AGRA is developingcomprehensive market led interventions which will enable Tanzania smallholder farmers be sustainablylinked to profitable structured markets for their excessive produce. Before going into analyzing thesubsectors, the ranking of the sub-sectors were performed based on the production levels. It wasobserved that leading producers (in chronological order i.e. 1st, 2nd , 3rd etc) are; For maize-Rukwa, Mbeya,Njombe Iringa and Ruvuma; For Paddy-Katavi, Mbeya and Ruvum; For beans- Kigoma, Kagera, Rukwa,Iringa and Mbeya, and; For Cassava-Kagera, Kigoma, Ruvuma and Mbeya. The market analysis focuses onthe existing supply chains for each crop by portraying the institutional relations among the actors, powerrelations, effectiveness and efficiency of the models, opportunities and challenges and the gains inrelation to costs and margins resulting from value creation and value captured by each actor.Two main models have observed for maize aggregation models; (i) spot market deals, and; (ii) collectivemarketing. There is significant improvements of value created and captured through collectiveaggregation and selling compare to sport marketing. While at farmers level value created remains thesame at USD 0.21 kg in the two supply channels, same created value results into increase of 6% incollective marketing arrangements. Collective aggregation and linkages model has potentials for enablingactors to function under inclusiveness arrangements with an assurance of sustainability and economicbenefits to each of the actors. Basically cassava has five major supply chains and all originate from farmersand passes through several layers of intermediaries (large-scale aggregators, small-scale aggregators/processors, local large buyers, importers, , urban markets, rural markets, aggregation groups, and finalconsumers). Two models were recommended for cassava. First-comprises of three supply channelstargeting the production and marketing of cassava flour products, production of HQCF and production ofanimal feeds, and; the second-involved cooperative driven model operating from Farmer MarketingCenters through Public-Private-Producer Partnership.Further, paddy marketing assessment revealed two existing supply chain models, namely spot marketdeals and collective market. Majority of small scale farmers (almost three quarter), do sell directly totraders either at the farm-gate or at local markets and the remaining quarter progressive farmers do sellsmall portion and store other portion till prices improve or become stable. While the other model, wherefarmers were found to market their produces collectively through producer organizations (POs) or amodified Warehouse Receipt System (WRS). Across the country, the current common-beans supply chainbasically comprises of cooperative and private led channels. In the cooperative led channel, which is new,and an upcoming, the key actors are smallholder producers, informal farmer groups and AMCOSfunctioning as aggregators, off-takers that some of them are also brokers and/or wholesalers, retailersand end consumers. In the private led channel which is the most well established and capturing most ofthe traded volumes across the country is formed by smallholder producers, rural collectors,district/regional aggregators, wholesalers, retailers and exporters. The proposed supply chain model are4
those already initiated by the development actors and thus needing technical support for making themeffective in linking farmers to markets competitively and sustainably.In addition, this analysis provided major challenges for these subsectors in these regions, which include;inadequate availability of good quality storage facilities; low usage of improved varieties; low level ofmechanization; limited or access to soft loans for small-scale maize producers; limitation to access directmarket; limitation to extension services; weak farmers’ organizations; lack of business skills; unstable cropprices, and; poor vertical and horizontal linkages in the overall value chain. The recommended paddysupply chain is the one aims at improving the procurement of paddy from small scale farmers by small,medium and large-scale millers and traders. The model aim at improving availability and quality of paddyand reduction of transaction costs to all actors through reliable supply to all types of buyers who wantsto aggregate, mill and sale within and outside the country.5
1.0 Introduction1.1Back ground informationAgriculture is the predominant economic activity in Tanzania with over 80% of the households engagedin agricultural and related activities. Among of the major crops produced is maize, paddy, cassava andbeans. The leading productive regions are Kagera, Kigoma, Katavi, Rukwa, Njombe, Ruvuma, Iringa, andMbeya. The crops are increasingly becoming important to households food security and sources of incometo the producers. Trading of the crops is rapidly increasing due to higher rates of urbanization, which isestimated to be 33% in cities and urban towns in the country. The major trading centers and destinationsare Dar-es Salaam, Mwanza, Mbeya, Tanga, Dodoma, Morogoro, Arusha, Zanzibar, Kigoma, and Moshi.Same crops are mostly exported to the East African Countries such that with coherent strategies thecountries could become major future export destinations. The crops are produced by small-scale farmers(95% of the producers) who are facing systemic challenges in the supply chains. The challenges includeproduction, storage, and transportation, financing, processing and trading.Alliance for Green Revolution in Africa (AGRA) that works in Tanzania and other African countries isfocused on putting smallholder farmers at the center of the continent’s growing economy by transformingagriculture from a solitary struggle to survive into farming as a business that thrives. Among of the AGRAstrategies is to support establishment of inclusive, competitive and sustainable business and supply chainsthat will enable the small holders to overcome the existing systemic challenges in the value chains ofmaize, paddy, cassava and beans in Tanzania. As among of the strategic activities for implementing thestrategy, AGRA assigned Sundy Merchants Company Limited to conduct a survey of the existing supplychains for the sub-sectors targeted and propose models that will inclusively take all stakeholders in thesub-sectors on-board effectively and efficiently.1.2Objective of the assignmentThe purpose of the assignment was to critically analyze existing marketing models for maize, rice, beansand cassava and provide a strategy for market linkages in areas where AGRA is developing comprehensivemarket led interventions which will enable Tanzania smallholder farmers be sustainably linked toprofitable structured markets for their excessive produce.1.3Report contentsThe report presents the analyzed supply chain models for the four sub-sectors (maize, paddy, cassava andbeans), from 8 regions, namely; Kagera, Kigoma, Katavi, Rukwa, Njombe, Ruvuma, Iringa, and Mbeyawhere AGRA is developing market-led interventions. The key targeted parties in this assignment were;large, medium and small aggregators and processors, institutional buyers farmer organizations, farmers,agricultural-marketing support organizations and programs, as well as institutions dealing with regulatingor overseeing produce markets of the above selected value chains.Specifically this report covers the following: Sub-sectors overview focusing on key players and their profiles, volume estimates to gaugemarket size, supply and demand, growth and trends. Analyzed supply chain structures focusing on types of models, long or short supply chains,backwards and forwards linkages including village middlemen and aggregators, bulk buyers andend-markets like millers, processors and exporters. Analyzed capacities, key opportunities/constraints of each segment in the chains, and sourcesof competition. Evaluated attractiveness focusing on costs, price stability, profitability along the value chains,barriers to entry, key success factors.6
1.3Local markets serviced by the supply chains focusing on product availability, price dynamics, andmargins, market gaps, inefficiencies, and economics of smallholder production andopportunities of value addition.Recommended supply chains focusing on types of models, potentials, challenges, developmentstrategies and actions.Overview of the Sub-sectorsMaizeMaize is the primary staple crop in Tanzania grown in nearly all agro-ecological zones in the country, withsouthern highlands regions (Iringa, Njombe, Mbeya, Songwe, Rukwa, Katavi and Ruvuma) being the majorproducers of the crop. In the last four decades, Tanzania has ranked among the top 25 maize producingcountries in the world, and it is a major maize producer in Sub-Saharan Africa. In the 2018/19 growingseason Tanzania produced 6.2 million metric tons of maize, whereby 85% of the maize is produced bysmallholder farmers. Despite the steady production of maize in Tanzania, still postharvest handling, poorinfrastructure, weather variability, biotic factors such as insects and pests, bacteria, pathogens, viruses,and fungi, often aggravate the supply chains that results to huge losses. Losses along the supply chain areon average 30%. 80% of maize in Tanzania is locally consumed, while its per capital consumption is 80135 kg/person /year (Bill & Mellinda Gates Foundation, 2014; Bymolt, 2017; Enzama, 2016; GrowAfrica,2016; Wiggins & Compton, 2016; Wilson & Lewis, 2015).CassavaCassava is an increasingly important crop in Tanzania and mainly a subsistence crop where 84% of its totalproduction is used for human food, making it the second most important food crop after maize in termsof production volume and per capita consumption. The remaining amount is for other uses such as animalfeed, alcohol brewing and starch production. As of 2014-2018, annual cassava production on average was1.4 million metric tons per annum (FWSNET Report, August 2018), and hence making the crop one of theemerging market-oriented commodities that could contribute to improve the livelihoods of smallholderfarmers in the country. Same source estimates that 70% of the production is consumed while 30% ismarketed within the country and outside. Cassava is widely grown by small-scale farmers in all farmingsystems in Tanzania due to its adaptability to various soils and agro-ecological conditions. A smallholderfarmer that owns about 0.4-2 hectares dominates production as they produce 95% of the cassavaproducts. The main products currently are dried and fresh sweet cassava. Production is subsistence basedand thus small scale commercialized farming is almost non-existence with production below the expectedlevels. Regions with substantial surpluses and hence trades within the country and in East AfricanCountries are Mtwara, Lindi, Coast, Tabora and Kigoma.RiceRice is the third most important staple crop in Tanzania after maize and cassava. Annual rice productionaverages about 2.87 million tons. As for maize and cassava, smallholders are also the major growers ofthe majority of paddy in the country. In Tanzania, paddy is produced in three main areas; (i) in Rain-fedlowlands (68%), which has an average productivity of 3.5 tons/ha; in Rain-fed uplands (20%), which hasan average productivity of 1.2 tons/ha; and at Irrigation schemes (12%), which have an averageproductivity of 3.8 tons/ha. About 30% of rice produced in Tanzania is consumed by producinghouseholds, while the rest is absorbed into either domestic market (60%), with highest consumption inurban areas or exported (40%) to mainly; Burundi, Kenya, Rwanda and Uganda. Tanzania has not beenself-sufficient in rice for many years and its demand for rice is projected to triple by 2020 from 1.15 milliontons in 2009 to 2.84 million tons in 2020 (FAO, 2014; GrowAfrica, 2016; Paglietti & Sabrie, 2013; Townsend& Mtaki, 2018; Wilson & Lewis, 2015). The leading regions with large surpluses for trading are Morogoro,Mbeya, Rukwa, Katavi and Shinyanga while those with minor surpluses include Ruvuma, Pwani, Iringa,Tabora, Geita and Mwanza.7
BeansCommon beans are one of the major sources of food and income for smallholder farmers in Tanzania.Annual production of the crop is about 1.02 million MT which makes the country a leading country inAfrica followed by Uganda with 0.88 million MT, Kenya 0.66 million MT, Ethiopia 0.57 million MT andRwanda 0.42 million MT (Sellian Research Institute, 2018). The crop is the most exported among pulsesfrom Tanzania that contributes to more than 62% of all Tanzanian pulse exports (URT, 2016). However,the national average yield for common beans that ranges between 0.72 and 1.10 tone/ha, is far belowpotential yields recommended by agricultural research (1.5-3 tones/ha) using improved varieties1. Kigomaand Kagera are the regions with highest bean production with each harvesting an average of 90,000 MTannually. Other regions in the top seven include Tanga (50,000 MT), Kilimanjaro (45,000 MT), Geita(35,000 MT), Arusha (35,000 MT) and Njombe (20,000 MT)2. Approximately 40 percent of annual beansproduction is destined for household consumption by farmers, while 48% is traded domestically and 12%exported to regional markets. The regional markets are Kenya, Uganda, Rwanda, Burundi, Zambia,Malawi, Mozambique, Zimbabwe, South Africa and the Democratic Republic of Congo (DRC), as well asIndia (GrowAfrica, 2016; Townsend & Mtaki, 2018). Countywide there are three main production andmarketing seasons. Regions in the Southern Zone that comprises of Iringa, Njombe, Ruvuma, Mbeya,Songwe, Rukwa and Katavi harvesting and marketing season is from May to July which is the same likethe North-Western zone of which Kagera and Kigoma regions are included. The second season is mainlyof Kigoma and Kagera who harvest and market as from late December to March.2.0 Ranking of Subsector by RegionsAnalysis of the four subsectors (Maize, paddy, beans, and cassava) in the 8 regions (Kagera, Kigoma,Katavi, Rukwa, Mbeya, Njombe, Iringa, and Ruvuma) was done looking at data on total production areaper crop per region for the past five years (2013 – 2017). The resulted ranking is summarized in Table 1.Based on the ranking, the subsectors observed as follows; For maize-Rukwa, Mbeya, Njombe Iringa andRuvuma; for Paddy-Katavi, Mbeya and Ruvuma, for Beans; Kigoma, Kagera, Rukwa, Iringa and Mbeya, forCassava-Kagera, Kigoma, Ruvuma and Mbeya.Table 1: Summary of Crop Ranking per RegionRanking ssavaNote: Shaded parts means “no crop ”3.0 Analysis of Supply Chain ModelsThe analysis focuses on the existing supply chains for each crop by portraying the institutional relationsamong the actors, power relations, effectiveness and efficiency of the models, opportunities andchallenges and the gains in relation to costs and margins resulting from value creation and value capturedby each actor. The values created and captured are summarized at the end of analysis of each supplychain. Thereafter, proposed supply chains are suggested that takes into consideration their potentials for1MusimuJ,J (2018), Economics of small holder common beans production in Mbeya, ulture/tanzania-s-bean-exports-feed-10-countries8
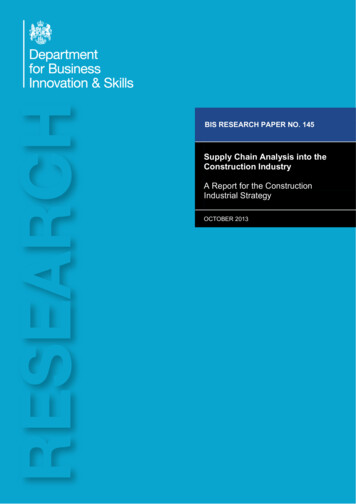
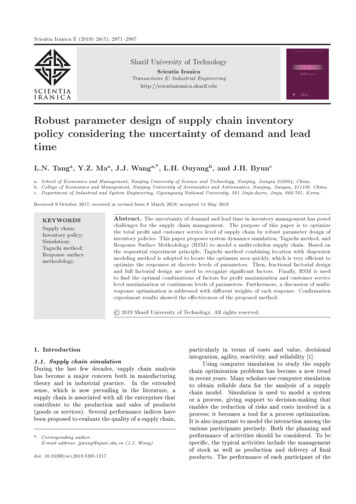
enabling an inclusive, resilient and competitive business among the key actors in each of the value chains.The key factors for the recommendations are: Potentials for providing returns to farmers and buyers while enabling them to remaincompetitiveEnabling producers to bulk and buyers to purchase economic lots and hence loweringtransaction costs to both.Enabling farmers to establish stronger negotiation positionsEnabling to establish business relations based on formal agreements that are guided bytransparency, trust and risk sharing between buyers and producersEnabling each actor to access information that will guide them in decision making andplanningPotentials for being scalable and allow more producers and buyers to come in.Creates crowding opportunities for other essential services and businesses such as inputssupply in bulk, value additions and financial services at affordable costs/prices.3.1 Maize Supply Chains3.1.1 Existing Supply Chains for MaizeThe assessment observed that, in Southern Highlands and Western regions two main aggregation modelsfor maize were found to feature prominently. The identified supply chain models are (i) spot market deals,and; (ii) collective marketing (see figure 1).Figure 1: Existing Supply -Chain Models for MaizeSpot Aggregation ModelSpot aggregation model in Maize takes one of the following forms: Farmers’ weekly markets in rural areas where maize is traded in small quantities within the villagefrom surplus households to deficit households or consumers. Farmers take part of their produce9
to the local fee-for milling (toll millers-posho milling) for home consumption while the surplus issold in local spot markets. The sale of surplus maize at the village household level is oftentriggered by a specific family cash requirement such as school fees, funeral expenses, andwedding rather than being part of a longer-term commercial strategy for income generation.A second channel, which is more common, is when middlemen collectors buy maize grain duringharvest season at very low farm-gate prices and sell to millers, wholesalers or aggregators athigher prices during season of scarcity. These channels include medium-sized grain traders andmillers who serve rural and urban centers, but also the cooperatives societies (AMCOS) and grainmarkets centers like Tunduma and Laela in Songwe and Rukwa regions.A third channel is when millers use agents who they support with finances and logistics to set upbuying centers with storage facilities in the areas of production to buy and store maize beforetransporting to the processing facilities. This channel normally comprises a small number of wellestablished, large-scale millers and traders based in major maize deficit cities like Dar es Salaam,Mwanza, Dodoma and Arusha, operating in both national and regional markets.Spot aggregation and middlemen collection model is widely used in most parts of the southern highlandsand west regions of Tanzania where 60-70% of maize supplied in the market is believed to pass throughthis channel. Despite of this being a dependable channel by majority of key actors like farmers and buyers,the model has proved to be very expensive and inefficient because of the high transactions costs involved.Information gathered from the field shows that farmers incurs aggregation cost of up to USD 0.039 perKg while buyers through the same transaction do incur cost of USD 0.067 per Kg (Annex 6). Intermediariesor agents do contribute 12-30% of the costs incurred by both farmers and buyers (Annex 6). Agents orintermediaries are also the source of the low and inflated prices of maize to both farmers and buyersrespectively. The information gathered from the field shows that farmers are paid an average of betweenUSD 0.17 to 0.22 while big buyers do buy the same maize at a price of between USD 0.24 and 0.3 (Annex6).Collective Aggregation ModelCollective marketing aggregation model in maize are in two forms that both works through producergroups (formal registered groups and Agricultural Marketing Cooperative Societies -AMCOS).The first form of collective aggregation is through informal farmer groups organized by either a NonGovernment Organizations (NGOs) or Projects and linked to off-takers. In most cases, these groups areprovided with capacity building support and then linked to inputs suppliers and the off-takers which inmost cases are medium and large maize millers who mostly are millers trading at regional and nationallevels. This model is also applied by some AMCOS in the regions of Songwe, Rukwa, Ruvuma, Iringa, Mbeyaand Njombe. In those regions, the off-takers linked to the groups and the AMCOS are Apeck International,Musoma Food Company Limited and Ruaha Milling Company Limited. Collective aggregation is anemerging model that received organizational and market linkages support from NGOs like Building RuralIncomes Through Enterp
Agriculture is the predominant economic activity in Tanzania with over 80% of the households engaged in agricultural and related activities. Among of the major crops produced is maize, paddy, cassava and . supply chain is the one aims at improving the procurement of paddy from small scale farmers by small, medium and large-scale millers and .