Transcription
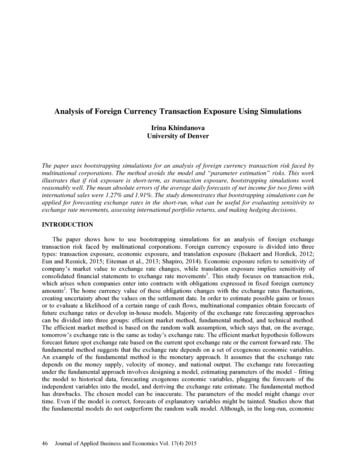
Analysis of Foreign Currency Transaction Exposure Using SimulationsIrina KhindanovaUniversity of DenverThe paper uses bootstrapping simulations for an analysis of foreign currency transaction risk faced bymultinational corporations. The method avoids the model and “parameter estimation” risks. This workillustrates that if risk exposure is short-term, as transaction exposure, bootstrapping simulations workreasonably well. The mean absolute errors of the average daily forecasts of net income for two firms withinternational sales were 1.27% and 1.91%. The study demonstrates that bootstrapping simulations can beapplied for forecasting exchange rates in the short-run, what can be useful for evaluating sensitivity toexchange rate movements, assessing international portfolio returns, and making hedging decisions.INTRODUCTIONThe paper shows how to use bootstrapping simulations for an analysis of foreign exchangetransaction risk faced by multinational corporations. Foreign currency exposure is divided into threetypes: transaction exposure, economic exposure, and translation exposure (Bekaert and Hordick, 2012;Eun and Resnick, 2015; Eiteman et al., 2013; Shapiro, 2014). Economic exposure refers to sensitivity ofcompany’s market value to exchange rate changes, while translation exposure implies sensitivity ofconsolidated financial statements to exchange rate movements1. This study focuses on transaction risk,which arises when companies enter into contracts with obligations expressed in fixed foreign currencyamounts2. The home currency value of these obligations changes with the exchange rates fluctuations,creating uncertainty about the values on the settlement date. In order to estimate possible gains or lossesor to evaluate a likelihood of a certain range of cash flows, multinational companies obtain forecasts offuture exchange rates or develop in-house models. Majority of the exchange rate forecasting approachescan be divided into three groups: efficient market method, fundamental method, and technical method.The efficient market method is based on the random walk assumption, which says that, on the average,tomorrow’s exchange rate is the same as today’s exchange rate. The efficient market hypothesis followersforecast future spot exchange rate based on the current spot exchange rate or the current forward rate. Thefundamental method suggests that the exchange rate depends on a set of exogenous economic variables.An example of the fundamental method is the monetary approach. It assumes that the exchange ratedepends on the money supply, velocity of money, and national output. The exchange rate forecastingunder the fundamental approach involves designing a model, estimating parameters of the model – fittingthe model to historical data, forecasting exogenous economic variables, plugging the forecasts of theindependent variables into the model, and deriving the exchange rate estimate. The fundamental methodhas drawbacks. The chosen model can be inaccurate. The parameters of the model might change overtime. Even if the model is correct, forecasts of explanatory variables might be tainted. Studies show thatthe fundamental models do not outperform the random walk model. Although, in the long-run, economic46Journal of Applied Business and Economics Vol. 17(4) 2015
fundamentals are important determinants of foreign exchange rates. The technical approach suggests thathistorical trends continue into the future. It examines historical data on the foreign exchange rates,identifies patterns, and extrapolates them into the future to forecast future exchange rates. As for thefundamentals methods, existing studies do not find evidences that the technical analysis methodsoutperform the random walk model. This work projects exchange rates using the bootstrappingsimulations method, which is close to the technical methods. It also assumes that the history repeats in thefuture and projects changes in the exchange rates by “bootstrapping” from historical observations.Commonly, multinational corporations use the sensitivity and scenario analyses to assess foreignexchange exposure. In the sensitivity analysis, an output (for transaction exposure, it could be Profit AfterTax in home currency units) is evaluated for a few values of one input (the exchange rate). The sensitivityis estimated as a ratio of changes in the output to changes in the input. The scenario analysis calculates theoutput values for several scenarios, with different combinations of inputs’ values. However, thesensitivity and scenario analyses have drawbacks: choices of input variables and scenarios are arbitrary,need to derive estimates of the scenarios probabilities, and it is difficult to succinctly interpret multiplescenarios results (Brealey at al., 2011; Khindanova, 2013; Spinney and Watkins, 1996). This study usesanother methodology for evaluating foreign currency exposure – a simulation analysis, which can takeinto account multiple sources of uncertainty (for example: exposure to several exchange rates) and theirinterrelationship. There are two groups of simulations approaches: Monte Carlo and historical. A MonteCarlo simulations approach describes uncertainty of inputs with probability distributions, estimatesdistributions parameters, repeats generation of random values from the inputs distributions and calculatesthe output, what allows users to generate a probability distribution for the output (Khindanova, 2013;Khindanova and Rachev, 2000; Spinney and Watkins, 1996). The historical simulations method does notimpose the distribution assumptions. It avoids model risk and “parameter estimation” risk3. The historicalsimulations forecast inputs by drawing from past observations and estimate the output. A commoncritique of the historical simulations methodology is that it produces inaccurate estimates in distributionstails (Boudoukh at al., 1998; Danielsson and de Vries, 1997), what might be important for modelingforeign exchange rates characterized by fat tails. The paper employs a bootstrapping modification ofhistorical simulations. It repetitively draws from a set of inputs’ historical observations, plugs the drawnvalues into the output model, and derives multiple values of the output to form its probability distribution(Boudoukh at al., 1998; Khindanova and Rachev, 2000).Examples of simulations in foreign currency studies can be found in Charemza, 1996; Corona andEcca, 2008. Charemza (1996) analyzed the crush of the Polish exchange market in 1989. The authorsimulated the unobservable component of the bubble process. The results indicate the speculative bubbleburst. Corona and Ecca (2008) simulated interactions between two stock markets in two differentcountries, linked by a foreign exchange market. There are several illustrations of foreign exchange ratesimulations in financial modeling books. Benninga (2008) employs Excel’s VBA4 to do bootstrappingsimulations of the Ruble/US dollar exchange rate, a Russian interest rate, and an index price. Thesimulated data are used to derive a distribution of the portfolio return and to estimate the 1% Value-atRisk (VaR) for the portfolio. Winston (2008a) applies Excel and @Risk, an Excel add-in, to simulateexchange rates and value a foreign currency swap. He generates future interest rates in two countries andforecasts the exchange rates using the interest rate parity, the simulated interest rates, and the current spotexchange rate. Then he simulates a swap and derives a value of the swap. Winston (2008b) considers aUS multinational company with three receivables in francs, pounds, and yen. He illustrates how tominimize the variability of six-month profit in dollars, subject to the condition that the average profit willbe at least 4.8 million. Winston employs the bootstrapping technique to simulate 1000 scenarios forthree exchange rates using @Risk. Then, he determines the number of put options on each currency toachieve the needed risk profile.This study implements the bootstrapping simulations in the EViews environment. The EViews is aneconometrics software. It is not commonly used in finance, but is widely applied for buildingmacroeconomic models. Comparing to Excel and @Risk, the EViews package is more flexible forincorporating macroeconomic and firm-level sources of risk into financial models.Journal of Applied Business and Economics Vol. 17(4) 201547
This work is one of the first papers to apply the bootstrapping simulations for evaluating foreigncurrency transactions exposure of a multinational company. The paper considers a hypothetical U.S.based firm with sales in the U.S., the Eurozone, Canada, Japan, Mexico, Malaysia, and South Africa. Therevenues in local currencies terms are constant, but the dollar values of sales fluctuate with exchange ratesmovements. Bekaert and Hodrick (2012) suggest that monthly percentage changes of major currenciescan be described by normal distributions, while currencies of many emerging economies have non-normaldistributions, characterized by heavy tails, higher peaks, and skewness. These findings imply thathistorical simulations might underestimate probabilities of extreme events for currencies from emergingmarkets. To investigate whether origins of currencies affect the simulations results, the paper simulatesseparate sales and net incomes in dollar terms for two groups of countries/regions: (i) representing majorcurrencies (the Eurozone, Canada, and Japan) and (ii) emerging economies (Mexico, Malaysia, and SouthAfrica). The U.S. sales are included in both cases. The projected local sales values and numbers for otherincome statement variables are based on the Diva Shoes case application in Eun and Resnick, 2012. Thefollow-up paper will build the EViews macroeconomic models to forecast sales abroad and integratethose models with the dollar net income simulations, following Cuddington and Khindanova, 2011 and2012. The simulations for the company involve repetitive (5,000 times) forecasting of foreign exchangerates in six months by bootstrapping from the exchange rates daily returns over the past six months,calculating the U.S. dollar values of sales under projected exchange rates, and estimating net income indollar terms. Thus, the simulations generate 5,000 possible values of the 6-month net income, what allowsto form a distribution for the net income. The derived distributions for two cases of sales (in developedand emerging countries) facilitate a much deeper risk assessment comparing to a single point estimate ofthe net income or a collection of scenario results. The paper estimates different risk measures (standarddeviation, skewness and behavior in the distribution tails) and probabilities of certain ranges of the netincome and extreme events.In order to assess the forecast performance of the bootstrapping simulations technique, the papercarries out rolling simulations of exchange rates over the one-month out-of-sample forecast period (22trading days), calculates corresponding net incomes, and compares them to the net incomes values underthe actual exchange rates. The mean absolute error (MEA) of the average daily forecasts for net incomefrom sales in the U.S., Canada, the Eurozone, and Japan is only1.27%. A similar simulation of sales inU.S., Mexico, Malaysia, and South Africa produces MEA of 1.91%.This work illustrates that if risk exposure is short-term, as transaction exposure, and the focus is noton the extreme quantiles, bootstrapping simulations work reasonably well. They can be applied forforecasting exchange rates in the short-run, what can be useful for evaluating sensitivity to exchange ratemovements and making hedging decisions.The next section presents a deterministic model of the income statement. The third section explainsthe bootstrapping simulations of exchange rates and the net income. The fourth section describes thehistorical exchange rate series. Then the paper examines generated distributions for the net income anddiscusses the forecast performance of the simulations. The sixth section summarizes findings and outlinesdirections for future research.DETERMINISTIC MODEL OF INCOME STATEMENTThe paper considers a hypothetical U.S.-based firm with shoes sales in the Eurozone, Canada, Japan,Mexico, Malaysia, and South Africa. Suppose the current time is March 31, 2014. The company hasshoes orders for the next six months from domestic and foreign markets. However, fluctuating exchangerates create uncertainty about the dollar values of the total sales and the net income by September 30,2014 (over the 6-month period). The company is facing increasing exposure to foreign currency risk, butit does not actively manage the risk. As the first step of changing risk management policies, the companywould like to assess the transaction exposure risk. What is the expected net income level in dollar terms?How volatile are the net income projections? What is the likelihood of reaching the target level of the netincome?48Journal of Applied Business and Economics Vol. 17(4) 2015
The assessment begins with outlining a deterministic model of the income statement. Table 1 showsthe historical and projected sales (shoe orders), adapted from the Diva Shoes minicase in Eun andResnick, 2012. The paper examines separate sales and net incomes in dollar terms for two groups ofcountries/regions: (i) representing major currencies (the Eurozone, Canada, and Japan) and (ii) emergingeconomies (Mexico, Malaysia, and South Africa). The U.S. sales are included in both cases. Notice thattotal sales in dollar terms in Table 1 are the same for both groups ( 81,252,942). The local currenciesvalues of orders in Table 1 show that sales in the US and Canada will decline, grow slightly in theEurozone, and increase substantially in Japan.TABLE 1HISTORICAL AND PROJECTED SALESCaseMarketsUSCanada1EurozoneJapanTotal sales, USMexico2MalaysiaSouth Africa3.31.14Sales in localcurrencies ,624MYR87,301,896ZAR155,510,580Total sales, 600MXN/USD13.0560MYR/USD3.2630ZAR/USD10.5275Sales in theU.S. dollarterms15,000,00026,755,1019.30.14Orders in localcurrencies ,252,942The paper assumes that the dollar expenses are the same for both cases. Since the dollar sales andexpenses are equal, the two cases have identical income statements, given in Table 2.TABLE 2CONSOLIDATED INCOME STATEMENT, IN USDSalesCosts of goods soldGross profitSG&A expensesOperating profitInterest expensePretax incomeIncome taxes (40%)Net IncomeMarch 31, ,5654,000,00012,290,5654,916,2267,374,339*Adapted from Exhibit 8.17 in Eun and Resnick, 2012.Journal of Applied Business and Economics Vol. 17(4) 201549
A deterministic model of the income statement supposes that the interest payments are constant( 4,000,000); the ratios of expenses with respect to sales are constant too: (Cost of goods sold)/Sales 44,674,127 / 81,252,942 0.55, (SG&A expenses)/Sales 20,288,250 / 81,252,942 0.25; the taxrate stays at 40%. The model equations:𝑇𝑜𝑡𝑎𝑙 𝑆𝑎𝑙𝑒𝑠 ,𝑡 𝑆𝑎𝑙𝑒𝑠𝑈𝑆,𝑡 ��,𝑡 𝑆(𝑈𝑆𝐷/𝐸𝑈𝑅)𝑡 𝑆𝑎𝑙𝑒𝑠𝐶𝑎𝑛𝑎𝑑𝑎,𝑡 /𝑆(𝐶𝐴𝐷/𝑈𝑆𝐷)𝑡 𝑆𝑎𝑙𝑒𝑠𝐽𝑎𝑝𝑎𝑛,𝑡 /S(𝑌𝐸𝑁/𝑈𝑆𝐷)𝑡𝐶𝑜𝑠𝑡 𝑜𝑓 𝐺𝑜𝑜𝑑𝑠 𝑆𝑜𝑙𝑑 ,𝑡 𝑇𝑜𝑡𝑎𝑙 𝑆𝑎𝑙𝑒𝑠 ,𝑡 0.55(1)(2)𝐺𝑟𝑜𝑠𝑠 𝑝𝑟𝑜𝑓𝑖𝑡 ,𝑡 𝑇𝑜𝑡𝑎𝑙 𝑆𝑎𝑙𝑒𝑠 ,𝑡 𝐶𝑜𝑠𝑡 𝑜𝑓 𝐺𝑜𝑜𝑑𝑠 𝑆𝑜𝑙𝑑 ,𝑡(3)𝑂𝑝𝑒𝑟𝑎𝑡𝑖𝑛𝑔 𝑝𝑟𝑜𝑓𝑖𝑡 ,𝑡 𝐺𝑟𝑜𝑠𝑠 𝑝𝑟𝑜𝑓𝑖𝑡 ,𝑡 𝑆𝐺&𝐴 𝑒𝑥𝑝𝑒𝑛𝑠𝑒𝑠 ,𝑡(5)𝑃𝑟𝑒𝑡𝑎𝑥 𝑖𝑛𝑐𝑜𝑚𝑒 ,𝑡 𝑂𝑝𝑒𝑟𝑎𝑡𝑖𝑛𝑔 𝑝𝑟𝑜𝑓𝑖𝑡 ,𝑡 𝐼𝑛𝑡𝑒𝑟𝑒𝑠𝑡 𝑒𝑥𝑝𝑒𝑛𝑠𝑒 ,𝑡(7)𝑁𝑒𝑡 𝑖𝑛𝑐𝑜𝑚𝑒 ,𝑡 𝑃𝑟𝑒𝑡𝑎𝑥 𝑖𝑛𝑐𝑜𝑚𝑒 ,𝑡 𝑇𝑎𝑥𝑒𝑠 ,𝑡 ,(9)𝑆𝐺&𝐴 𝑒𝑥𝑝𝑒𝑛𝑠𝑒𝑠 ,𝑡 𝑇𝑜𝑡𝑎𝑙 𝑆𝑎𝑙𝑒𝑠 ,𝑡 0.25𝐼𝑛𝑡𝑒𝑟𝑒𝑠𝑡 𝑒𝑥𝑝𝑒𝑛𝑠𝑒 ,𝑡 4,000,000𝑇𝑎𝑥𝑒𝑠 ,𝑡 𝑃𝑟𝑒𝑡𝑎𝑥 𝑖𝑛𝑐𝑜𝑚𝑒 ,𝑡 0.40(4)(6)(8)where t denotes the current time - March 31, 2014; 𝑆(𝑈𝑆𝐷/𝐸𝑈𝑅)𝑡 , 𝑆(𝐶𝐴𝐷/𝑈𝑆𝐷)𝑡 , and S(𝑌𝐸𝑁/𝑈𝑆𝐷)𝑡are current spot exchange rates; USD stands for US dollar, EUR – Euro, CAD – Canadian dollar, YEN –Japanese yen. For Case 2, the model equations do not change, except for equation (1):𝑇𝑜𝑡𝑎𝑙 𝑆𝑎𝑙𝑒𝑠 ,𝑡 𝑆𝑎𝑙𝑒𝑠𝑈𝑆,𝑡 𝑆𝑎𝑙𝑒𝑠𝑀𝑒𝑥𝑖𝑐𝑜,𝑡 /𝑆(𝑀𝑋𝑁/𝑈𝑆𝐷)𝑡 ��,𝑡 /𝑆(𝑀𝑌𝑅/𝑈𝑆𝐷)𝑡 𝑆𝑎𝑙𝑒𝑠𝑆𝑜𝑢𝑡ℎ 𝐴𝑓𝑟𝑖𝑐𝑎,𝑡 /S(𝑍𝐴𝑅/𝑈𝑆𝐷)𝑡 ,(10)where 𝑆(𝑀𝑋𝑁/𝑈𝑆𝐷)𝑡 , 𝑆(𝑀𝑌𝑅/𝑈𝑆𝐷)𝑡 , and S(𝑍𝐴𝑅/𝑈𝑆𝐷)𝑡 are the current spot exchange rates; MXNdenotes the Mexican peso, MYR – Malaysian ringgit, ZAR – South African rand.BOOTSTRAPPING SIMULATIONS OF EXCHANGE RATES AND NET INCOMEA stochastic version of the income statement for the September 30, 2014 forecasts is based on thedeterministic model (1) - (10). It assumes that model inputs (exchange rates) are random, replaces thecurrent spot exchange rates in equations (1) and (10) by simulated forecasts, and considers orders’ valuesfrom Table 1:𝑇𝑜𝑡𝑎𝑙 𝑆𝑎𝑙𝑒𝑠 ,𝑇,𝑘 𝑆𝑎𝑙𝑒𝑠𝑈𝑆,𝑇 ��,𝑇 𝑆̂(𝑈𝑆𝐷/𝐸𝑈𝑅) 𝑇,𝑘 𝑆𝑎𝑙𝑒𝑠𝐶𝑎𝑛𝑎𝑑𝑎,𝑇 /𝑆̂(𝐶𝐴𝐷/𝑈𝑆𝐷) 𝑇,𝑘 𝑆𝑎𝑙𝑒𝑠𝐽𝑎𝑝𝑎𝑛,𝑇 /𝑆̂(𝑌𝐸𝑁/𝑈𝑆𝐷) 𝑇,𝑘𝐶𝑜𝑠𝑡 𝑜𝑓 𝐺𝑜𝑜𝑑𝑠 𝑆𝑜𝑙𝑑 ,𝑇,𝑘 𝑇𝑜𝑡𝑎𝑙 𝑆𝑎𝑙𝑒𝑠 ,𝑇,𝑘 0.55𝐺𝑟𝑜𝑠𝑠 𝑝𝑟𝑜𝑓𝑖𝑡 ,𝑇,𝑘 𝑇𝑜𝑡𝑎𝑙 𝑆𝑎𝑙𝑒𝑠 ,𝑇,𝑘 𝐶𝑜𝑠𝑡 𝑜𝑓 𝐺𝑜𝑜𝑑𝑠 𝑆𝑜𝑙𝑑 ,𝑇,𝑘𝑆𝐺&𝐴 𝑒𝑥𝑝𝑒𝑛𝑠𝑒𝑠 𝑇,𝑘 𝑇𝑜𝑡𝑎𝑙 𝑆𝑎𝑙𝑒𝑠 𝑇,𝑘 0.2550Journal of Applied Business and Economics Vol. 17(4) 2015(11)(12)(13)(14)
𝑂𝑝𝑒𝑟𝑎𝑡𝑖𝑛𝑔 𝑝𝑟𝑜𝑓𝑖𝑡 ,𝑇,𝑘 𝐺𝑟𝑜𝑠𝑠 𝑝𝑟𝑜𝑓𝑖𝑡 ,𝑇,𝑘 𝑆𝐺&𝐴 𝑒𝑥𝑝𝑒𝑛𝑠𝑒𝑠 ,𝑇,𝑘(15)𝑃𝑟𝑒𝑡𝑎𝑥 𝑖𝑛𝑐𝑜𝑚𝑒 ,𝑇,𝑘 𝑂𝑝𝑒𝑟𝑎𝑡𝑖𝑛𝑔 𝑝𝑟𝑜𝑓𝑖𝑡 ,𝑇,𝑘 𝐼𝑛𝑡𝑒𝑟𝑒𝑠𝑡 𝑒𝑥𝑝𝑒𝑛𝑠𝑒 ,𝑇,𝑘(17)𝑁𝑒𝑡 𝑖𝑛𝑐𝑜𝑚𝑒 ,𝑇,𝑘 𝑃𝑟𝑒𝑡𝑎𝑥 𝑖𝑛𝑐𝑜𝑚𝑒 ,𝑇,𝑘 𝑇𝑎𝑥𝑒𝑠 ,𝑇,𝑘 ,(19)𝐼𝑛𝑡𝑒𝑟𝑒𝑠𝑡 𝑒𝑥𝑝𝑒𝑛𝑠𝑒 ,𝑇,𝑘 4,000,000𝑇𝑎𝑥𝑒𝑠 ,𝑇,𝑘 𝑃𝑟𝑒𝑡𝑎𝑥 𝑖𝑛𝑐𝑜𝑚𝑒 ,𝑇,𝑘 0.40(16)(18)where T denotes the forecast time – September 30, 2014; k is the simulation number, k 1, ,5000; 𝑆𝑎𝑙𝑒𝑠𝑈𝑆,𝑇 , ��,𝑇 , 𝑆𝑎𝑙𝑒𝑠𝐶𝑎𝑛𝑎𝑑𝑎,𝑇 , and 𝑆𝑎𝑙𝑒𝑠𝐽𝑎𝑝𝑎𝑛,𝑇 are orders from markets for the 6month period, ending at time T - September 30, 2014; 𝑆̂(𝑈𝑆𝐷/𝐸𝑈𝑅) 𝑇,𝑘 , 𝑆̂(𝐶𝐴𝐷/𝑈𝑆𝐷) 𝑇,𝑘 , and 𝑆̂(𝑌𝐸𝑁/𝑈𝑆𝐷) 𝑇,𝑘 are the exchange rates forecasts for time T derived during the k-th simulation. For Case 2, thetotal sales equation (10) becomes:𝑇𝑜𝑡𝑎𝑙 𝑆𝑎𝑙𝑒𝑠 ,𝑇,𝑘 𝑆𝑎𝑙𝑒𝑠𝑈𝑆,𝑇 𝑆𝑎𝑙𝑒𝑠𝑀𝑒𝑥𝑖𝑐𝑜,𝑇 /𝑆̂(𝑀𝑋𝑁/𝑈𝑆𝐷) 𝑇,𝑘 ��,𝑇 /𝑆̂(𝑀𝑌𝑅/𝑈𝑆𝐷) 𝑇,𝑘 𝑆𝑎𝑙𝑒𝑠𝑆𝑜𝑢𝑡ℎ 𝐴𝑓𝑟𝑖𝑐𝑎,𝑇 /𝑆̂(𝑍𝐴𝑅/𝑈𝑆𝐷) 𝑇,𝑘 ,(20)where 𝑆𝑎𝑙𝑒𝑠𝑀𝑒𝑥𝑖𝑐𝑜,𝑇 , ��,𝑇 , and 𝑆𝑎𝑙𝑒𝑠𝑆𝑜𝑢𝑡ℎ 𝐴𝑓𝑟𝑖𝑐𝑎,𝑇 are orders from markets for AprilSeptember, 2014; 𝑆̂(𝑀𝑋𝑁/𝑈𝑆𝐷) 𝑇,𝑘 , 𝑆̂(𝑀𝑌𝑅/𝑈𝑆𝐷) 𝑇,𝑘 , and 𝑆̂(𝑍𝐴𝑅/𝑈𝑆𝐷) 𝑇,𝑘 are the exchange ratesforecasts for time T derived during the k-th simulation.The exchange rates forecasts are generated by bootstrapping from the exchange rates daily percentagechanges (returns) over the past six months, from September 24, 2013 to March 31, 2014. The length ofthe observation period is equal to 128 trading days, the number of trading days between the current time t(March 31, 2014) and the forecast day T (September 30, 2014). At each simulation k, the EViewsresamples the original set of historical returns of exchange rates and calculates the forecast using thefollowing formula:𝑆̂(𝑖/𝑗) 𝑇,𝑘 𝑆(𝑖/𝑗)𝑡 𝑇𝑑 𝑡 1(1 𝑟𝑑′ ),(21)′𝑆̂(𝐶𝐴𝐷/𝑈𝑆𝐷) 𝑇,𝑘 𝑆(𝐶𝐴𝐷/𝑈𝑆𝐷)𝑡 𝑇𝑑 𝑡 1 1 𝑟CAD/USD,𝑑 ′𝑇̂𝑆(𝑈𝑆𝐷/𝐸𝑈𝑅) 𝑇,𝑘 𝑆(𝑈𝑆𝐷/𝐸𝑈𝑅)𝑡 𝑑 𝑡 1 1 𝑟USD/EUR,𝑑 ′𝑆̂(𝑌𝐸𝑁/𝑈𝑆𝐷) 𝑇,𝑘 𝑆(𝑌𝐸𝑁/𝑈𝑆𝐷)𝑡 𝑇𝑑 𝑡 1 1 𝑟YEN/USD,𝑑 (22)(23)(24)where i and j are currencies, T is the forecast time (September 30, 2014); k is the simulation number, k 1, , 5000; 𝑆̂(𝑖/𝑗) 𝑇,𝑘 is a forecast of the exchange rate between currencies i and j for time T derived duringthe k-th simulation; d is a day index, d t 1, , T; 𝑟𝑑′ is a resampled exchange rate return for day d.Bootstrapping simulations steps for Case 1:1. Resample sets of returns over past six months (128 trading days) for each exchange rate:CAD/USD, USD/EUR, and YEN/USD2. Forecast exchange rates for day T (September 30, 2014)) following formula (21):3. Plug the forecasts of exchange rates (22)-(24) into equation (11) to calculate total sales in dollarterms4. Recalculate expenses, profits, taxes using equations (12)-(18)5. Estimate the net income in dollars following equation (19)6. Repeat 5,000 times the simulations steps 1-5.Journal of Applied Business and Economics Vol. 17(4) 201551
Thus, the simulations generate 5,000 possible values of the 6-month net income, what allows to formits distribution. For Case 2, the simulations steps are similar. The next section examines historicalexchange rate series used for drawing future returns in step 1 of the simulations. After that part, the paperanalyzes the generated distributions for the net income and assesses the associated risks.FOREIGN EXCHANGE RATE SERIESAs it was explained in the previous section, the exchange rates forecasts are generated by drawingfrom the past exchange rates daily returns. This section describes historical level and return series of thesix involved exchange rates. The exchange rate were downloaded from the Federal Reserve EconomicData (FRED) database (Federal Reserve Bank of St. Louis, 2015). The observation period covers sevenmonths, from September 24, 2013 to April 30, 2014. The past six months data are used for forecasting anexchange rate on the forecast date out in six months. One extra month is added for rolling simulations toassess the forecast performance of the bootstrapping technique. Figure 1 depicts the nominal levels of theexchange rates over time, Figure 2 shows the daily returns of the exchange rates, while Figure 3 plots thereturns histograms.Figure 1 shows trends in the exchange rate movements over the 9.24.2013-4.30.2014 period. TheCanadian dollar has been depreciating against the US dollar through January 2014, then CAD started toslightly appreciate, with ups and downs. The CAD depreciation against USD implies that the Canadiansales in the USD terms will decline, what should be a concern for the US-based company. The USD/EURexchange rate was volatile. The Japanese yen was depreciating against dollar through December 2013,lowering the dollar value of Japanese sales. Yen seems to stabilize in February – April 2014. TheMexican peso was strengthening against dollar from February to mid-April 2014. If MXN continues toappreciate against USD, the dollar proceeds from the Mexican sales will be stronger. The Malaysianringgit and the South African rand were also appreciating against the dollar from mid-January to April2014, increasing dollar values of sales in Malaysia and South Africa.FIGURE 1NOMINAL LEVELS OF THE EXCHANGE RATES, 9.24.2013-4.30.201452Journal of Applied Business and Economics Vol. 17(4) 2015
FIGURE 2EXCHANGE RATES DAILY RETURNS, 9.25.2013-4.30.2014Returns series in Figure 2 appear to be stationary, they fluctuate around the zero line. The SouthAfrican rand fluctuates the most. Its histogram in Figure 3 confirms the higher volatility of ZAR. It has awider range of daily returns. The histograms in Figure 3 indicate that the returns distributions over theobservation period are overall symmetric. Red lines in Figure 3 depict density functions of the normaldistributions with the same means and standard deviations as the return series. It appears that distributionsof the considered exchange returns are close to the normal distributions. The statistics of the returns seriesin Table 3 help check normality of the empirical distributions.FIGURE 3EXCHANGE RATES DAILY RETURNS HISTOGRAMS, 9.25.2013-4.30.2014Journal of Applied Business and Economics Vol. 17(4) 201553
TABLE 3STATISTICS OF EXCHANGE RATES DAILY RETURNS, 9.25.2013-4.30.2014StatisticsCAD/USD USD/EUR YEN/USD MXN/USD MYR/USD .00510.00350.0072Std. 149149149ObservationsThe mean returns in Table 3 are close to zero percent for all six exchange rates. The South Africanrand and the Mexican peso exhibit highest standard deviations (0.72% and 0.51%, respectively),indicating that these two currencies are more volatile than the others. The skewness parameters of all sixexchange rates are close to zero, suggesting that their distributions are approximately symmetric. Thekurtosis of the CAD/USD, YEN/USD, and MXN/USD exchange rates is close to three, implying thattheir distributions are peaked similarly to the normal distribution. The kurtosis of the ZAR/USD exchangerate is slightly smaller than three, indicating its distribution is somewhat flatter than the normaldistribution. The kurtosis of the USD/EUR and MYR/USD exchange rates exceeds three, suggesting theirdistributions have higher peaks and fatter tails than the normal distribution. The Jarque-Bera is used totest if the series is normally distributed. The probabilities below the Jarque-Bera statistics lead us to rejectthe normality hypothesis for the USD/EUR exchange rate at the 1% significance level and for theMYR/USD exchange rate - at the 10% significance level. We cannot reject the hypothesis of normaldistribution for the CAD/USD, YEN/USD, MXN/USD, and ZAR/USD exchanges rates. The forecasts ofthese four exchange rates could be simulated by drawing from the normal distributions.SIMULATIONS RESULTSUsing the exchange rates daily return series over the 9.25.2013-3.31.14 period and following thebootstrapping simulations steps described in the third section, the paper simulates 5,000 combinations offorecasts for the CAD/USD, USD/EUR, and YEN/USD exchange rates on September 30, 2014 andgenerates 5,000 possible values of the net income over the next six months, ending on September 30,2014. Similarly, the paper simulates 5,000 scenarios of forecasts for the MXN/USD, MYR/USD, andZAR/USD exchange rates on September 30, 2014 and calculates the corresponding net income values.The generated net incomes statistics are provided in Table 4 and the distributions are illustrated in Figure4.54Journal of Applied Business and Economics Vol. 17(4) 2015
TABLE 4STATISTICS FOR SIMULATED NET INCOMES OVER THE 6-MONTH PERIODENDING ON SEPTEMBER 30, 2014StatisticsMeanMedianMaximumMinimumStd. ionsNet Income, Case 1 7,118,812 7,116,697 8,185,536 6,113,216 287,3290.09583.09729.62990.00815,000Net Income, Case 2 6,821,697 6,810,444 8,240,865 5,542,842 380,1930.18202.942128.30130.00005,000The net income in dollar terms is 7,374,339 on March 31, 2014 (the current time) in both cases, seeTable 2. The projected mean net incomes in Table 4 are lower than the current net income:𝑀𝑒𝑎𝑛 𝑁𝑒𝑡 𝐼𝑛𝑐𝑜𝑚𝑒𝐶𝑎𝑠𝑒 1 7,118,812 7,374,339 and 𝑀𝑒𝑎𝑛 𝑁𝑒𝑡 𝐼𝑛𝑐𝑜𝑚𝑒𝐶𝑎𝑠𝑒 2 6,821,697 7,374,339. The simulations predict that, on the average, the dollar values of the net income from salesin both groups of markets will decline. The net income forecasts in Case 1 fluctuate in narrower range,from 6,113,216 to 8,185,536; the Case 2 net income forecasts change in the [ 5,542,842; 8,240,865]range. The wider range of Case 2 indicates that the revenues in dollar terms from sales in Mexico,Malaysia, and South Africa will fluctuate more. The standard deviation is higher for Case 2, indicatingthat the dollar proceeds from sales in Mexico, Malaysia, and South Africa will be more volatile, what canbe explained by higher volatility of the MXN/USD and ZAR/USD exchange rates. The skewnessparameters do not differ much from zero, suggesting that the net income distributions are close to beingsymmetric. The kurtosis statistics are close to three, the kurtosis value of the normal distribution. TheCase 1 kurtosis is 3.0972, slightly above three, suggesting that a distribution of the net income from salesin Canada, the Eurozone, and Japan is more peaked than the normal distribution, and might have heaviertails than the normal distribution. The heavier tails imply that the probabilities of extreme events arehigher than for the normal distribution. The Case 2 kurtosis is 2.9421, slightly smaller than three,indicating that a distribution of the net income from sales in Mexico, Malaysia, and South Africa is flatcomparing to the normal distribution, and might have thinner tails than the normal distribution.Journal of Applied Business and Economics Vol. 17(4) 201555
FIGURE 4SIMULATED NET INCOMES DISTRIBUTIONSRed lines in Figure 4 are density functions of the normal distributions with the same means andstandard deviations as the derived net incomes sets. Although the normal density functions seem to tracethe histograms well, the Jarque-Bera statistics in Table 4 reject the hypotheses that net incomes in twocases follow the normal distribution. The simulated distributions of net incomes enable estimation ofprobabilities that net incomes will be within certain ranges. For example, there is 90% chance net incomein case 1 will be lower than 7,488,370. In case 2, there is 90% likelihood that net income will be below 7,311,196. A complete picture of probabilities can be obtained from the cumulative distributionfunctions, shown in Figure 5.FIGURE 5CUMULATIVE DISTRIBUTION FUNCTIONS OF SIMULATED NET INCOMESThe vertical lines in Figure 5 mark the current net income value of 7,374,339. The lines show thatthe probability of having the case 1 net income below the current net income level is about 80%, while forcase 2 that probability is close to 90%.In order to assess the forecast performance of the bootstrapping simulations technique, the papercalculates the mean absolute error (MEA) of the average daily forecasts for net income using rollingsimulations for 22 forecast trading days (one month). The simulations begin at the current date of March31, 2014, the forecast day of September 30, 2014, and the observation period covering September 24,56Journal of Applied Business and Economics Vol. 17(4) 2015
2013-March 31, 2014. The simulations are executed as described in the third section, generating adistribution of the net income, and a mean net income value. In the second set of simulations, the forecastdate shifts to the next day – October 1, 2014; observation period moves forward by
Risk (VaR) for the portfolio. Winston (2008a) applies Excel and @Risk, an Excel add-in, to simulate exchange rates and value a foreign currency swap. He generates future interest rates in two countries and forecasts the exchange rates using the interest rate parity, the simulated interest rates, and the current spot exchange rate.