Transcription
Salary Survey2016/2017
MPAAA Salary Survey 2016/17Table of ContentsStatewide DataAll RespondentsEducational Data SpecialistsPupil AccountantsPupil Auditors14710Regional DataIntroduction & Definitions13Regions by County listing14Region 1 Data15Region 2 Data28Region 3 Data41Region 4 Data54Region 5 Data67Region 6 Data80Region 7 Data93Region 8 Data106Region 9 Data119Region 10 Data132
MPAAA Salary Survey 2016/17Survey MethodologyThe data in this survey was collected from School District Pupil Accounting Staff,Educational Data Specialists, and ISD Auditors in November and December of 2016.The charts and graphs within represent the Association’s best attempts to accuratelyrepresent the survey results while still protecting individual privacy. Any data elementthat would represent the information for one individual is deleted when it could be usedto infer who that individual might be.Note that since not all respondents replied to every question, the data cannot be used inan additive way. Data points on an individual chart that are omitted had no one give thatresponse. Data points that are listed, but the salary amount is 0, is suppressed topreserve individual privacy.All responses received are assumed to be correct, accurate reflections of the salary andbenefits the individual respondent receives. No warranty is implied or expressed as tothe accuracy or correctness of any data supplied to the Association in its survey, orpresented in this result document.Note that much of the data reported is organized by Prosperity region. These regionswere developed by the Michigan Department of Technology Management and Budgetfor community development purposes. They are used here to provide handy clusters ofcounties that are economically similar. This is intended to prevent or minimize singlecounty/ISD identification of individuals.
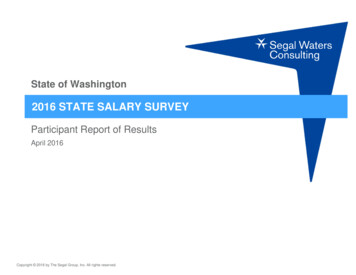
Salary Distribution for All RespondentsN 281 (Average Salary 43,096)60Count5040302010O0veKr 100KK 85-95K 80-85K 70-70K 65-75K 60-60K 55-65K 50-50K 45-55K 40-40K 35-45K-30 30-3 25 20-25K0Salary RangeAverage Salary by District SizeAverage Salary by Work YearLess than 1,000 studentsSchool Year1,001 - 5,000 Students5,001 - 10,000 Students10,001 - 15,000 StudentsYear-roundOver 15,000 Students 0 20,000 40,000 60,000 80,000 0Average Salary by Job Percentage 20,000 40,000 60,000 80,000Average Salary by Education Level0 - 24%HS Graduate25 - 49%Some College50 - 74%Associate s Degree75 - 99%Bachelor s DegreeGraduate school/degree100% 0 20,000 40,000 60,000 0 80,000Average Salary by Certification 20,000 40,000 60,000 80,000Average Salary by Length of Service0-2 YearsNo Certification3-5 Years1 Certification6-10 YearsMore than 1Certification 0Over 10 Years 20,000 40,000 60,000 80,000 0 20,000 40,000 60,0001 80,000
Benefit Data - All RespondentsN 281Vacation Days for All RespondentsSick Days for All RespondentsAverage Vacation Days 18 daysAverage Sick Days 12 daysMaximum Vacation Days 42 daysMaximum Sick Days 24 daysMinimum Vacation Days 3 daysMinimum Sick Days 2 daysLife Insurance BenefitsLife Insurance Amount5%7%10%27%18%65%68%Offered, Fully PaidOffered, Partially Paid1 Less than 50,000Offered, Not PaidNot Offered3 Over 100,000Health Insurance Benefits4%3%2 50,00 - 100,000Health Insurance Carrier5%9%6%7%8%33%33%Offered, Fully Paid88%Offered,Partially PaidOffered, Not PaidNot Offered4%Blue Care Network HMOBlue Cross / Blue ShieldHealth Alliance PlanMESSA / Blue Cross Blue ShieldOtherPriority HealthWestern Michigan Health Insurance Pool2
Benefit Data - All RespondentsN 281Dental Insurance BenefitsDental Insurance Carrier12%4%3%36%47%46%43%9%Offered, Fully PaidOffered, Partially PaidADN-SETSEGBlue Cross / Blue ShieldOffered, Not PaidNot OfferedDelta DentalOtherVision Insurance Benefits3%Vision Insurance Carrier12%5%24%8%46%5%4%46%Offered, Fully PaidOffered, Partially PaidOffered, Not PaidNot Offered47%ADN-SETSEGEye MedNVA VisionShort Term DisabilityBlue Cross/Blue ShieldMESSA - VSPOtherLong Term Disability17%21%36%38%11%25%Offered, Fully Paid34%Offered, Partially PaidOffered, Fully Paid18%Offered, Partially PaidOffered, Not PaidNot OfferedOffered, Not PaidNot Offered3
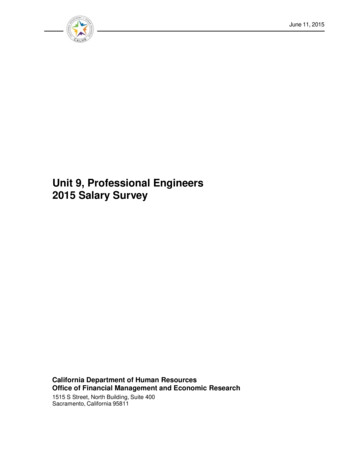
Salary Distribution for Educational Data SpecialistsN 48 (Average Salary 45,260)1210Count8642-65KOver 100KK 60-60K 55-55K 50-50K 45-45K 40 35-40K5-3 30 25-30K0Salary RangeAverage Salary by District SizeAverage Salary by Work YearLess than 1,000 studentsSchool Year1,001 - 5,000 Students5,001 - 10,000 Students10,001 - 15,000 StudentsYear-roundOver 15,000 Students 0 20,000 40,000 60,000 80,000 0Average Salary by Job Percentage 20,000 40,000 60,000 80,000Average Salary by Education Level0 - 24%HS Graduate25 - 49%Some College50 - 74%Associate s Degree75 - 99%Bachelor s DegreeGraduate school/degree100% 0 20,000 40,000 60,000 0 80,000Average Salary by Certification 20,000 40,000 60,000 80,000Average Salary by Length of Service0-2 YearsNo Certification3-5 Years1 Certification6-10 YearsMore than 1Certification 0Over 10 Years 20,000 40,000 60,000 80,000 0 20,000 40,000 60,0004 80,000
Benefit Data - Educational Data SpecialistsN 48Vacation Days for Educational Data SpecialistsSick Days for Educational Data SpecialistsAverage Vacation Days 18 daysAverage Sick Days 12 daysMaximum Vacation Days 37 daysMaximum Sick Days 24 daysMinimum Vacation Days 5 daysMinimum Sick Days 5 daysLife Insurance BenefitsLife Insurance Amount2%10%2%32%25%63%66%Offered, Fully PaidOffered, Partially Paid1 Less than 50,000Offered, Not PaidNot Offered3 Over 100,000Health Insurance Benefits4%2 50,00 - 100,000Health Insurance Carrier2%3%3%8%22%22%5%Offered, Fully PaidOffered, Not Paid94%Offered,Partially Paid37%Blue Care Network HMOBlue Cross / Blue ShieldHealth Alliance PlanMESSA / Blue Cross Blue ShieldOtherPriority HealthWestern Michigan Health Insurance Pool5
Benefit Data - Educational Data SpecialistsN 48Dental Insurance BenefitsDental Insurance Carrier21%39%46%54%28%Offered, Fully PaidOffered, Partially PaidADN-SETSEG12%Blue Cross / Blue ShieldDelta DentalOtherVision Insurance BenefitsVision Insurance Carrier6%18%26%46%13%3%48%5%Offered, Fully PaidOffered, Partially PaidNot OfferedADN-SETSEGEye MedNVA VisionShort Term Disability35%Blue Cross/Blue ShieldMESSA - VSPOtherLong Term Disability11%17%40%21%44%13%26%Offered, Fully PaidOffered, Partially Paid28%Offered, Fully PaidOffered, Not PaidNot OfferedOffered, Not PaidOffered, Partially PaidNot Offered6
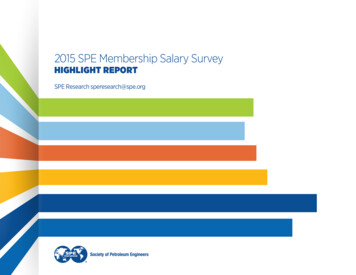
K-90K 85-85K 80-75K 70-70K 65-65K 60-60K 55-55K 50-50K 45-45K 40-40K5 35-30 30-3 25 20-25K454035302520151050KCountSalary Distribution for Pupil AccountantsN 198 (Average Salary 42,247)Salary RangeAverage Salary by District SizeAverage Salary by Work YearLess than 1,000 studentsSchool Year1,001 - 5,000 Students5,001 - 10,000 Students10,001 - 15,000 StudentsYear-roundOver 15,000 Students 0 20,000 40,000 60,000 80,000 0Average Salary by Job Percentage 20,000 40,000 60,000 80,000Average Salary by Education Level0 - 24%HS Graduate25 - 49%Some College50 - 74%Associate s Degree75 - 99%Bachelor s DegreeGraduate school/degree100% 0 20,000 40,000 60,000 0 80,000Average Salary by Certification 20,000 40,000 60,000 80,000Average Salary by Length of Service0-2 YearsNo Certification3-5 Years1 Certification6-10 YearsMore than 1Certification 0Over 10 Years 20,000 40,000 60,000 80,000 0 20,000 40,000 60,0007 80,000
Benefit Data - Pupil AccountantsN 198Vacation Days for Pupil AccountantsSick Days for Pupil AccountantsAverage Vacation Days 18 daysAverage Sick Days 11 daysMaximum Vacation Days 30 daysMaximum Sick Days 20 daysMinimum Vacation Days 3 daysMinimum Sick Days 2 daysLife Insurance BenefitsLife Insurance Amount4%9%10%25%18%63%71%Offered, Fully PaidOffered, Partially Paid1 Less than 50,000Offered, Not PaidNot Offered3 Over 100,000Health Insurance Benefits4%4%2 50,00 - 100,000Health Insurance Carrier4%6%2%12%31%9%5%Offered, Fully Paid86%Offered, Partially PaidOffered, Not PaidNot Offered37%Blue Care Network HMOBlue Cross / Blue ShieldHealth Alliance PlanMESSA / Blue Cross Blue ShieldOtherPriority HealthWestern Michigan Health Insurance Pool8
Benefit Data - Pupil AccountantsN 198Dental Insurance BenefitsDental Insurance Carrier9%4%3%33%44%49%49%9%Offered, Fully PaidOffered, Partially PaidADN-SETSEGBlue Cross / Blue ShieldOffered, Not PaidNot OfferedDelta DentalOtherVision Insurance Benefits3%Vision Insurance Carrier11%5%21%8%6%45%4%47%Offered, Fully PaidOffered, Partially PaidOffered, Not PaidNot Offered50%ADN-SETSEGEye MedNVA VisionShort Term DisabilityBlue Cross/Blue ShieldMESSA - VSPOtherLong Term Disability17%25%35%37%11%26%14%Offered, Fully Paid35%Offered, Partially PaidOffered, Fully PaidOffered, Partially PaidOffered, Not PaidNot OfferedOffered, Not PaidNot Offered9
Salary Distribution for Pupil AuditorsN 35 (Average Salary 44,929)6Count54321K-70K 65-65K 60-60K 55-55K 50-50K 45-45K 40-40K 35 30-35K0-3 25 20-25K0Salary RangeAverage Salary by District SizeAverage Salary by Work YearLess than 10,000 StudentsSchool Year10,001 - 25,000 Students25,001 - 50,000 StudentsYear-roundOver 50,000 Students 0 20,000 40,000 60,000 80,000 0Average Salary by Job Percentage 20,000 40,000 60,000 80,000Average Salary by Education Level0 - 24%HS Graduate25 - 49%Some College50 - 74%Associate s Degree75 - 99%Bachelor s DegreeGraduate school/degree100% 0 20,000 40,000 60,000 0 80,000Average Salary by Certification 20,000 40,000 60,000 80,000Average Salary by Length of Service0-2 YearsNo Certification3-5 Years1 Certification6-10 YearsMore than 1Certification 0Over 10 Years 20,000 40,000 60,000 80,000 0 20,000 40,000 60,00010 80,000
Benefit Data - Pupil AuditorsN 35Vacation Days for Pupil AuditorsSick Days for Pupil AuditorsAverage Vacation Days 19 daysAverage Sick Days 13 daysMaximum Vacation Days 42 daysMaximum Sick Days 24 daysMinimum Vacation Days 5 daysMinimum Sick Days 5 daysLife Insurance BenefitsLife Insurance Amount6%13%9%6%28%59%79%Offered, Fully PaidOffered, Partially Paid1 Less than 50,000Offered, Not PaidNot Offered3 Over 100,000Health Insurance Benefits9%3%2 50,00 - 100,000Health Insurance Carrier10%6%10%10%40%30%Offered, Fully Paid82%Partially PaidOffered,Offered, Not PaidNot OfferedBlue Care Network HMOBlue Cross / Blue ShieldMESSA / Blue Cross Blue ShieldOtherWestern Michigan Health Insurance Pool11
Benefit Data - Pupil AuditorsN 35Dental Insurance BenefitsDental Insurance Carrier6%21%9%45%53%32%31%Offered, Fully PaidOffered, Partially PaidADN-SETSEGBlue3%Cross / Blue ShieldOffered, Not PaidNot OfferedDelta DentalOtherVision Insurance Benefits9%Vision Insurance Carrier14%3%4%36%48%40%32%Offered, Fully PaidOffered, Partially PaidOffered, Not PaidNot OfferedADN-SETSEGEye MedNVA VisionShort Term Disability7%7%Blue Cross/Blue ShieldMESSA - VSPOtherLong Term Disability12%21%30%38%6%26%Offered, Fully Paid43%Offered, Partially PaidOffered, Fully PaidOffered, Not PaidNot OfferedOffered, Not Paid24%Offered, Partially PaidNot Offered12
Regional DataThe following pages organize survey results per the Prosperity Region map below:13
Regions by 5Ogemaw3Benzie2Jackson9Ontonagon1Berrien8Kalamazoo o3Cass8Keweenaw1Ottawa4Charlevoix2Lake4Presque Isle 3Cheboygan 3Lapeer6Roscommon 3Chippewa1Leelanau2Saginaw5Clare5Lenawee9Saint Clair6Clinton7Livingston9Saint Joseph 8Crawford3Luce1SanilacDelta1Mackinac1Schoolcraft 1Dickinson1Macomb10Shiawassee 6Eaton7Manistee2Tuscola6Emmet2Marquette1Van Buren8Genesee6Mason4Washtenaw 9Gladwin5Mecosta4Wayne10Gogebic1Menominee 1Wexford2Gr. Traverse 2Midland36514
Region 1Region 1 includes the Counties onSchoolcraft15
Region 1 - Salary Distribution for All RespondentsN 25 (Average Salary 33,500)87Count654321K 55-60K 45-50K 40-45K 35-40K 30-35K0-3 25 20-25K0Salary RangeAverage Salary by District SizeAverage Salary by Work YearLess than 1,000studentsSchool Year1,001 - 5,000StudentsYear-round 0 20,000 40,000 60,000 80,000Average Salary by Job Percentage 0 20,000 40,000 60,000 80,000Average Salary by Education Level0 - 24%HS GraduateSome College25 - 49%Associate s Degree50 - 74%Bachelor s DegreeGraduate school/degree75 - 99% 0 20,000 40,000 60,000 0 80,000Average Salary by Certification 20,000 40,000 60,000 80,000Average Salary by Length of Service0-2 YearsNo Certification3-5 Years1 Certification6-10 YearsMore than 1Certification 0Over 10 Years 20,000 40,000 60,000 80,000 0 20,000 40,000 60,00016 80,000
Region 1 Benefit Data - All RespondentsN 25Vacation Days for All RespondentsSick Days for All RespondentsAverage Vacation Days 17 daysAverage Sick Days 12 daysMaximum Vacation Days 30 daysMaximum Sick Days 24 daysMinimum Vacation Days 7 daysMinimum Sick Days 6 daysLife Insurance BenefitsLife Insurance Amount8%23%8%46%38%77%Offered, Fully PaidOffered, Partially PaidOffered, Not PaidNot Offered1 Less than 50,000Health Insurance Benefits4%2 50,00 - 100,000Health Insurance Carrier4%5%5%33%57%Blue Cross / Blue ShieldMESSA / Blue Cross Blue Shield92%Offered, Partially PaidOffered, Not PaidOtherNot OfferedPriority Health17
Region 1 Benefit Data - All RespondentsN 25Dental Insurance BenefitsDental Insurance Carrier21%38%11%62%68%ADN-SETSEGOffered, Fully PaidOffered, Partially PaidBlue Cross / Blue ShieldDelta DentalVision Insurance BenefitsVision Insurance Carrier22%36%64%78%ADN-SETSEGOffered, Fully PaidMESSA - VSPOffered, Partially PaidShort Term DisabilityLong Term Disability8%17%21%25%21%17%45%46%Offered, Fully PaidOffered, Partially PaidOffered, Fully PaidOffered, Partially PaidOffered, Not PaidNot OfferedOffered, Not PaidNot Offered18
K0 55-60-5 45 25-30K10.90.80.70.60.50.40.30.20.10KCountRegion 1 - Salary Distribution for Educational Data SpecialistsN 3 (Average Salary 44,167)Salary RangeAverage Salary by District SizeAverage Salary by Work YearLess than 1,000studentsYear-round1,001 - 5,000Students 0 20,000 40,000 60,000 80,000Average Salary by Job Percentage 0Average Salary by Education Level25 - 49%Associate sDegree50 - 74%Bachelor sDegree75 - 99%Graduateschool/degree 0 20,000 40,000 60,000 20,000 40,000 60,000 80,000 80,000Average Salary by Certification 0 20,000 40,000 60,000 80,000Average Salary by Length of ServiceNo Certification0-2 Years1 Certification3-5 YearsMore than 1Certification 0 20,000 40,000 60,000 80,000 0 20,000 40,000 60,000 80,00019
Region 1 Benefit Data - Educational Data SpecialistsN 3Vacation Days for Educational Data SpecialistsSick Days for Educational Data SpecialistsAverage Vacation Days 17 daysAverage Sick Days 17 daysMaximum Vacation Days 24 daysMaximum Sick Days 24 daysMinimum Vacation Days 12 daysMinimum Sick Days 10 daysLife Insurance BenefitsLife Insurance Amount33%33%67%Offered, Fully PaidOffered, Partially Paid67%1 Less than 50,000Health Insurance Benefits2 50,00 - 100,000Health Insurance Carrier33%67%Blue Cross / Blue Shield100%Offered, Partially PaidMESSA / Blue Cross Blue Shield20
Region 1 Benefit Data - Educational Data SpecialistsN 3Dental Insurance BenefitsDental Insurance Carrier33%50%50%67%Offered, Fully PaidOffered, Partially PaidBlue Cross / Blue ShieldVision Insurance BenefitsDelta DentalVision Insurance Carrier33%50%50%67%ADN-SETSEGOffered, Fully PaidShort Term DisabilityLong Term Disability33%67%Offered, Fully PaidMESSA - VSPOffered, Partially Paid33%67%Offered, Partially PaidOffered, Fully PaidOffered, Partially Paid21
Region 1 - Salary Distribution for Pupil AccountantsN 17 (Average Salary 30,735)6Count54321K 45-50K 40-45K 35-40K 30-35K0-3 25 20-25K0Salary RangeAverage Salary by District SizeAverage Salary by Work YearLess than 1,000studentsSchool Year1,001 - 5,000StudentsYear-round 0 20,000 40,000 60,000 80,000Average Salary by Job Percentage 0 20,000HS Graduate25 - 49%Some College50 - 74%Associate s Degree75 - 99%Bachelor s Degree 20,000 40,000 60,000 60,000 80,000Average Salary by Education Level0 - 24% 0 40,000 0 80,000Average Salary by Certification 20,000 40,000 60,000 80,000Average Salary by Length of Service0-2 YearsNo Certification3-5 Years6-10 Years1 CertificationOver 10 Years 0 20,000 40,000 60,000 80,000 0 20,000 40,000 60,00022 80,000
Region 1 Benefit Data - Pupil AccountantsN 17Vacation Days for Pupil AccountantsSick Days for Pupil AccountantsAverage Vacation Days 18 daysAverage Sick Days 11 daysMaximum Vacation Days 30 daysMaximum Sick Days 14 daysMinimum Vacation Days 7 daysMinimum Sick Days 6 daysLife Insurance BenefitsLife Insurance Amount13%14%6%38%43%86%Offered, Fully PaidOffered, Partially PaidOffered, Not PaidNot Offered1 Less than 50,000Health Insurance Benefits2 50,00 - 100,000Health Insurance Carrier8%6%23%6%69%Blue Cross / Blue ShieldMESSA / Blue Cross Blue Shield88%Offered, Partially PaidOffered, Not PaidNot OfferedPriority Health23
Region 1 Benefit Data - Pupil AccountantsN 17Dental Insurance BenefitsDental Insurance Carrier20%41%7%59%73%ADN-SETSEGOffered, Fully PaidOffered, Partially PaidBlue Cross / Blue ShieldDelta DentalVision Insurance BenefitsVision Insurance Carrier15%41%59%85%ADN-SETSEGOffered, Fully PaidMESSA - VSPOffered, Partially PaidShort Term DisabilityLong Term Disability6%12%12%29%35%53%53%Offered, Fully PaidOffered, Partially PaidOffered, Not PaidNot OfferedOffered, Partially PaidOffered, Not PaidNot Offered24
K5 40-40-4 35 30-35K21.81.61.41.210.80.60.40.20KCountRegion 1 - Salary Distribution for Pupil AuditorsN 5 (Average Salary 36,500)Salary RangeAverage Salary by District SizeAverage Salary by Work YearLess than 10,000Students 0Year-round 20,000 40,000 60,000 80,000Average Salary by Job Percentage 0Average Salary by Education Level25 - 49%Some College50 - 74%Associate sDegree75 - 99%Bachelor sDegree 0 20,000 40,000 60,000 20,000 40,000 60,000 80,000 80,000Average Salary by Certification 0 20,000 40,000 60,000 80,000Average Salary by Length of Service0-2 YearsNo Certification6-10 Years1 Certification 0Over 10 Years 20,000 40,000 60,000 80,000 0 20,000 40,000 60,00025 80,000
Region 1 Benefit Data - Pupil AuditorsN 5Vacation Days for Pupil AuditorsSick Days for Pupil AuditorsAverage Vacation Days 15 daysAverage Sick Days 14 daysMaximum Vacation Days 24 daysMaximum Sick Days 20 daysMinimum Vacation Days 10 daysMinimum Sick Days 10 daysLife Insurance BenefitsLife Insurance Amount20%40%20%60%Offered, Fully Paid60%Offered, Partially PaidOffered, Not Paid1 Less than 50,000Health Insurance Benefits2 50,00 - 100,000Health Insurance Carrier20%40%40%Blue Cross / Blue Shield100%Offered, Partially PaidMESSA / Blue Cross Blue ShieldOther26
Region 1 Benefit Data - Pupil AuditorsN 5Dental Insurance BenefitsDental Insurance Carrier25%50%50%75%Offered, Fully PaidADN-SETSEGOffered, Partially PaidVision Insurance BenefitsDelta DentalVision Insurance Carrier20%33%67%80%ADN-SETSEGOffered, Fully PaidMESSA - VSPOffered, Partially PaidShort Term DisabilityLong Term Disability25%50%50%50%25%Offered, Fully PaidOffered, Fully PaidOffered, Not PaidOffered, Partially PaidOffered, Not Paid27
Region 2Region 2 includes the Counties of:AntrimBenzieCharlevoixEmmetGrand TraverseKalkaskaLeelanauManisteeMissaukeeWexford28
Region 2 - Salary Distribution for All RespondentsN 20 (Average Salary 34,500)87Count654321K 40-45K 35-40K 30-35K0-3 25 20-25K0Salary RangeAverage Salary by District SizeAverage Salary by Work YearLess than 1,000studentsSchool Year1,001 - 5,000StudentsYear-round 0 20,000 40,000 60,000 80,000Average Salary by Job Percentage 0 20,000 40,000 60,000 80,000Average Salary by Education Level0 - 24%HS Graduate25 - 49%Some College50 - 74%Associate s Degree75 - 99%Bachelor s DegreeGraduate school/degree100% 0 20,000 40,000 60,000 0 80,000Average Salary by Certification 20,000 40,000 60,000 80,000Average Salary by Length of Service0-2 YearsNo Certification6-10 Years1 Certification 0Over 10 Years 20,000 40,000 60,000 80,000 0 20,000 40,000 60,00029 80,000
Region 2 Benefit Data - All RespondentsN 20Vacation Days for All RespondentsSick Days for All RespondentsAverage Vacation Days 17 daysAverage Sick Days 10 daysMaximum Vacation Days 30 daysMaximum Sick Days 12 daysMinimum Vacation Days 5 daysMinimum Sick Days 4 daysLife Insurance BenefitsLife Insurance Amount28%44%22%Offered, Fully Paid6% Partially PaidOffered,Offered, Not PaidNot Offered100%1 Less than 50,000Health Insurance Benefits5%5%Health Insurance Carrier5%10%42%37%16%Blue Care Network HMOBlue Cross / Blue ShieldOffered, Fully PaidOffered, Not Paid80%Offered, Partially PaidNot OfferedMESSA / Blue Cross Blue ShieldPriority Health30
Region 2 Benefit Data - All RespondentsN 20Dental Insurance BenefitsDental Insurance Carrier5%5%5%30%37%58%60%Offered, Fully PaidOffered, Partially PaidOffered, Not PaidNot OfferedADN-SETSEGVision Insurance Benefits5%Delta DentalOtherVision Insurance Carrier11%5%32%52%32%58%Offered, Fully PaidOffered, Partially PaidOffered, Not PaidNot Offered5%ADN-SETSEGBlue Cross/Blue ShieldMESSA - VSPOtherShort Term DisabilityLong Term Disability24%24%35%35%6%29%12%Offered, Fully Paid35%Offered, Partially PaidOffered, Fully PaidOffered, Partially PaidOffered, Not PaidNot OfferedOffered, Not PaidNot Offered31
Region 2 - Salary Distribution for Educational Data SpecialistsN 1This page is suppressed to prevent individual information from being displayed.32
Region 2 Benefit Data - Educational Data SpecialistsN 1Vacation Days for Educational Data SpecialistsSick Days for Educational Data SpecialistsAverage Vacation Days 05 daysAverage Sick Days 12 daysMaximum Vacation Days 5 daysMaximum Sick Days 12 daysMinimum Vacation Days 5 daysMinimum Sick Days 12 daysLife Insurance BenefitsLife Insurance Amount100%Offered, Fully PaidHealth Insurance Benefits100%1 Less than 50,000Health Insurance Carrier100%100%Blue Cross / Blue ShieldOffered, Partially Paid33
Region 2 Benefit Data - Educational Data SpecialistsN 1Dental Insurance Benefits100%Offered, Fully PaidVision Insurance Benefits100%Dental Insurance Carrier100%ADN-SETSEGVision Insurance Carrier100%ADN-SETSEGOffered, Fully PaidShort Term Disability100%Offered, Fully PaidLong Term Disability100%Offered, Fully Paid34
K 40-45K 35-40K5 30-30-3 25 20-25K54.543.532.521.510.50KCountRegion 2 - Salary Distribution for Pupil AccountantsN 15 (Average Salary 32,833)Salary RangeAverage Salary by District SizeAverage Salary by Work YearLess than 1,000studentsSchool Year1,001 - 5,000StudentsYear-round 0 20,000 40,000 60,000 80,000Average Salary by Job Percentage 0 20,000 40,000 60,000 80,000Average Salary by Education Level0 - 24%HS Graduate25 - 49%Some College50 - 74%Associate s Degree75 - 99%Bachelor s DegreeGraduate school/degree100% 0 20,000 40,000 60,000 0 80,000Average Salary by Certification 20,000 40,000 60,000 80,000Average Salary by Length of Service0-2 YearsNo Certification6-10 Years1 Certification 0Over 10 Years 20,000 40,000 60,000 80,000 0 20,000 40,000 60,00035 80,000
Region 2 Benefit Data - Pupil AccountantsN 15Vacation Days for Pupil AccountantsSick Days for Pupil AccountantsAverage Vacation Days 16 daysAverage Sick Days 10 daysMaximum Vacation Days 30 daysMaximum Sick Days 12 daysMinimum Vacation Days 7 daysMinimum Sick Days 4 daysLife Insurance BenefitsLife Insurance Amount31%38%8%Offered, Fully PaidOffered, Not Paid23%Offered, Partially Paid100%Not Offered1 Less than 50,000Health Insurance Benefits7%Health Insurance Carrier13%21%58%21%Blue Cross / Blue ShieldMESSA / Blue Cross Blue Shield80%Offered, Fully PaidOffered, Partially PaidNot OfferedPriority Health36
Region 2 Benefit Data - Pupil AccountantsN 15Dental Insurance BenefitsDental Insurance Carrier7%7%27%50%43%66%Offered, Fully PaidOffered, Partially PaidNot OfferedADN-SETSEGVision Insurance BenefitsDelta DentalOtherVision Insurance Carrier14%7%29%43%36%64%Offered, Fully PaidOffered, Partially PaidNot OfferedADN-SETSEG7%BlueCross/Blue ShieldMESSA - VSPOtherShort Term DisabilityLong Term Disability17%33%33%8%50%25%17%17%Offered, Fully PaidOffered, Partially PaidOffered, Fully PaidOffered, Partially PaidOffered, Not PaidNot OfferedOffered, Not PaidNot Offered37
5-4 40 35-40K21.81.61.41.210.80.60.40.20KCountRegion 2 - Salary Distribution for Pupil AuditorsN 4 (Average Salary 40,000)Salary RangeAverage Salary by District SizeAverage Salary by Work YearLess than 10,000StudentsYear-round10,001 - 25,000Students 0 20,000 40,000 60,000 80,000Average Salary by Job Percentage 0 20,000 40,000 60,000 80,000Average Salary by Education Level0 - 24%Some College25 - 49%Associate sDegree75 - 99% 0 20,000 40,000 60,000 80,000Average Salary by Certification 00-2 Years1 CertificationOver 10 Years 20,000 40,000 60,000 40,000 60,000 80,000Average Salary by Length of ServiceNo Certification 0 20,000 80,000 0 20,000 40,000 60,00038 80,000
Region 2 Benefit Data - Pupil AuditorsN 4Vacation Days for Pupil AuditorsSick Days for Pupil AuditorsAverage Vacation Days 25 daysAverage Sick Days 12 daysMaximum Vacation Days 30 daysMaximum Sick Days 12 daysMinimum Vacation Days 20 daysMinimum Sick Days 12 daysLife Insurance BenefitsLife Insurance Amount25%75%100%Offered, Fully PaidOffered, Not Paid1 Less than 50,000Health Insurance BenefitsHealth Insurance Carrier25%25%75%75%Blue Care Network HMOOffered, Partially PaidBlue Cross / Blue ShieldOffered, Not Paid39
Region 2 Benefit Data - Pupil AuditorsN 4Dental Insurance Benefits25%25%Dental Insurance Carrier25%75%Offered, Fully Paid50%Offered, Partially PaidOffered, Not PaidADN-SETSEGVision Insurance Benefits25%25%Delta DentalVision Insurance Carrier25%75%Offered, Fully Paid50%Offered, Partially PaidADN-SETSEGMESSA - VSPOffered, Not PaidShort Term DisabilityLong Term Disability25%75%Offered, Fully Paid25%75%Offered, Not PaidOffered, Fully PaidOffered, Not Paid40
Region 3Region 3 includes the Counties emawOscodaOtsegoPresque IsleRoscommon41
K 45-50K 40-45K 35-40K5 30-30-3 25 20-25K54.543.532.521.510.50KCountRegion 3 - Salary Distribution for All RespondentsN 13 (Average Salary 34,808)Salary RangeAverage Salary by District SizeAverage Salary by Work YearLess than 1,000studentsSchool Year1,001 - 5,000StudentsYear-round 0 20,000 40,000 60,000 80,000Average Salary by Job Percentage 0 20,000HS Graduate25 - 49%Some College50 - 74%Associate s Degree75 - 99%Bachelor s Degree 20,000 40,000 60,000 60,000 80,000Average Salary by Education Level0 - 24% 0 40,000 0 80,000Average Salary by Certification 20,000 40,000 60,000 80,000Average Salary by Length of Service0-2 YearsNo Certification3-5 Years1 Certification6-10 YearsMore than 1Certification 0Over 10 Years 20,000 40,000 60,000 80,000 0 20,000 40,000 60,00042 80,000
Region 3 Benefit Data - All RespondentsN 13Vacation Days for All RespondentsSick Days for All RespondentsAverage Vacation Days 14 daysAverage Sick Days 12 daysMaximum Vacation Days 30 daysMaximum Sick Days 15 daysMinimum Vacation Days 3 daysMinimum Sick Days 7 daysLife Insurance BenefitsLife Insurance Amount8%8%84%100%Offered, Fully PaidOffered, Partially PaidNot Offered1 Less than 50,000Health Insurance Benefits8%Health Insurance Carrier9%8%9%9%8%37%36%Offered, Fully Paid76%Offered, Partially PaidOffered, Not PaidNot OfferedBlue Care Network HMOBlue Cross / Blue ShieldMESSA / Blue Cross Blue ShieldOtherPriority Health43
Region 3 Benefit Data - All RespondentsN 13Dental Insurance BenefitsDental Insurance Carrier10%8%8%20%8%60%10%76%Offered, Fully PaidOffered, Partially PaidADN-SETSEGBlue Cross / Blue ShieldOffered, Not PaidNot OfferedDelta DentalOtherVision Insurance BenefitsVision Insurance Carrier11%15%33%8%8%69%56%Offered, Fully PaidOffered, Partially PaidOffered, Not PaidNot OfferedADN-SETSEGShort Term DisabilityMESSA - VSPOtherLong Term Disability23%38%46%8%69%8%Offered, Fully PaidOffered, Fully PaidOffered, Partially PaidNot OfferedOffered, Not Paid8%Offered, Partially PaidNot Offered44
5-4 40 35-40K21.81.61.41.210.80.60.40.20KCountRegion 3 - Salary Distribution for Educational Data SpecialistsN 3 (Average Salary 39,167)Salary RangeAverage Salary by District SizeAverage Salary by Work YearLess than 1,000students 0Year-round 20,000 40,000 60,000 80,000Average Salary by Job Percentage 0 20,000 40,000 60,000 80,000Average Salary by Education Level0 - 24%HS Graduate25 - 49%Bachelor sDegree75 - 99% 0 20,000 40,000 60,000 80,000Average Salary by Certification 06-10 Years1 CertificationOver 10 Years 20,000 40,000 60,000 40,000 60,000 80,000Average Salary by Length of ServiceNo Certification 0 20,000 80,000 0 20,000 40,000 60,00045 80,000
Region 3 Benefit Data - Educational Data SpecialistsN 3Vacation Days for Educational Data SpecialistsSick Days for Educational Data SpecialistsAverage Vacation Days 05 daysAverage Sick Days 14 daysMaximum Vacation Days 5 daysMaximum Sick Days 15 daysMinimum Vacation Days 5 daysMinimum Sick Days 13 daysLife Insurance BenefitsLife Insurance Amount33%67%100%Offered, Fully PaidOffered, Partially Paid1 Less than 50,000Health Insurance BenefitsHealth Insurance Carrier33%67%100%Blue Care Network HMOOffered, Fully PaidOffered, Partially Paid46
Region 3 Benefit Data - Educational Data SpecialistsN 3Dental Insurance BenefitsDental Insurance Carrier100%100%ADN-SETSEGOffered, Fully PaidVision Insurance BenefitsVision Insurance Carrier33%67%100%ADN-SETSEGOffered, Fully PaidNot OfferedShort Term DisabilityLong Term Disability33%67%100%Not OfferedOffered
Average Salary by District Size Average Salary by Work Year Average Salary by Job Percentage Average Salary by Education Level Average Salary by Certification Average Salary by Length of Service. 0 20,000 40,000 60,000 80,000. 100% 75 - 99% 50 - 74% 25 - 49% 0 - 24%. 0 20,000 40,000 60,000 80,000. Graduate school/degree Bachelor s Degree